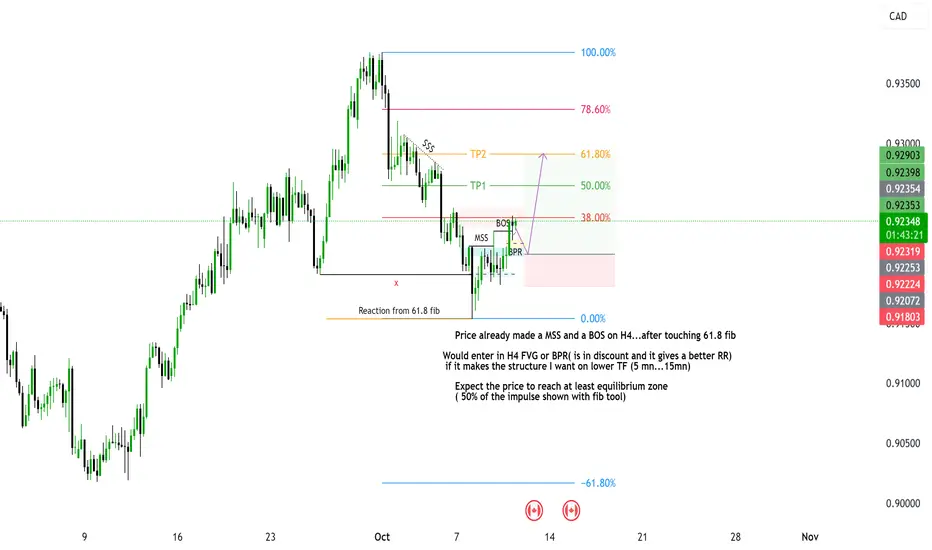
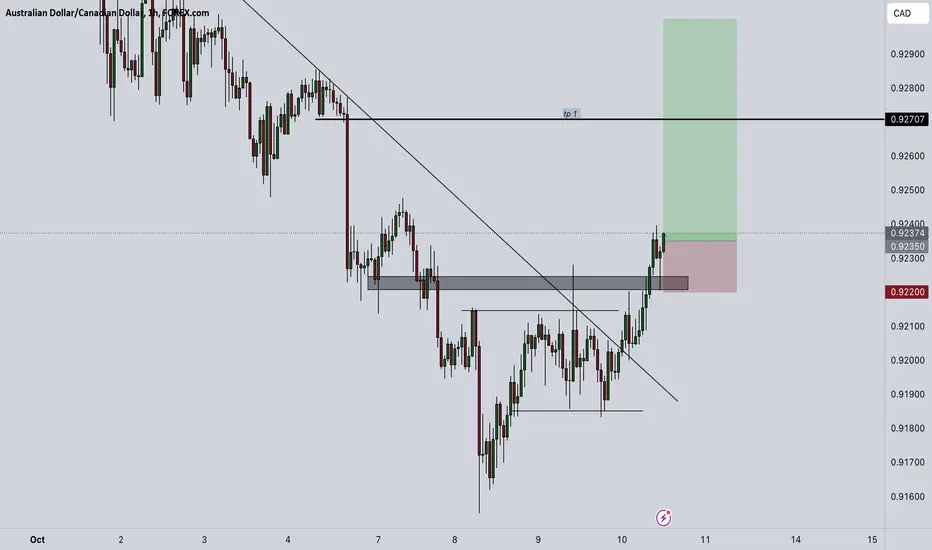
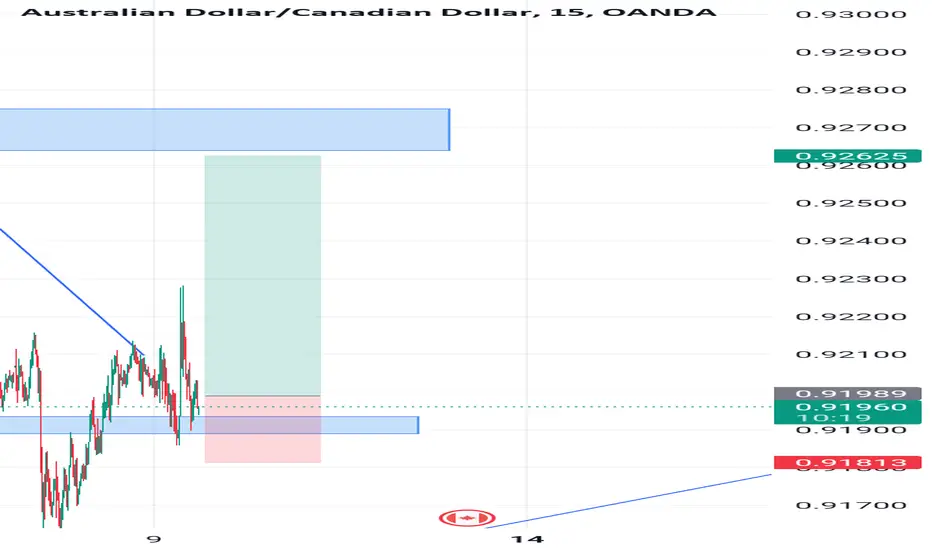
AUDCAD longPrice reacted from golden pocket fib tool and made a MSS and a BOS on H4.
I would like the price to retrace in H4 FVG or BPR(is in discount and offers a better RR) for a long.
Expecting the price to go at least to equilibrium area ( 50% fib TP1).
Good luck! :)
CADAUD trade ideas
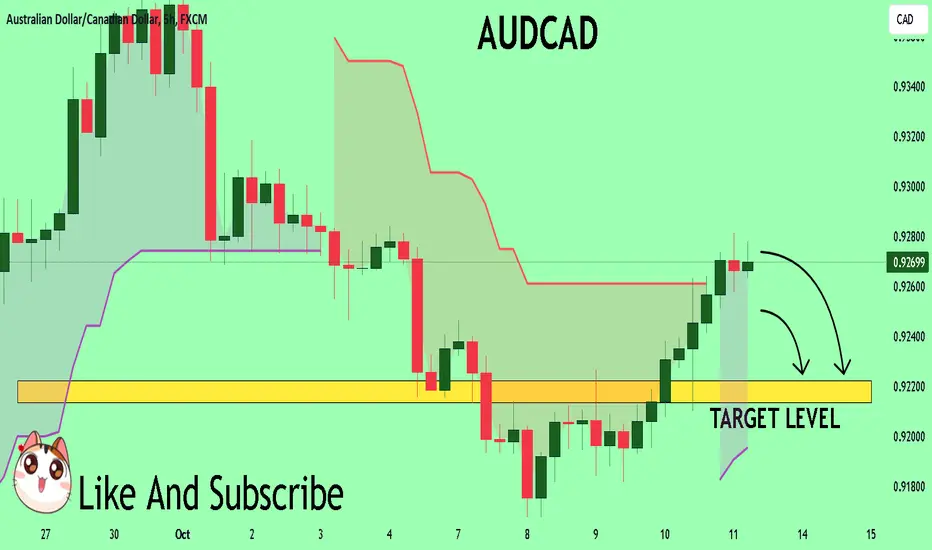
AUDCAD My Opinion! SELL!
My dear friends,
My technical analysis for AUDCAD is below:
The market is trading on 0.9270 pivot level.
Bias - Bearish
Technical Indicators: Both Super Trend & Pivot HL indicate a highly probable Bearish continuation.
Target - 0.9222
About Used Indicators:
A pivot point is a technical analysis indicator, or calculations, used to determine the overall trend of the market over different time frames.
———————————
WISH YOU ALL LUCK
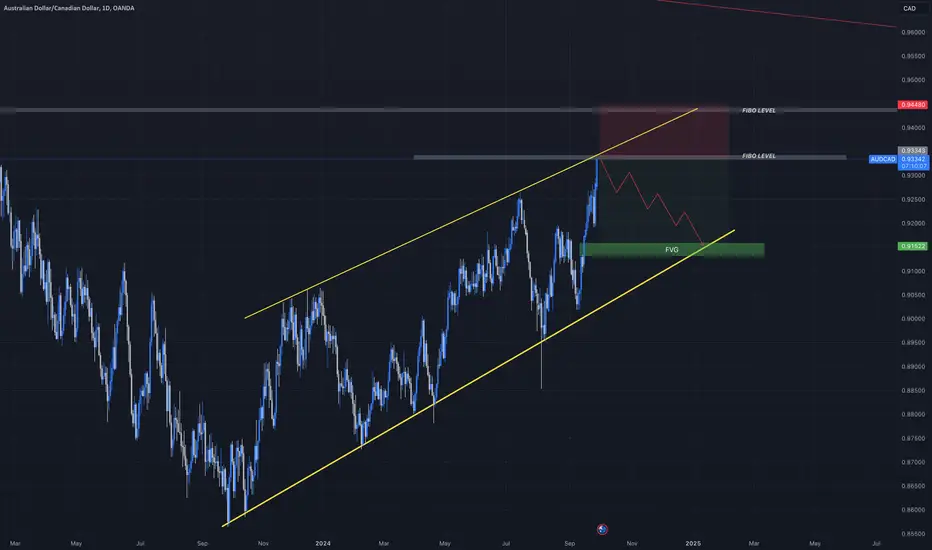
"AUD/CAD Retracement to Golden Pocket Signals Sell Opportunity"AUD/CAD has broken its structure and is now retracing to the golden pocket of the Fibonacci level, forming a lower high. A sell at the current market price is recommended.
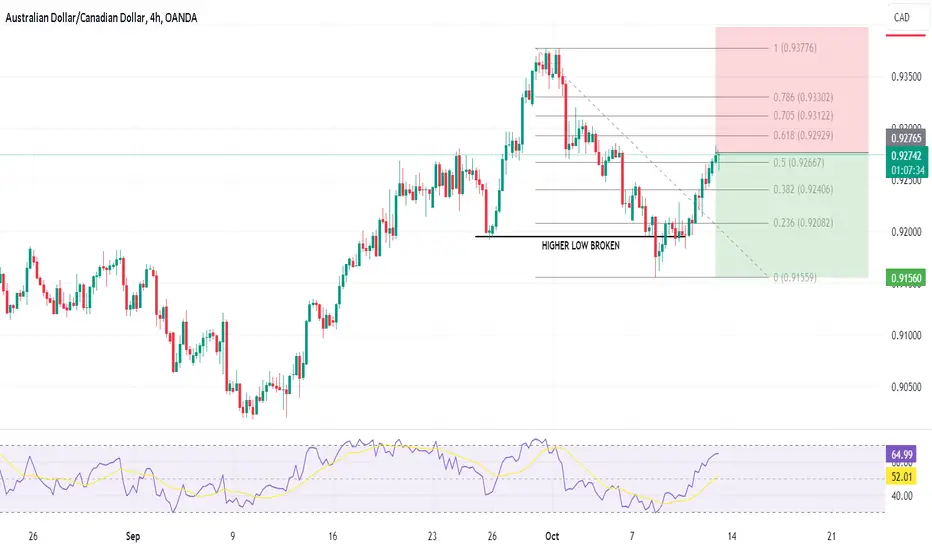
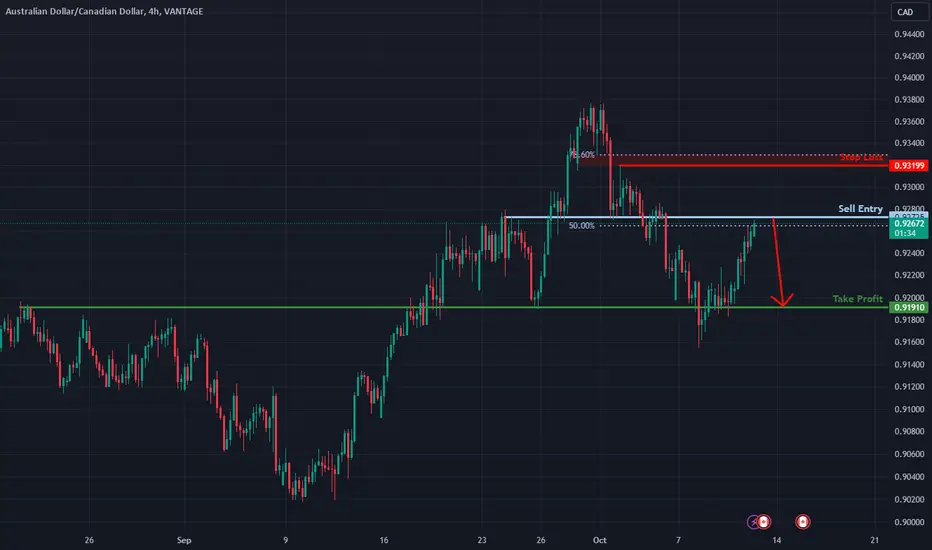
Bearish reversal?AUD/CAD is rising towards the resistance level which is an overlap resistance that is slightly above the 50% Fibonacci retracement and could reverse from this level to our take profit.
Entry: 0.92725
Why we like it:
There is an overlap resistance level that is slightly above the 50% Fibonacci retracement.
Stop loss: 0.93199
Why we like it:
There is a pullback resistance level that is slightly below the 78.6% Fibonacci retracement.
Take profit: 0.91910
Why we like it:
There is an overlap support level.
Enjoying your TradingView experience? Review us!
Please be advised that the information presented on TradingView is provided to Vantage (‘Vantage Global Limited’, ‘we’) by a third-party provider (‘Everest Fortune Group’). Please be reminded that you are solely responsible for the trading decisions on your account. There is a very high degree of risk involved in trading. Any information and/or content is intended entirely for research, educational and informational purposes only and does not constitute investment or consultation advice or investment strategy. The information is not tailored to the investment needs of any specific person and therefore does not involve a consideration of any of the investment objectives, financial situation or needs of any viewer that may receive it. Kindly also note that past performance is not a reliable indicator of future results. Actual results may differ materially from those anticipated in forward-looking or past performance statements. We assume no liability as to the accuracy or completeness of any of the information and/or content provided herein and the Company cannot be held responsible for any omission, mistake nor for any loss or damage including without limitation to any loss of profit which may arise from reliance on any information supplied by Everest Fortune Group.
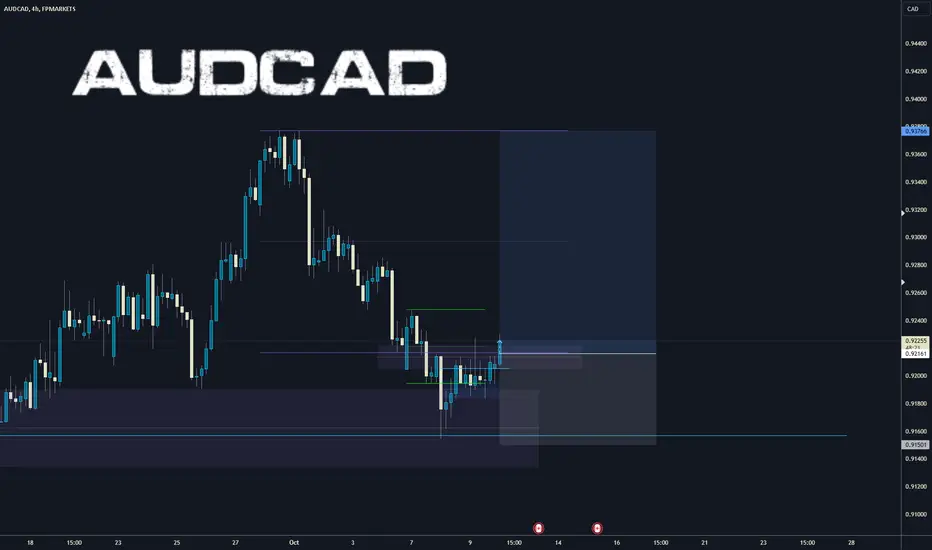
Taking longs on AUDCAD I think AUDCAD is going to the upside. I entered because the weekly bars is bullish and all the other timeframe aline with it as simple as that.
chart below is on the 2hr,
chart below is daily,
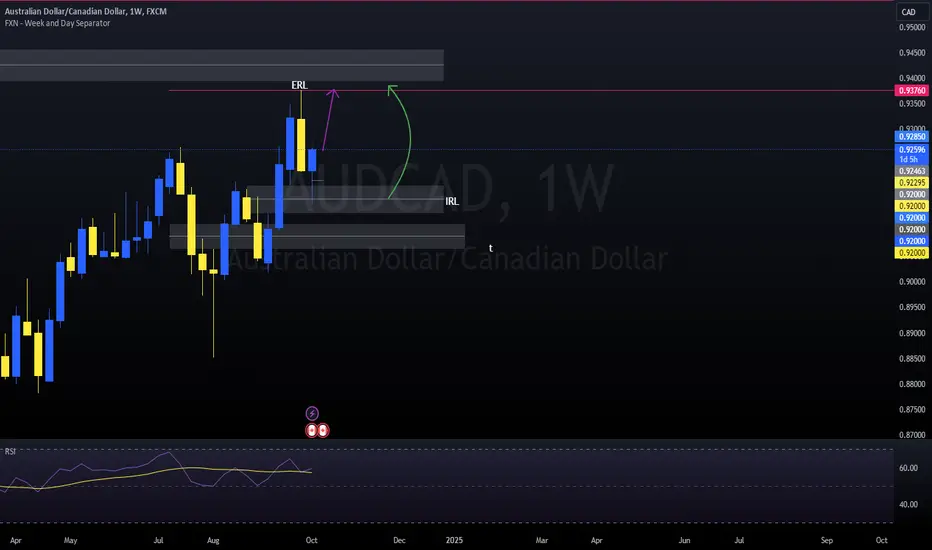
chart below is weekly,
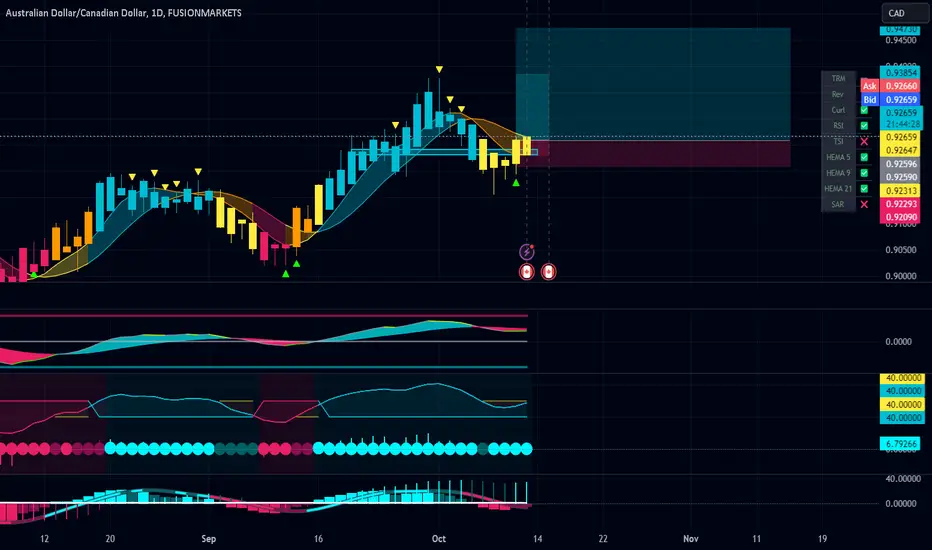
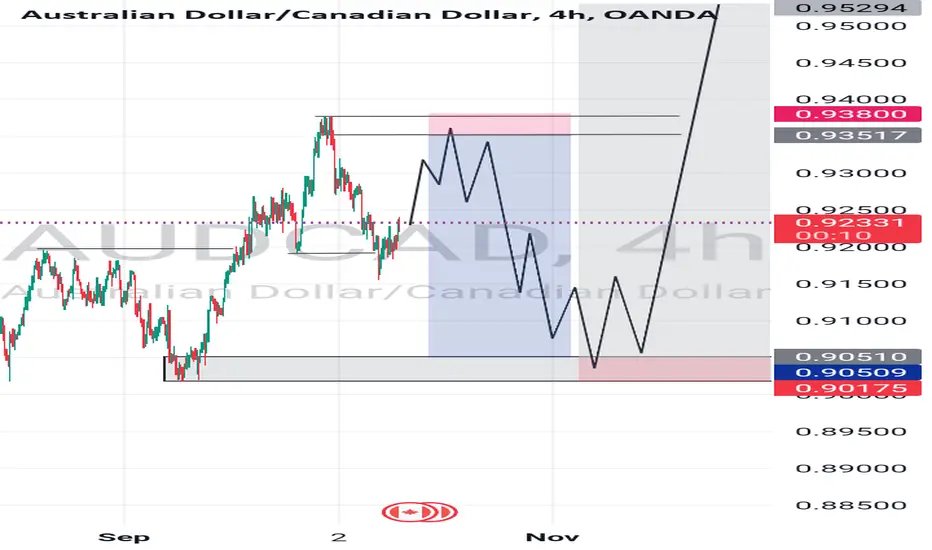
Its ready to go up. Daily / Weekly range from HTF levelIt's ready to go up. Daily / Weekly range from HTF level, it has all attributes for the successful trade.
I will be looking to position myself with my students and followers as highlighted on the chart if we get the confirmation.
Accumulation / Manipulation / Distribution
- No liquidity raid = No trade
- Never buy high and never sell low
“Adapt what is useful, reject what is useless, and add what is specifically your own.”
Dave FX Hunter ⚔
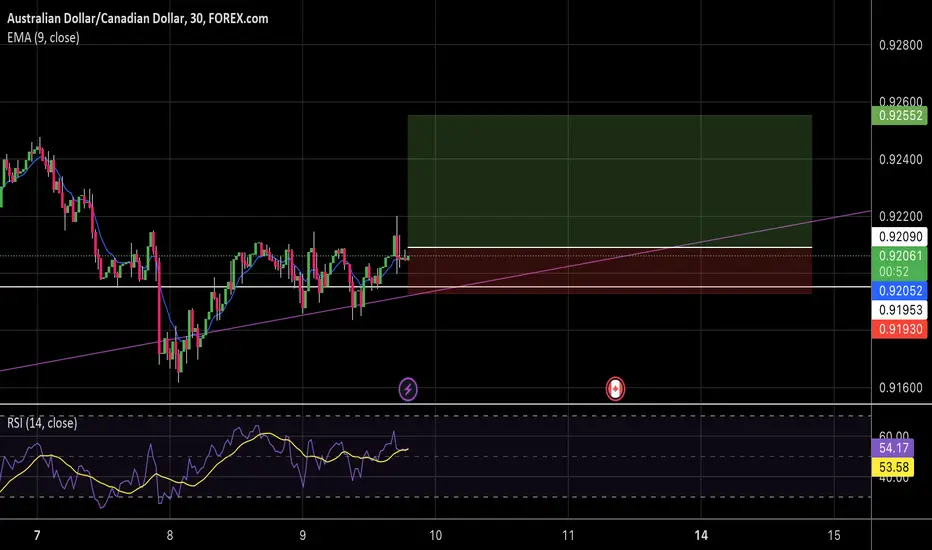
AUDCAD BUY OPPORTUNITYDaily break and retest completed.
Fibs and ema lining up. Looking to enter at .92090
AudCad Sell to BuyI already placed my pending orders to take advantage of the ranging movement before heading to the upside .
Happy trading.
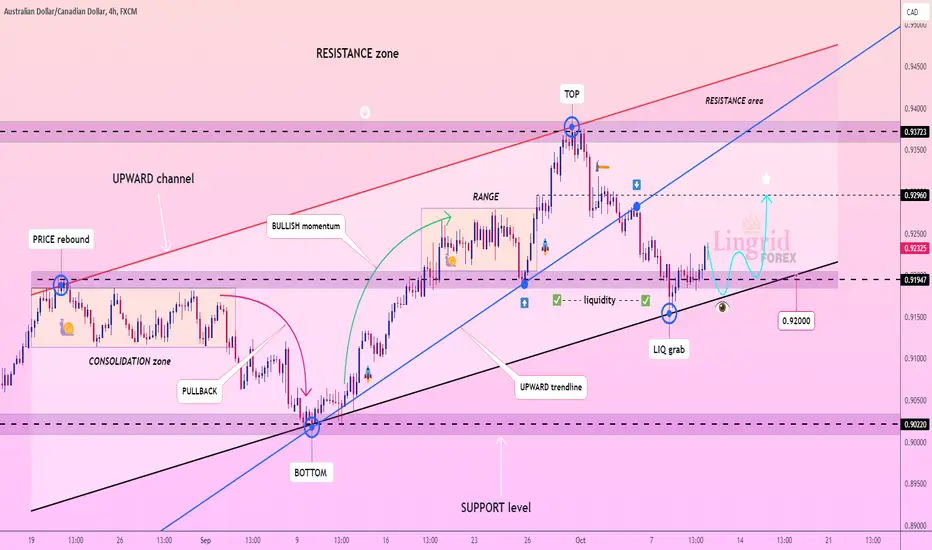
Lingrid | AUDCAD trend CONTINUATION OpportunityThe price perfectly fulfilled my last idea. It hit the target level. FX:AUDCAD took liquidity below the strong support level at 0.9200 and subsequently bounced back, closing above this level. This price action indicates that buyers stepped in to defend the support, and overall, the market trend remains bullish. On the daily timeframe, the formation of a long-tailed bar suggests a rejection of lower prices, further reinforcing the bullish sentiment. Similarly, on the weekly timeframe, the price took liquidity below the lows of the past two weeks. Therefore, I expect the bullish trend to continue, with a target set at the resistance zone around 0.92960.
Traders, if you liked this idea or if you have your own opinion about it, write in the comments. I will be glad 👩💻
AUDCAD BUYAUDCAD LONG bearish channel breakout.price rejected last structure .expecting more bullish pressure
AUDCAD BULLISH (1H Divergence, Break of Trendline and Structure)AUDCAD showing a bullish momentum with 1H Divergence, break of structure (BOS) i.e. DOW setup and also the break of falling trendline.
Entry: CMP
SL: Previous HL
TP: 1:1 R:R
What do you think guys, will it work?

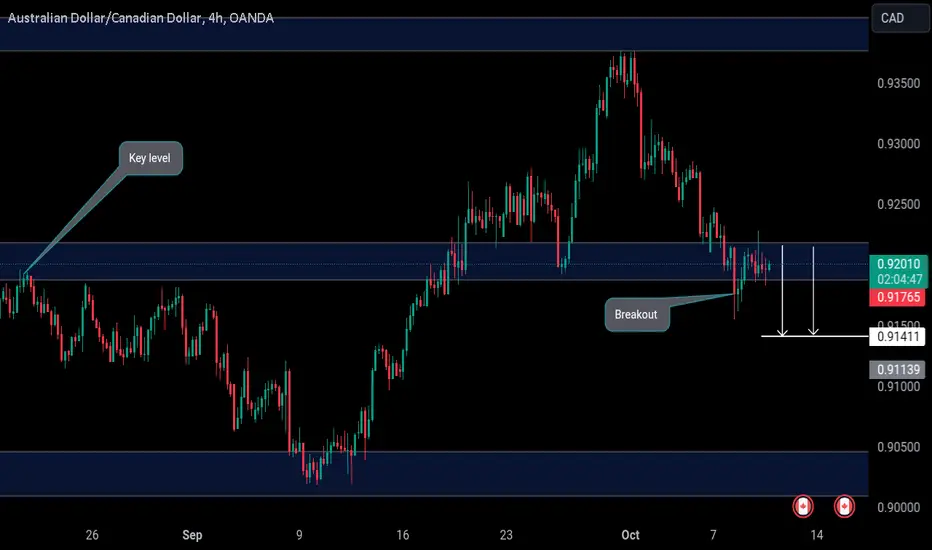
AUDCAD: Important Bearish BreakoutAUDCAD has broken and closed below a significant horizontal support level during the day.
After a retest, there has been a clear bearish reaction.
The pair may continue to decline towards the 0.9140 support level.
AUDCAD Long Term Selling Trading IdeaHello Traders
In This Chart AUDCAD HOURLY Forex Forecast By FOREX PLANET
today AUDCAD analysis 👆
🟢This Chart includes_ (AUDCAD market update)
🟢What is The Next Opportunity onAUDCAD Market
🟢how to Enter to the Valid Entry With Assurance Profit
This CHART is For Trader's that Want to Improve Their Technical Analysis Skills and Their Trading By Understanding How To Analyze The Market Using Multiple Timeframes and Understanding The Bigger Picture on the Charts

AUDCAD: Important Bearish BreakoutAUDCAD has broken and closed below a strong horizontal support level during the day.
Following a retest, there has been a noticeable bearish response. It is possible that the pair will continue to decline towards the 0.9140 support level.

AUDCAD READY FOR SHORT. Audcad coming from a strong bullish rally, is currently in the upper part of the bullish channel, we could expect a retracement from this area before resuming the bullish rally.
We will see.
Expecting those long on audcad but only if i get a confirmation We will be looking to go long on audcad provided we break out previous lh on 15 mins timeframe
AUDCAD BEARSDouble top in 4 hour chart. 20EMA cross below 40EMA in M15 & M1 chart! Continuation of downtrend, low failed to break high.

BUY AUDCAD - trade explained in detailTrader Tom, a technical analyst with over 15 years’ experience, explains his trade idea using price action and a top down approach. This is one of many trades so if you would like to see more then please follow us and hit the boost button.
We are proud to be an OFFICIAL Trading View partner so please support the channel by using the link below and unleash the power of trading view today!
tradingview.sweetlogin.com

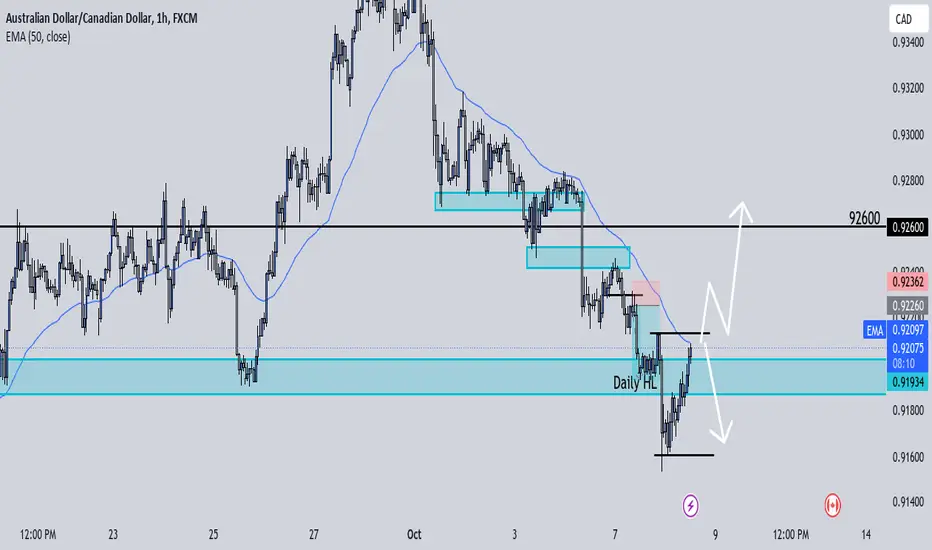
AudCad Trade IdeaAC is currently bearish while sitting at a daily HL. In my last AC post I spoke about getting into shorts IF price could break below the last daily HL. Price is currently back above the daily HL but longs aren't confirmed until the lower time frames lower high is broken and retested. At that point we would have a shift in structure to confirm longs. Patience is gonna pay on this set up.
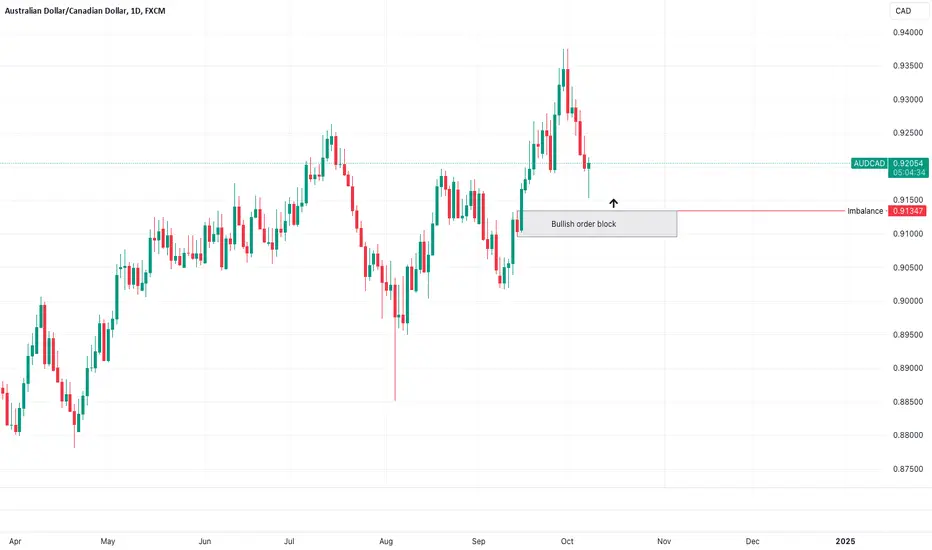
AUDCAD - Long from OB !!Hello traders!
‼️ This is my perspective on AUDCAD.
Technical analysis: Here we are in a bullish market structure from daily timeframe perspective, so I look for a long. My point of interest is price to fill the imbalance lower and then to reject from bullish OB.
Like, comment and subscribe to be in touch with my content!
Audcad Audcad weekly &Daily timeframe Bullish :
Weekly: Bullish structure +fvg( 61.8 fib level )
Daily: Bullish upchannel +fvg
1hr: ultra high volume in Down candle or bar
(Down bar ultra high volume showing strength )
(1hr ultrahigh volume bar break up then go for long entry)

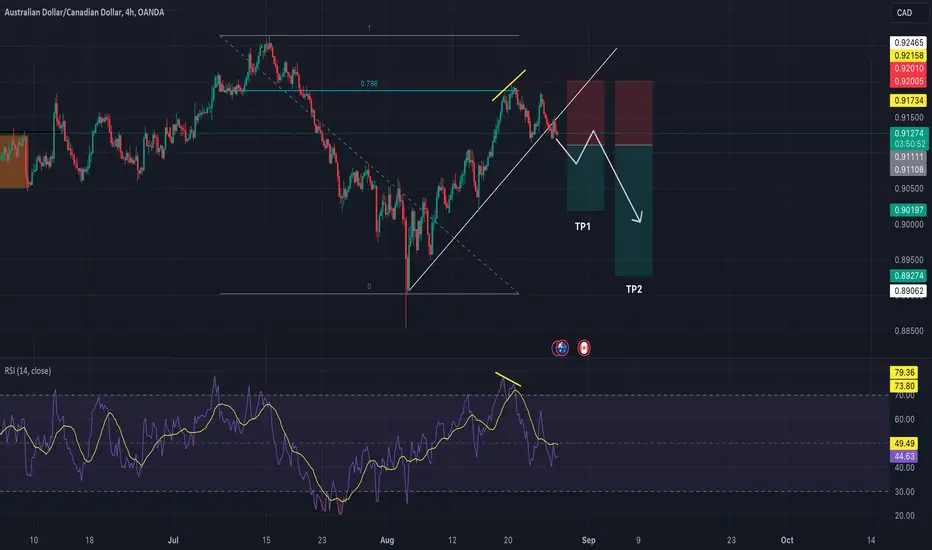
AUDCAD - Sell StopAUDCAD has strong domination of the selling side as shown in the chart.
Few of the points that show the price should go down is that the price has already touched 78% Fib retracement and the divergence on the 4h chart shows the momentum of the buyers has decreased.
We'll sell when the price breaks the previous low and should continue to go down. The price will then also break the trendline.
The strategy to win more and loss less is to have two trades with one as TP1 and the other as TP2, then TP1 hit then change the stoploss of other trade to breakeven making it risk-free trade.
The risk-reward by this will be 1:1.5.