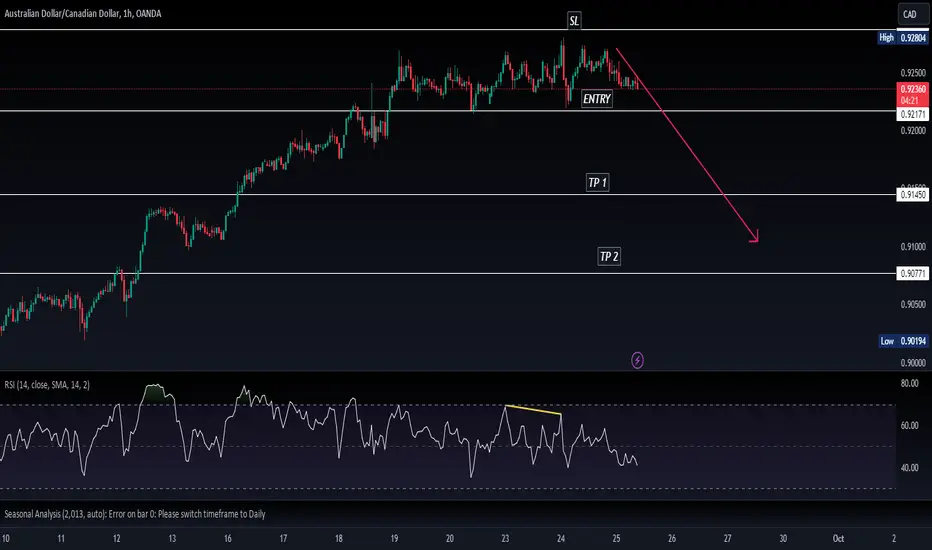
AUDCAD is BearishPrice was in a strong uptrend, however the bears seem to be assuming control of the price action owing to a bearish divergence on four hourly time frame. If the bearish momentum sustains then we can expect further slide in price. Targets are mentioned on the chart.
CADAUD trade ideas

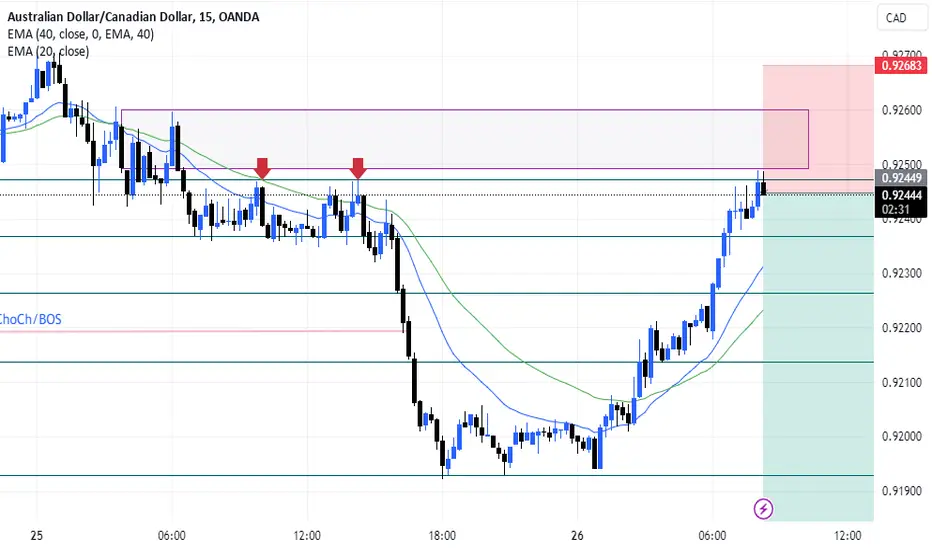
AUDCAD BEARSRetracement on the 61.8% Fibonacci level. High broke previous low, resulting in change in direction. Liquidity has been swept. Wait for a 20EMA to cross below 40EMA in M1 chart and a reversal candlestick in M5 for sells.
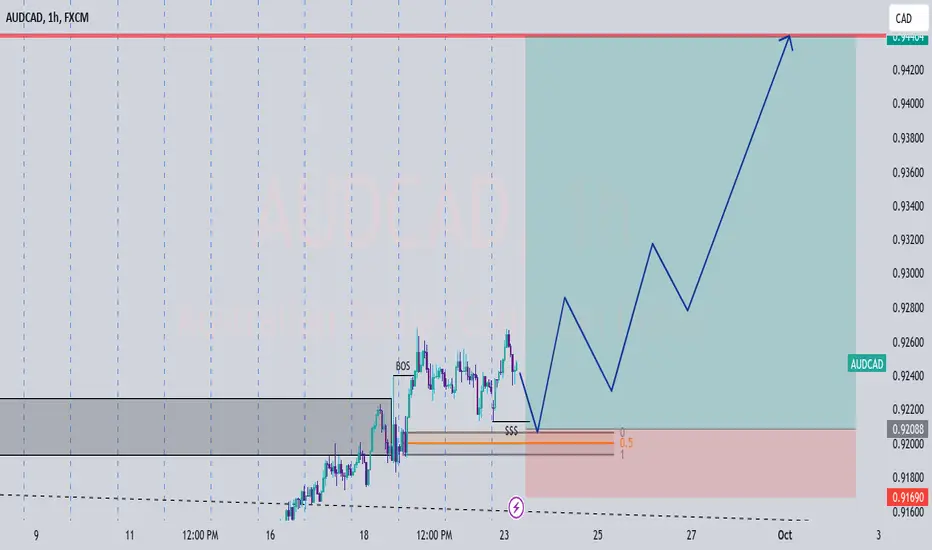
AUDCAD → Going Up Soon?Dear traders,
Here's a solid setup of a nice Break & Retest that we found on the H4 timeframe of AUDCAD! Price is also above the EMA line which gives us a nice confirmation that price could go bullish from here.

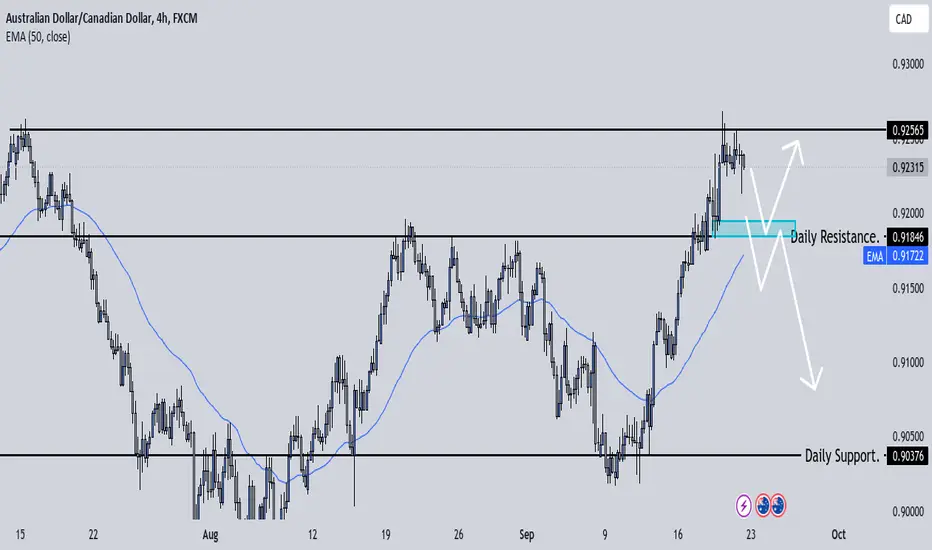
AUDCAD - 4hrs ( Sell Trade Target Range 150 PIP ) 🟢Pair Name : AUD/CAD
Time Frame : 4hrs Chart / Close
Scale Type : Large Scale
------
spreading knowledge among us and to clarify the most importan+t points of entry, exit and entry with more than 5 reasons
We seek to spread understanding rather than make money
🟢Key Technical / Direction ( Short )
Type : Mid Term Swing
———————————
✅Short Opportunity (Bearish Retest)
Key Level: 0.92050
This is the area where you're looking for a potential short entry based on several factors:
Reasons for Entry:
✅ Major Turn Level: A significant area where price has historically reversed.
✅ Visible Range LVN: A Low Volume Node on a volume profile, suggesting a weak price area that can be easily passed through if tested.
✅ Channel Break: Price breaking a channel structure, indicating potential for further downside.
✅ Day/Week Low: Price is near or at the low of a daily or weekly timeframe, adding significance to the level.
✅ Fixed POC Break: The Point of Control (POC) from a fixed range has been broken, signaling possible trend continuation.
✅ Fibonacci Golden Zone: The price is in a key Fibonacci retracement zone (61.8%-65%), which often serves as a reversal area.
✅Target Area (Bullish Reversal)
Key Level: 0.91000
This is where you’re watching for a potential bullish reversal.
Purpose of this Analysis
The goal here is not just to trade for profit but to spread knowledge and understanding about strategic entry and exit points. You’re focused on ensuring that decisions are backed by multiple reasons (more than 5 in this case), ensuring well-rounded and confident entries or exits.

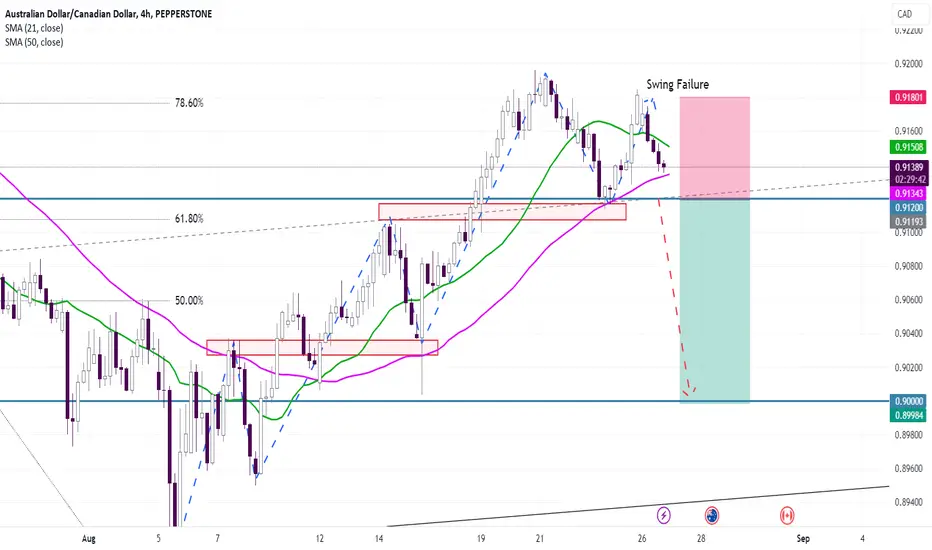
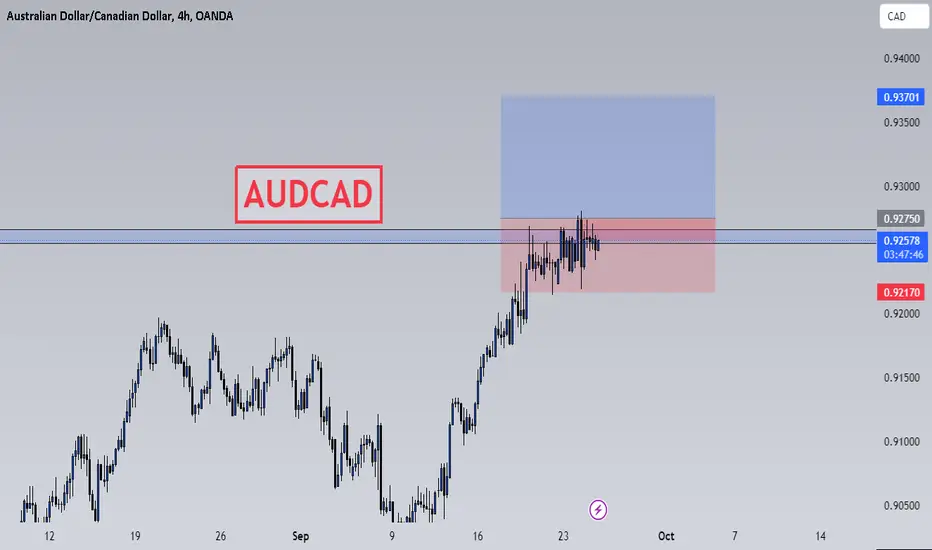
AUDCAD - Short TradeOn Tuesday (manipulation day) price swept the previous week high (PWH) with a great sign of weakness: a market structure break (MSB).
As a target, I prefer the opposite key level
I'm excited to see your opinion in the comments, and I'd like it if you could boost this idea if it was helpful for you!
Keep it simple and consistent! =)

AUD-CAD Risky Long! Buy!
Hello,Traders!
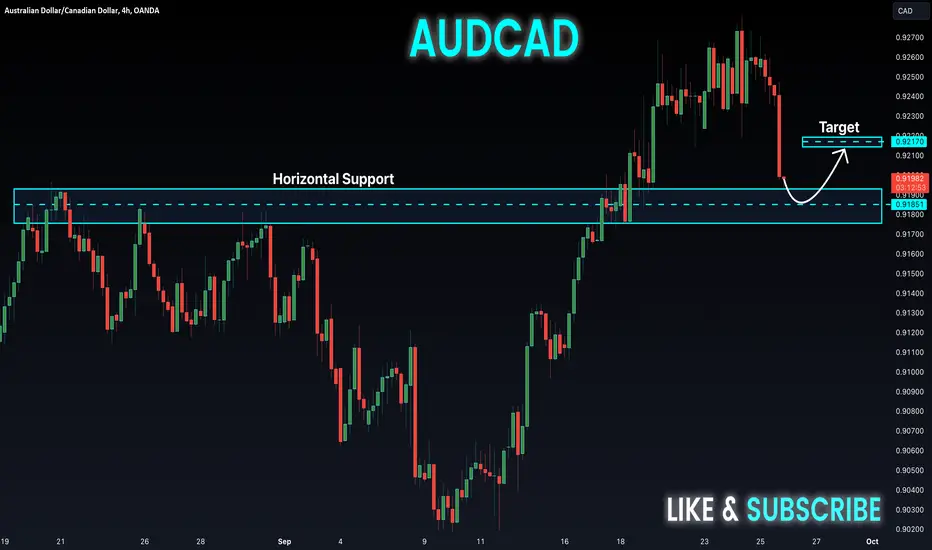
AUD-CAD went down
Sharply but the pair
Will soon hit a horizontal
Support level of 0.9185
So after the retest we
Will be expecting a
Local bullish rebound
Buy!
Like, comment and subscribe to help us grow!
Check out other forecasts below too!
AUDCAD SHORTS based on Daily timeframeIf we break support... waiting to see a retest before going down.

Technical Analysis Fundamentally, the Technicals do not match the activity on the charts.
Today may be a day off.
ENJOY!

Fundamental Review of CurrenciesHello all,
Good morning and thank you again for joining us and interacting
here we are breaking down the fundamental power backing and lacking in each currency.
in our next video we will go further in to the charts to see if we have any opportunities.
strong currencies are
AUD
CAD
CHF
JPY
NZD
oil
Weak currencies are
EUR
GBP
USD*

AUDCADAUDCAD is just enter into the bearish trend.
Bearish divergence also shown in RSI.
First LH is also made.
Market sentiment is also bearish.
We wait and watch for the breakout of last LL.
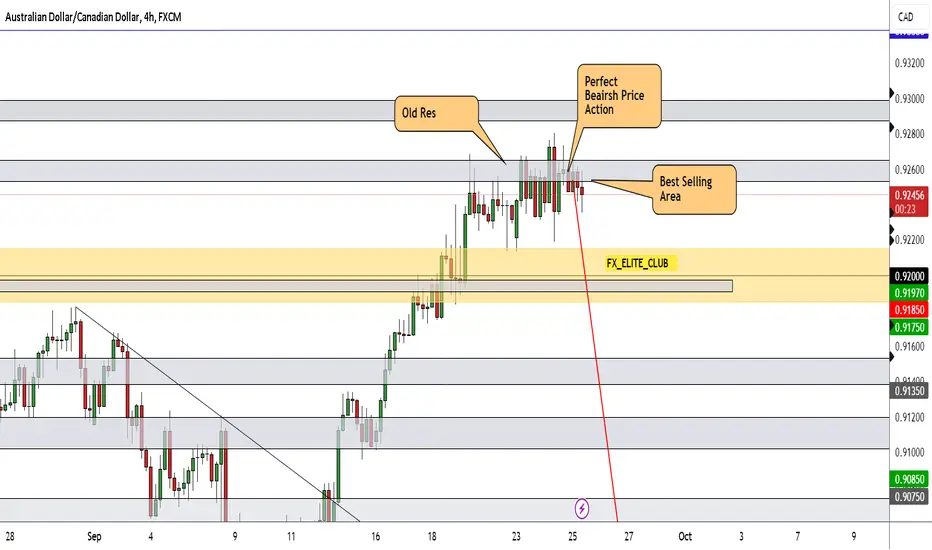
AUD/CAD Ready To Go Down Hard , Here Is The Best Place To Sell !We have a very good res area that forced the price to go down before , we also have a very good bearish Price action and also good daily closure , we can sell this pair to get 200 pips , and this idea will fail only when we have a weekly closure above our res .
This Is An Educational + Analytic Content That Will Teach Why And How To Enter A Trade
Make Sure You Watch The Price Action Closely In Each Analysis As This Is A Very Important Part Of Our Method
Disclaimer : This Analysis Can Change At Anytime Without Notice And It Is Only For The Purpose Of Assisting Traders To Make Independent Investments Decisions.

AUDCAD - In Bullish TrendAUDCAD already Breaks its Daily resitance, AUD is fundamentally more stronger then CAD.
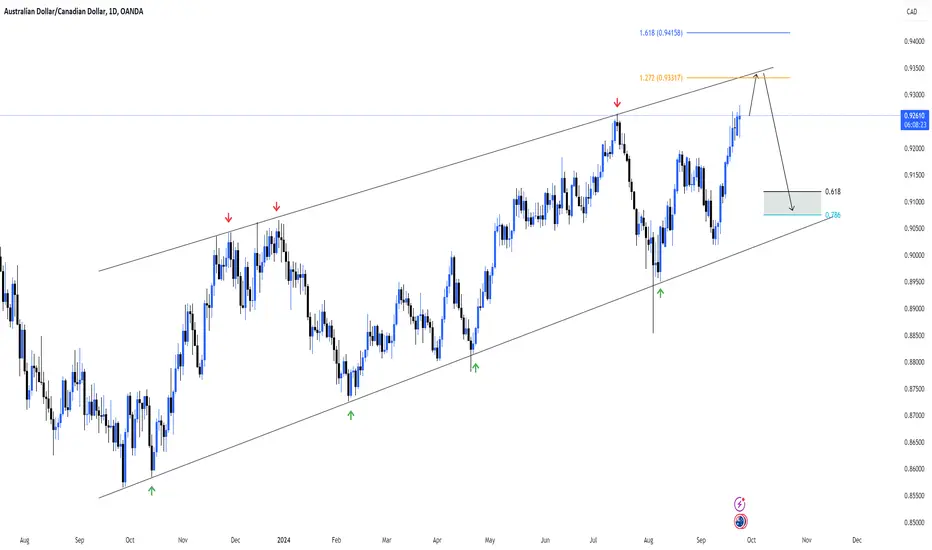
AUDCAD 1DThe price is in an ascending channel for a long time, approaching the ceiling of the channel and the Fibonacci number 1.272, there is a possibility that the price will return from these areas, in the future we will update this currency pair!
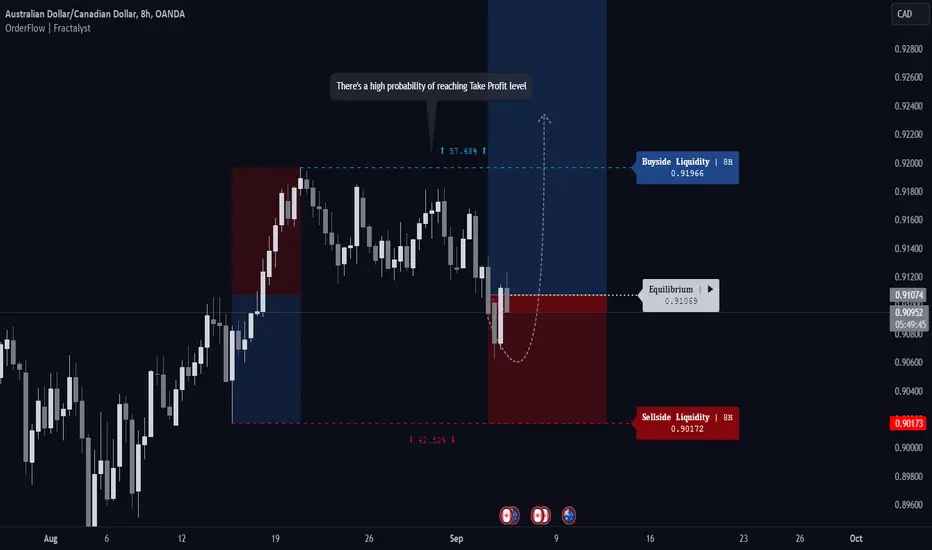
AUDCAD: Ready to Break Higher?The Australian Dollar to Canadian Dollar (AUDCAD) currency pair is currently exhibiting some interesting dynamics that align with a bullish outlook. Here are a few key fundamentals and technical observations that support a bullish bias:
1. Technical Patterns: A bullish flag pattern has been identified on the AUDCAD chart, indicating the potential for upward movement. This pattern often suggests a continuation of the existing uptrend, which aligns with a bullish perspective.
2.Oversold Conditions: The market is currently in an oversold condition as indicated by the Relative Strength Index (RSI). This suggests that the selling pressure might be exhausted, paving the way for a potential price increase. The market is expected to reach levels around 0.908, providing a strong bullish signal.
3.Demand Zone: The presence of a crucial demand zone around the 0.905 level further supports the bullish bias. This zone acts as a strong support, where buying interest is likely to increase, potentially driving the price higher.
4.Correlation with Indices: There is a noted positive correlation between stock indices and AUDCAD. Given the bullish bias on indices, AUDCAD has a tendency to rise, which strengthens the case for a bullish outlook.
In light of these factors, I plan to utilize probabilities to strategically position myself into long trades on AUDCAD.
Let's dive into the comprehensive top-down analysis together.
12M:
2W:
Hourly timeframes:
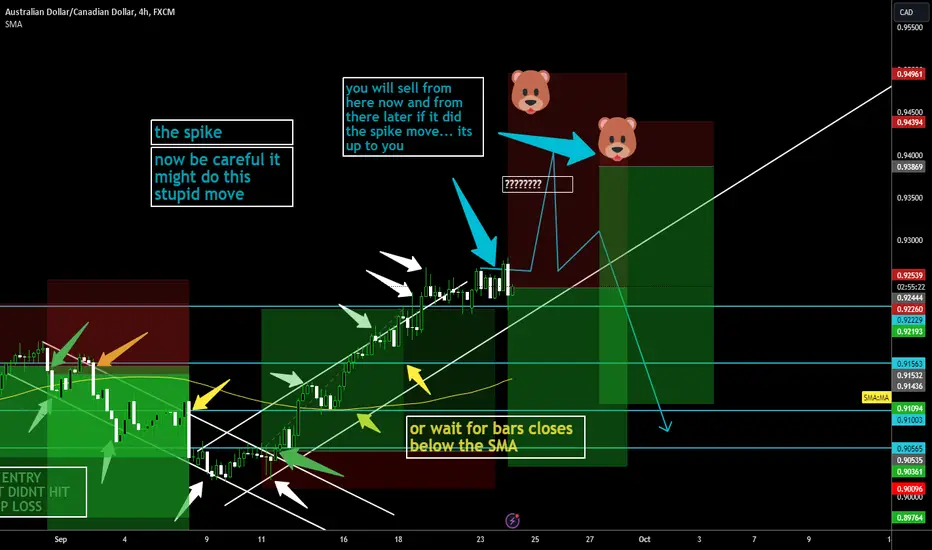
Use This Trend/Sentiment Secret To Time Entries Into MarketsAUD/CAD has rallied continually for a reason.
Tracking this reason naturally gives you better entries.

AUDCAD The SpikeEVERYTHING ON CHART
please check my pre idea so you can understand better
signals and analsys are free... and always will be
TRADE: WAITING TO SELL
DURATION: SHORT TO MEDUAM
SCALP: NO SCALPING
AUDCAD-SHORTAUDCAD is forming a double top on daily time frame also forming double top on H4 so we wil take a sell trade at the break of neck line

#AUDCAD: BULLISH NARRATIVEA drop to the Demand level with good confirmation might initiate a buy position
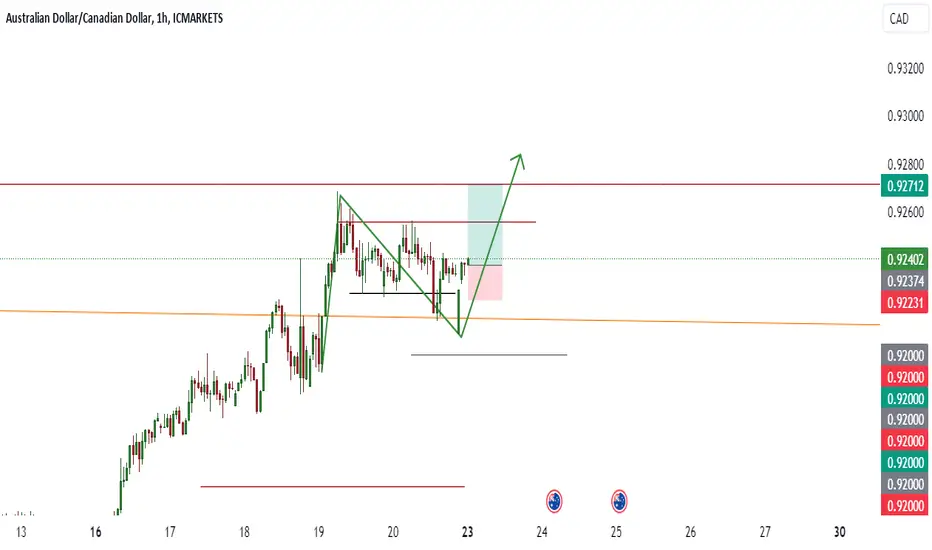
AUDCAD 2RR | 1HR TF BULLISH SETUPICMARKETS:AUDCAD seems to be on a bullish pattern on the 1 hour timeframe, it recently bounced back from the resistance which has now become support in a shorter time frame only for this trade setup, after that we will look towards shorting it, there are also high chances of monday dips at every monday so this will be a great short later as well today.
AudCad Trade IdeaAudcad is currently at a weekly resistance that was once respected before crashing back down to the daily support I have marked up. If price is gonna respect that weekly resistance I would want to to see a break and retest of the last higher low to confirm shorts for the week. If that happens I'll short the pair until price can reach daily support. We did get a daily candle closure below the weekly resistance so we'll have to see how the smaller time frames move.
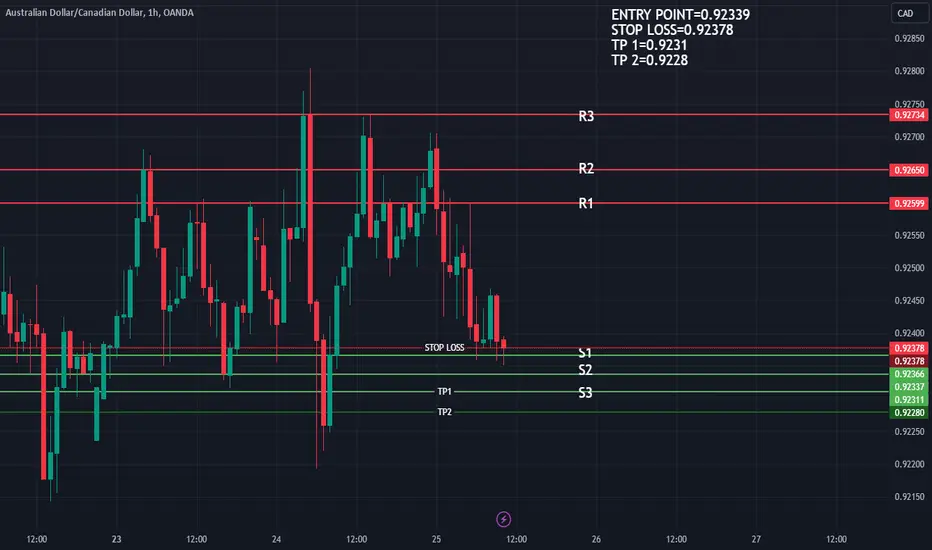
Bearish Sign On Daily Timeframe?Good Day Traders,
Its been a while since our last post. We are viewing this Aussieloonie pair today. As a confirmation, we have looked at Daily Chart. Seems the candlestick is forming like bearish pattern (HARAMI).Anyhow we can only decide after Sydney Open tomorrow. For now our view is go short if the price breaks below $0.92000 and target a minimum Risk:reward 1:2. The HTF trend is still bullish.