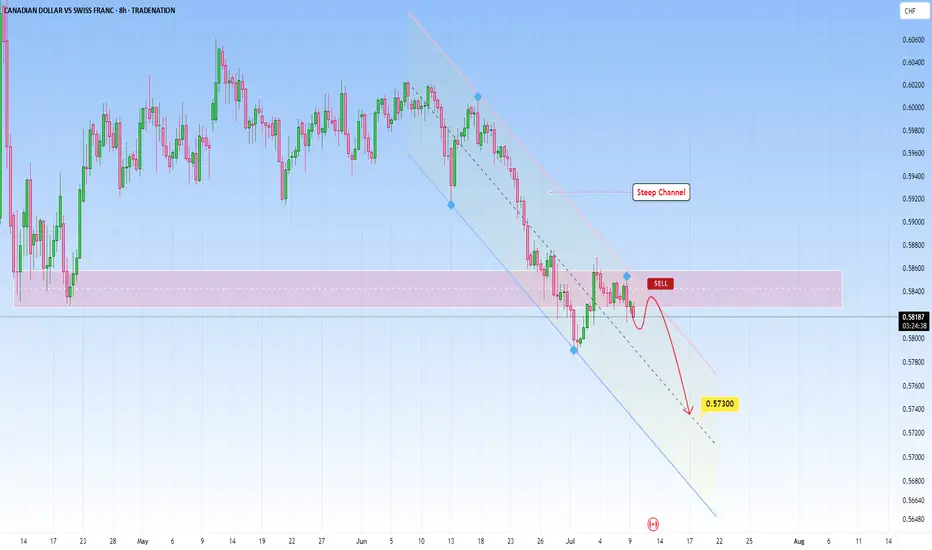
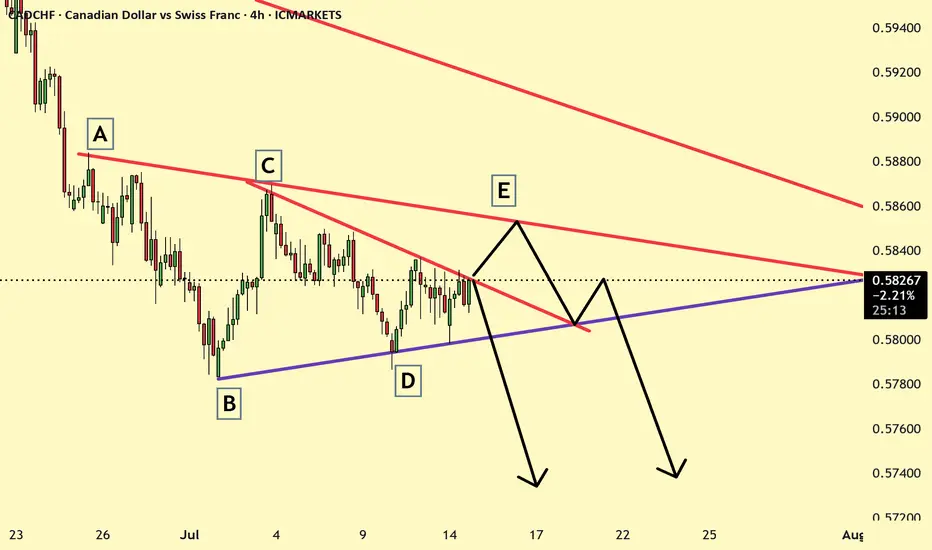
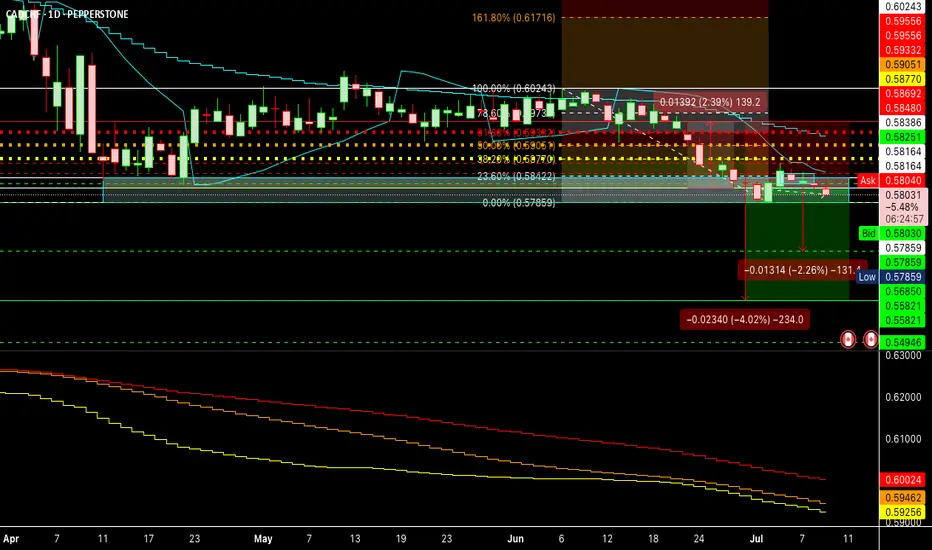
CAD/CHF: Break, Retest and Go?The market is in a strong downtrend, moving inside a visible steep channel. Price recently pulled back into a previous support-turned-resistance zone. This move appears corrective in nature, with sellers likely waiting for signs of exhaustion before re-entering in the direction of the existing trend.
Now price is reacting to the resistance zone and rejecting further upside, suggesting potential continuation lower. Ideally if price retests without closing significantly above it and forms bearish price action confirmation, it would provide a high-probability short setup: pin bars or bearish engulfing candlesticks right at retest level would help confirm the signal.
From there, continuation toward the middle of the channel becomes likely. The target projection sits near the 0.57300 level. If price fails to break lower and instead closes above the resistance zone, the setup becomes invalid and would indicate potential reversal.
In short, sellers are watching for a break and retest, aiming to ride the move down to target of near 0.57300. The downtrend would be maintained as long as price respects the current resistance and shows more signs of bearish strength.
Just sharing my thoughts for the charts, this isn’t financial advice. Always confirm your setups and manage your risk properly.
Disclosure: I am part of Trade Nation's Influencer program and receive a monthly fee for using their TradingView charts in my analysis.
CADCHF trade ideas
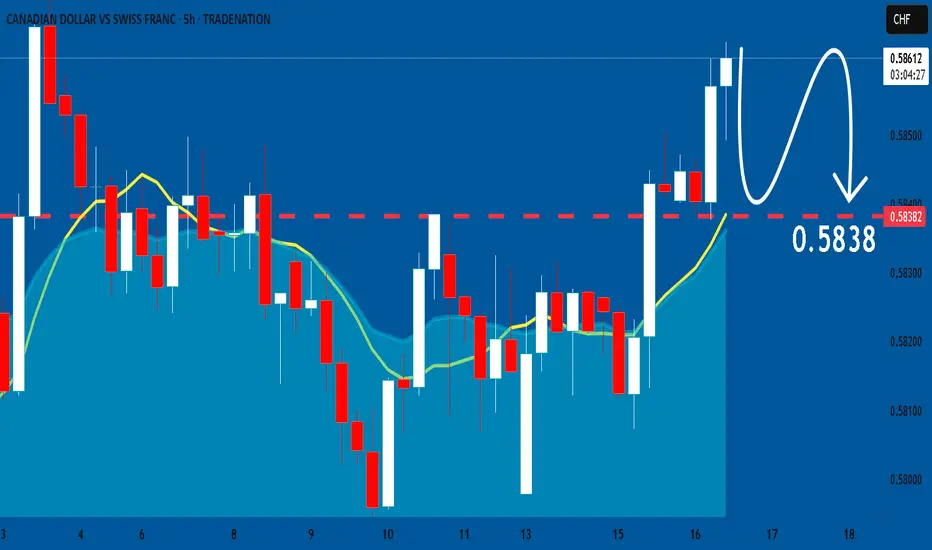
CADCHF Sellers In Panic! BUY!
My dear friends,
CADCHF looks like it will make a good move, and here are the details:
The market is trading on 0.5811 pivot level.
Bias - Bullish
Technical Indicators: Supper Trend generates a clear long signal while Pivot Point HL is currently determining the overall Bullish trend of the market.
Goal - 0.5831
About Used Indicators:
Pivot points are a great way to identify areas of support and resistance, but they work best when combined with other kinds of technical analysis
Disclosure: I am part of Trade Nation's Influencer program and receive a monthly fee for using their TradingView charts in my analysis.
———————————
WISH YOU ALL LUCK
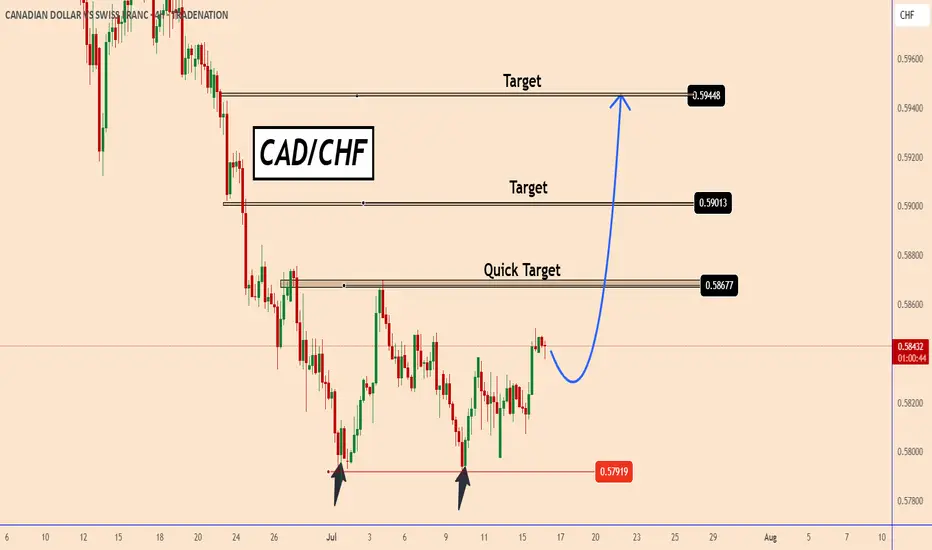
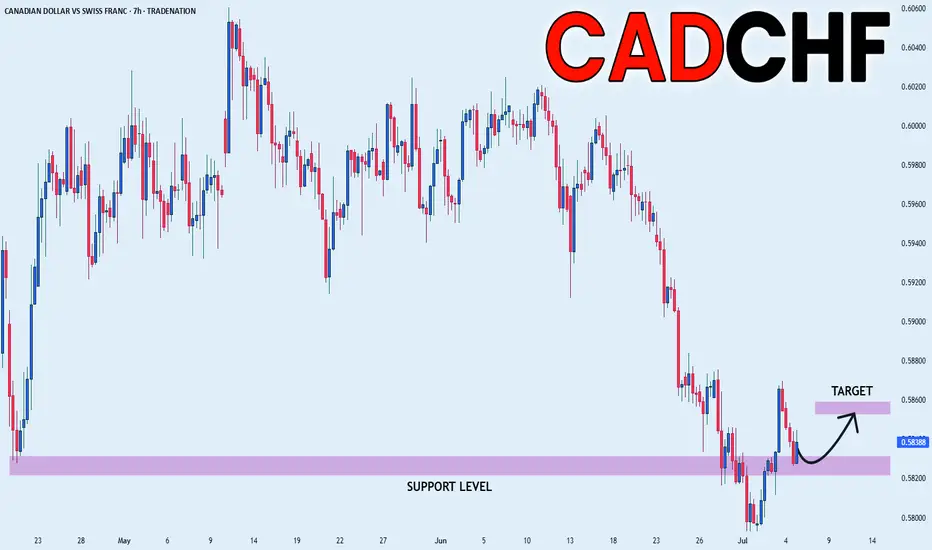
CADCHF found strong support zone near 0.5790CADCHF found a strong support zone near 0.5790
The chances are that the price already completed a doubt bottom pattern. It is not confirmed yet but the support zone is already too strong.
The price may face a strong resistance near the first target 0.5870 that is also the strongest target. Once the price moves above that zone it should rise further to the other targets near 0.5900 and 0.5945
You may find more details in the chart!
Thank you and Good Luck!
PS: Please support with a like or comment if you find this analysis useful for your trading day
Disclosure: I am part of Trade Nation's Influencer program and receive a monthly fee for using their TradingView charts in my analysis.
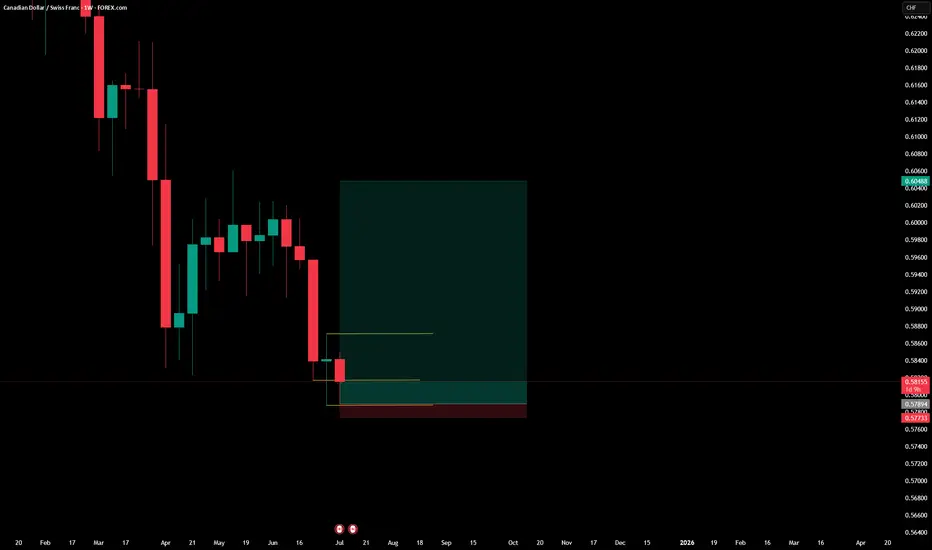
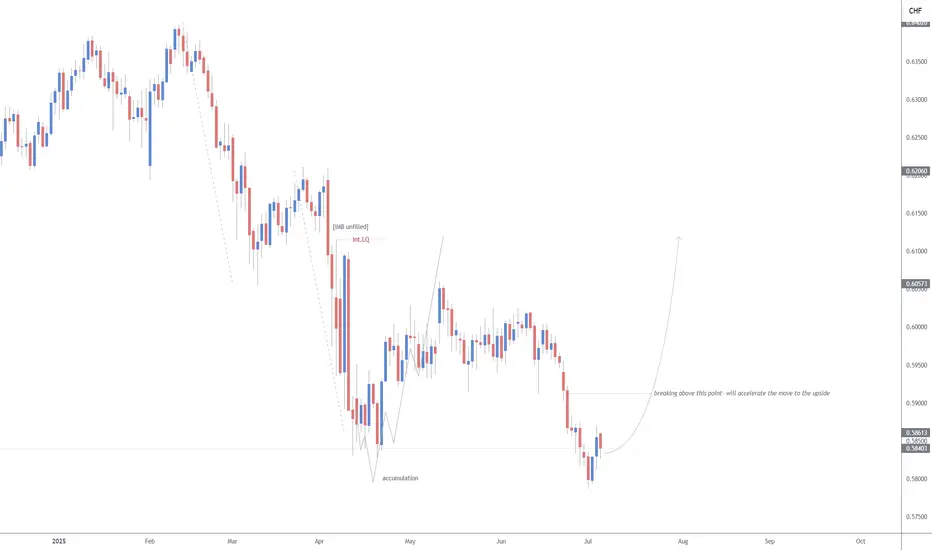
CRT on Weekly timeframe / Bullish 🎯 Trade Idea:
If you're already in: Good entry, but keep a tight stop below 0.5770.
If you're not in yet: Wait for a bullish confirmation candle (engulfing, hammer, etc.) on the daily or weekly before entering.
TP Zones:
TP1: 0.5900 (minor resistance)
TP2: 0.6040 (key structure zone)
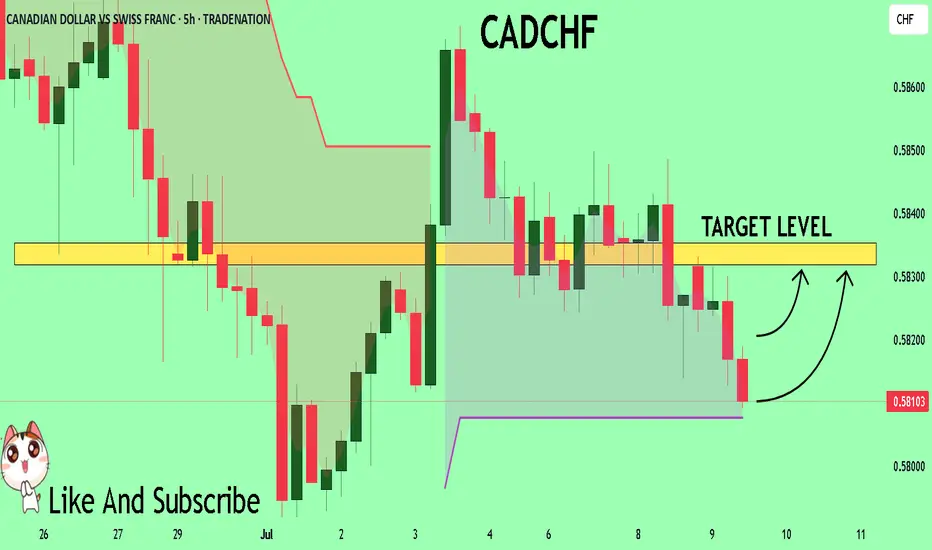
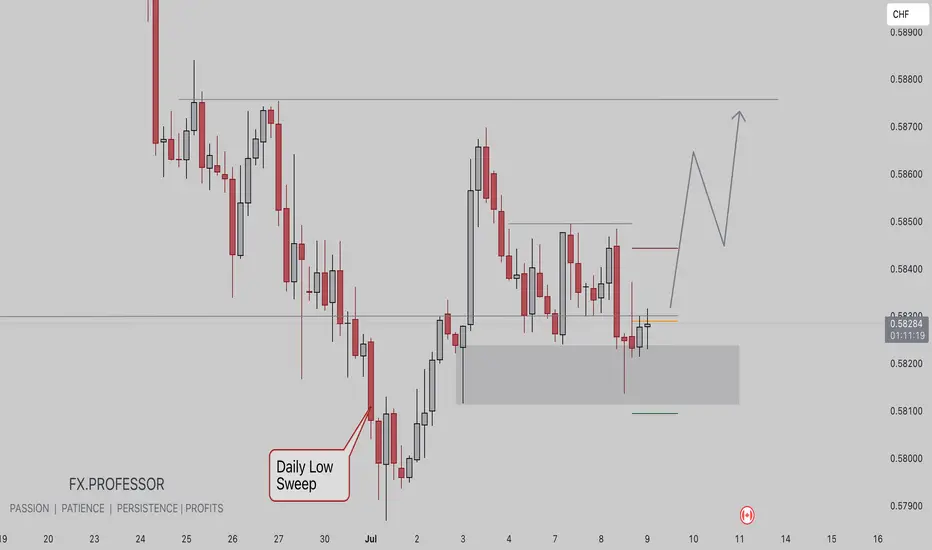
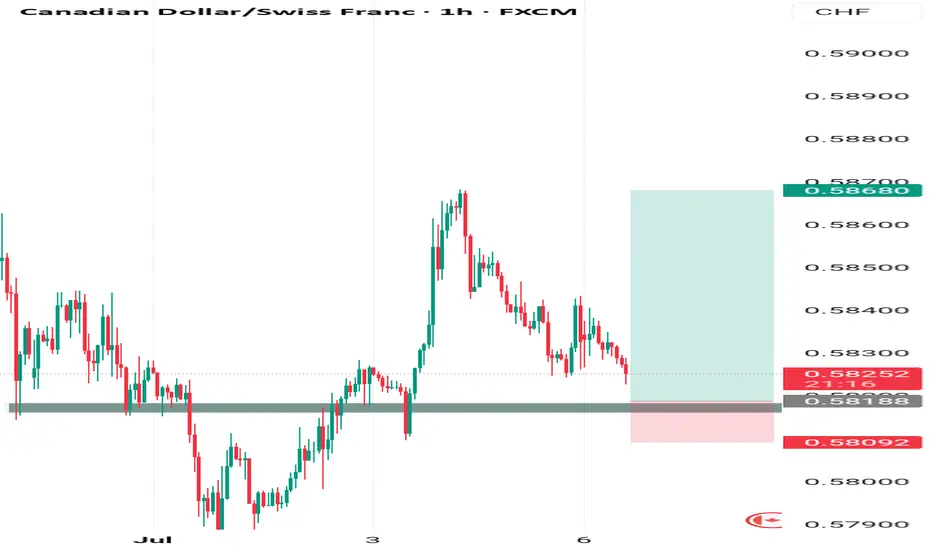
CADCHF BUY BIASConfluence 1 - “Daily Low Sweep”
• A liquidity sweep of a previous daily low occurred.
• This move typically indicates stop hunts and smart money accumulation, potentially setting up for a bullish reversal.
Confluence 2. Demand Zone (Grey Box)
• Area where price reacted after the sweep.
• Range: approximately 0.58100 – 0.58200
• Price currently respecting this zone, indicating potential bullish order block behavior.
🧠 Projected Price Path
The sketched movement indicates a plan for:
1. Break above current resistance
2. Pullback into breakout area (possibly retesting the demand)
3. Bullish continuation to 0.58470 and ultimately to 0.58800
CADCHF: Bearish Continuation
Looking at the chart of CADCHF right now we are seeing some interesting price action on the lower timeframes. Thus a local move down seems to be quite likely.
Disclosure: I am part of Trade Nation's Influencer program and receive a monthly fee for using their TradingView charts in my analysis.
❤️ Please, support our work with like & comment! ❤️
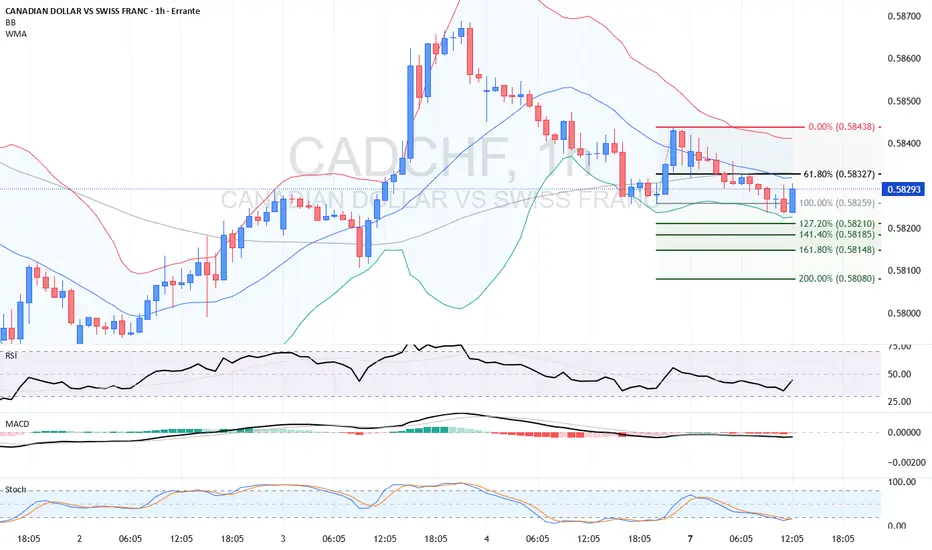
CAD/CHF Downtrend Dominates Amid Mixed Economic SignalsTechnical Analysis
The CAD/CHF pair remains firmly in a downtrend on the 1-hour chart, with price consistently making lower highs and lower lows, underscoring sustained selling pressure. The price is trading below both the 20-period and 50-period weighted moving averages, which have turned downward, signaling bearish momentum.
Price action recently tested the critical last market bottom near 0.5826, slightly dipping below before a minor rebound. This area acts as immediate support but a decisive break lower could open the way toward deeper retracements at the 127.2% (0.5821), 141.4% (0.5818), and 161.8% (0.5814) Fibonacci extensions, serving as potential targets for bears.
Overall, the technical picture favors continued bearish pressure toward the next Fibonacci support levels. However, a recovery above the 61.8% Fibonacci retracement at 0.5833 and the short-term resistance near the 20-period WMA (around 0.5837) could trigger a corrective rebound toward 0.5845.
Fundamental Outlook
Key upcoming Canadian data, including the Ivey PMI readings on July 8 and the employment report scheduled for July 11, will be pivotal in shaping CAD sentiment. The Ivey PMI is expected to reflect ongoing softness in business activity, while employment figures will be closely monitored for signs of labor market resilience or deterioration.
Swiss economic data will be more limited but important releases such as the SECO Consumer Climate index on July 11 may provide additional insight into domestic demand and sentiment, impacting CHF positioning.
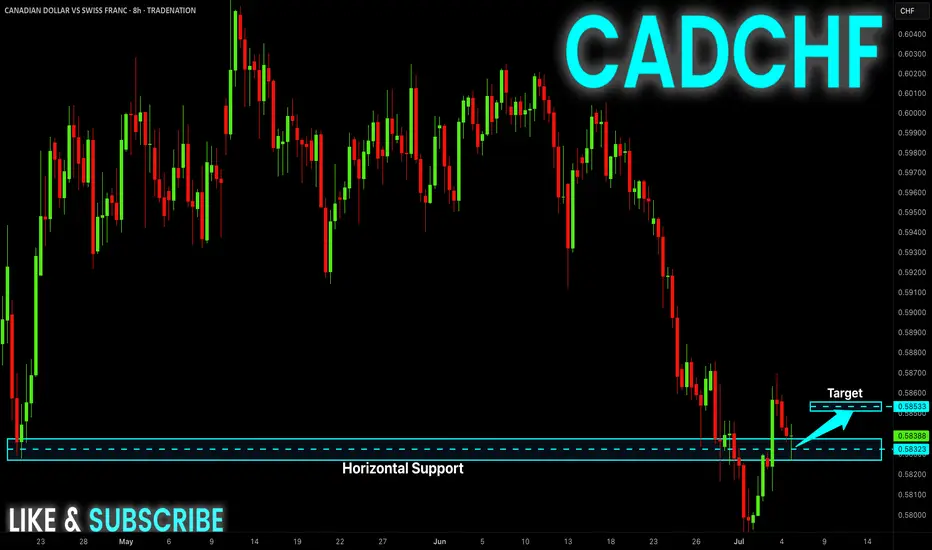
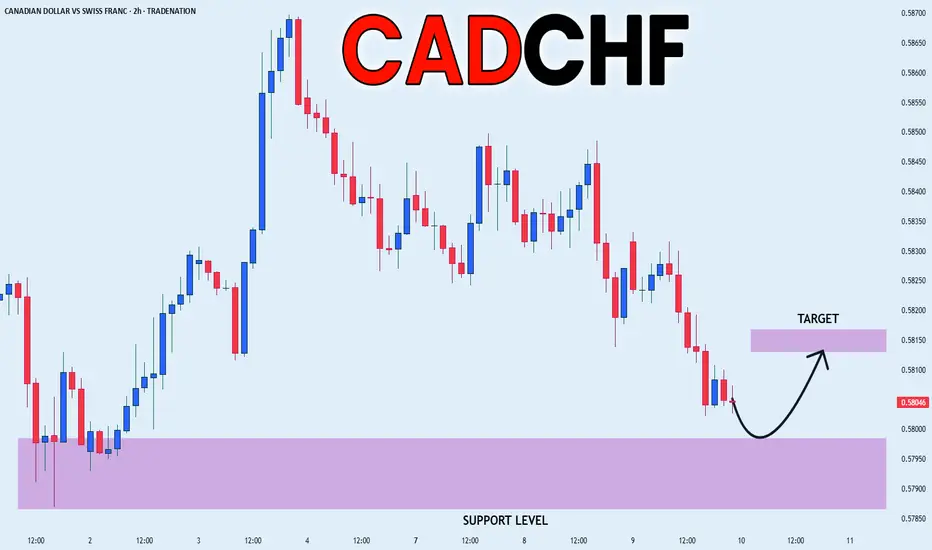
CADCHFBuy Opportunities on CADCHF
Entry: 0.58180
StopLoss: 0.58100
TakeProfit: 0.58680
Comment your opinion
For Fund Management contact me on X @shajudeakinoba1
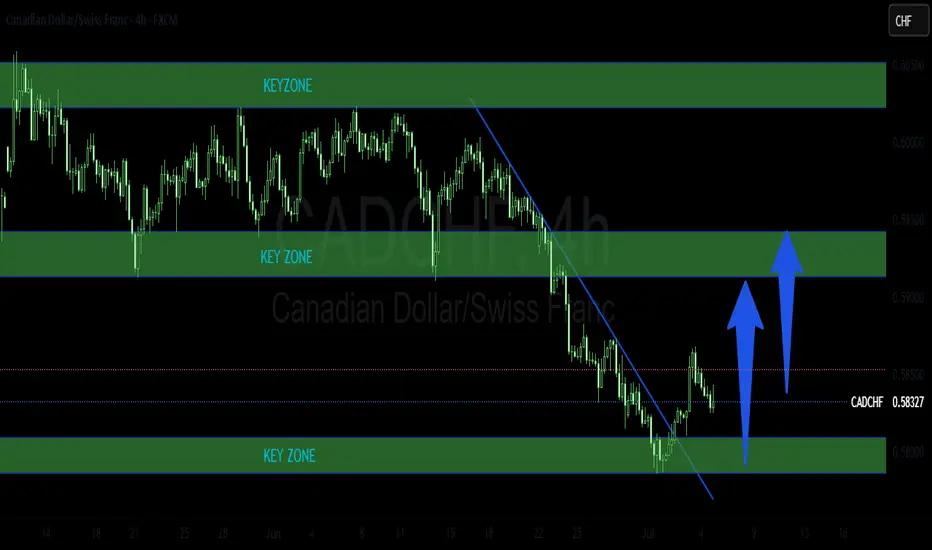
CADCHF KEY ZONES TO LOOK AT - POSSIBLE LONG The pair has been trading inside a bearish trend on H4. It recently rejected from a strong support area and broken above falling trendline. This could be an indication of a start of a new bullish movement.
Please do your own analysis before placing any trades.
Cheers and Happy Trading!!!!!
CAD_CHF GROWTH AHEAD|LONG|
✅CAD_CHF made a retest
Of the horizontal support
Of 0.5820 and we are already
Seeing a bullish reaction
So we will be expecting a
Further bullish move up
On Monday
LONG🚀
✅Like and subscribe to never miss a new idea!✅
Disclosure: I am part of Trade Nation's Influencer program and receive a monthly fee for using their TradingView charts in my analysis.
CADCHF 1D IdeaPotential for a bullish pullback on the CADCHF 1D which could lead to a price movement towards the resistance level at 0.61200. BUY levels from 0.58400
CAD-CHF Local Long! Buy!
Hello,Traders!
CAD-CHF made a retest
Of the horizontal support
Of 0.5832 so we are locally
Bullish biased and we will be
Expecting a local bullish move up
Buy!
Comment and subscribe to help us grow!
Check out other forecasts below too!
Disclosure: I am part of Trade Nation's Influencer program and receive a monthly fee for using their TradingView charts in my analysis.
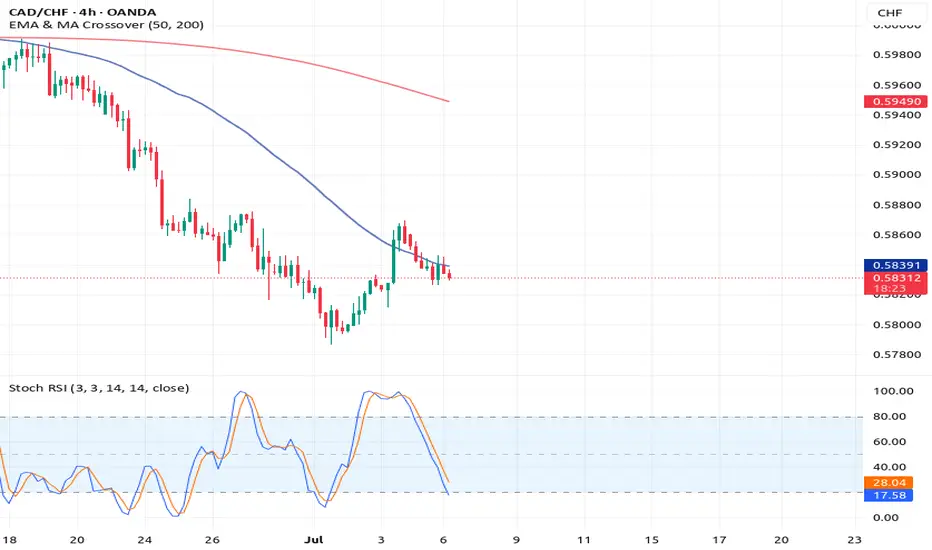
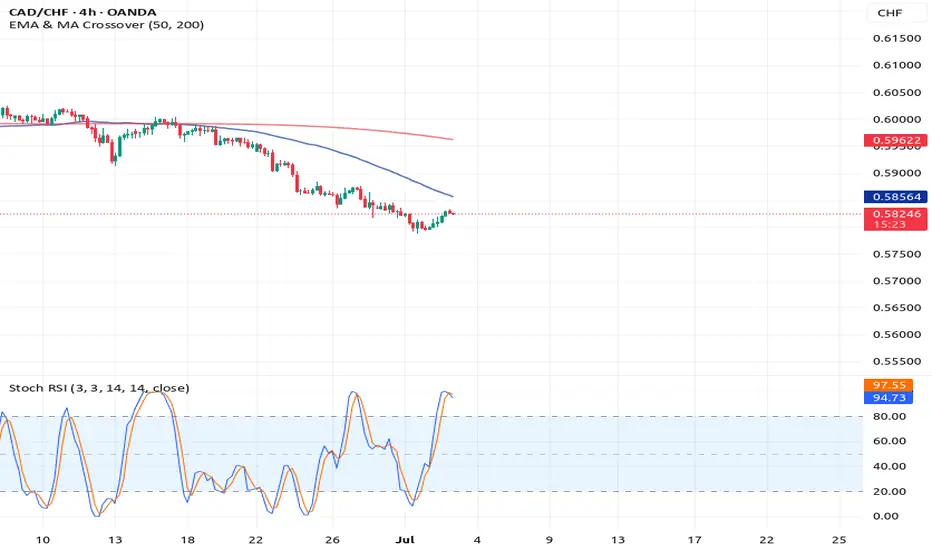
CAD/CHF 4H Reversal Setup – Stoch RSI Signals Exhaustion CAD/CHF 4H Reversal Setup – Stoch RSI Signals Exhaustion 📉📈
Pair: CAD/CHF
Timeframe: 4H
Date: July 3, 2025
---
Market Overview
The CAD/CHF pair remains in a strong downtrend. Price is trading below both the 50 EMA and 200 MA, which are sloping downward. This confirms bearish momentum. After a small bullish bounce, the pair is testing the dynamic resistance zone formed by the 50 EMA.
---
Indicator Confluence
Stochastic RSI (3,3,14) is deep in the overbought zone (above 94), suggesting bullish momentum may be fading.
Price has failed to break above the 50 EMA (0.58564), which could serve as a resistance barrier.
EMA and MA crossover shows 50 EMA remains below the 200 MA, confirming the dominant trend is bearish.
---
Trade Idea: Short Setup
Entry Zone: 0.58240 – 0.58300 (wait for bearish confirmation candle)
Stop Loss: Above 0.58600 (just beyond the 50 EMA)
Take Profit Targets:
TP1: 0.57200 (recent swing low)
TP2: 0.56000 (next support zone)
---
Strategy Logic
This is a trend-continuation reversal entry, catching the top of a pullback within a bearish structure. The Stochastic RSI overbought condition, combined with resistance at the 50 EMA and overall trend alignment, makes this setup attractive for swing or intraday short trades.
---
Risk Disclaimer
This idea is for educational purposes only. Always apply proper risk management and confirm setups with your trading plan.
---
If you found this helpful, feel free to like, comment, or share your thoughts below. Are you short on CAD/CHF too?
\#CADCHF #Forex #TradingView #StochasticRSI #BearishReversal #EMA #4HSetup #ForexEducation #TrendTrading #PriceAction
---
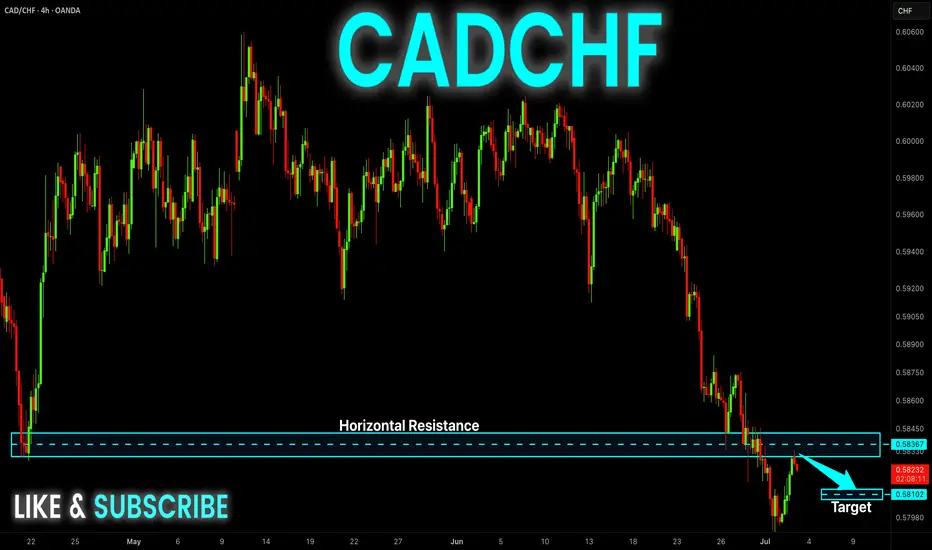
CAD-CHF Rejection From Resistance! Sell!
Hello,Traders!
CAD-CHF is trading in a
Very strong downtrend
And the recent breakout
Of the a strong key level
Of 0.5839 is confirmed
So we are bearish biased
And as the pair made a
Retest of the new resistance
We can enter a short trade
And will be expecting at
Least a local move down
In a bearish continuation
Sell!
Comment and subscribe to help us grow!
Check out other forecasts below too!
Disclosure: I am part of Trade Nation's Influencer program and receive a monthly fee for using their TradingView charts in my analysis.
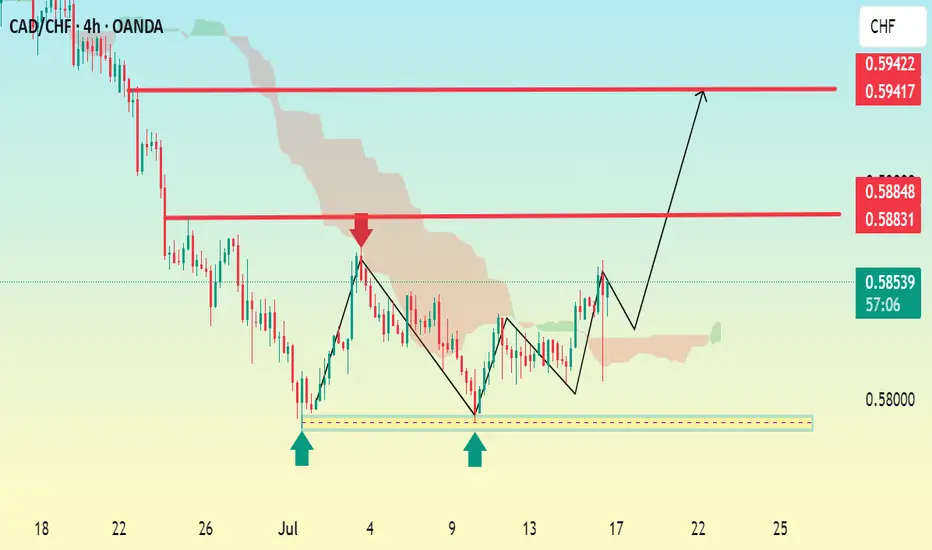
CAD/CHF 4H Bullish Reversal Setup The pair has formed a double bottom pattern around the 0.5800 level (highlighted by the blue arrows), indicating strong support and a potential bullish reversal.
Price has broken the short-term bearish trendline and is now retracing slightly, possibly to retest the breakout zone or neckline of the double bottom.
Ichimoku Cloud is thinning, suggesting weakening bearish momentum and potential for a bullish breakout.
Key Resistance Levels:
First Target (TP1): 0.5884
Second Target (TP2): 0.5942
Current Price: 0.5852
A successful retest and bounce from the neckline area (around 0.5830–0.5840) could lead to a move toward the mentioned targets.
Conclusion:
As long as the 0.5800 support holds, CAD/CHF shows a bullish reversal potential toward 0.5884 and 0.…
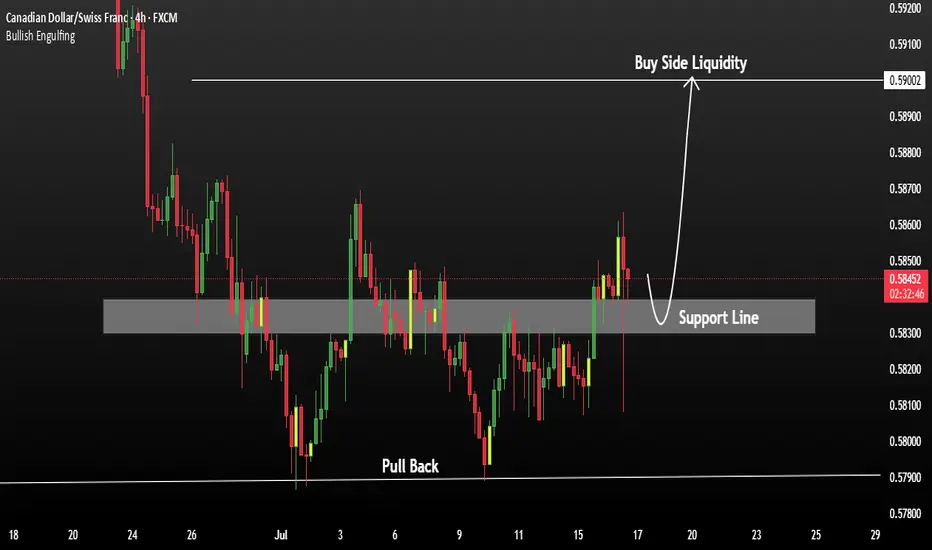
CADCHF Buying Opportunity after Strong Support CADCHF is currently respecting a strong support zone, indicating a potential bullish reversal pattern in development. The structure suggests that most of the downward pressure may be exhausted, and buyers could begin to take control.
Price action shows signs of completing a doubt/uncertainty pattern, reinforcing the base formed at support. A strong resistance level lies near 0.59002. If the 4H candle closes above this level, it may confirm a breakout and open the door for further bullish momentum.
You May find more details in the chart.
Trade wisely best of Luck Buddies.
PS: Support with like and comments for better analysis.
CADCHF Squeeze Between OB and Trendline – Big Move Coming?CADCHF is compressing within a descending triangle structure, showing signs of bullish intent as it continues to reject a key demand + 1H order block area.
🔹 Trade Idea:
I’m watching for a bullish breakout above 0.58380, which will also confirm a trendline breakout from the descending triangle. Until then, I remain on the sidelines.
🔹 Key Technical Factors:
- Price consolidating inside a descending triangle, squeezing between lower highs and a consistent demand zone
- Repeated rejections from the green demand zone suggest buyers are defending the level strongly
- A clean order block (1H) is aligned with the bottom of this structure, adding confluence for a bullish move
- Above 0.58380 breakout may trigger momentum toward 0.58630, near the supply zone
🔹 Trade Plan:
+ Buy above: 0.58380 (on breakout + close above trendline)
+ First Target: 0.58630 (next resistance/supply area)
* Invalid if: price breaks and holds below the demand zone
⚠️ Note: Entry is only valid on confirmed breakout. Until then, patience and watchfulness around structure edges are key.

CADCHF possible Bearish Scenario The CADCHf is bearish mode and recently forming a symmetrical triangle like pattern and Within this also forming another sub triangle. let us see how it behaves to these trendlines.
CADCHF is BullishPrice was in a strong downtrend, however a double bottom reversal pattern hints the control of bulls. If previous lower high is broken with god volume then we can expect a strong bullish reversal as per Dow theory. Targets are mentioned on the chart.

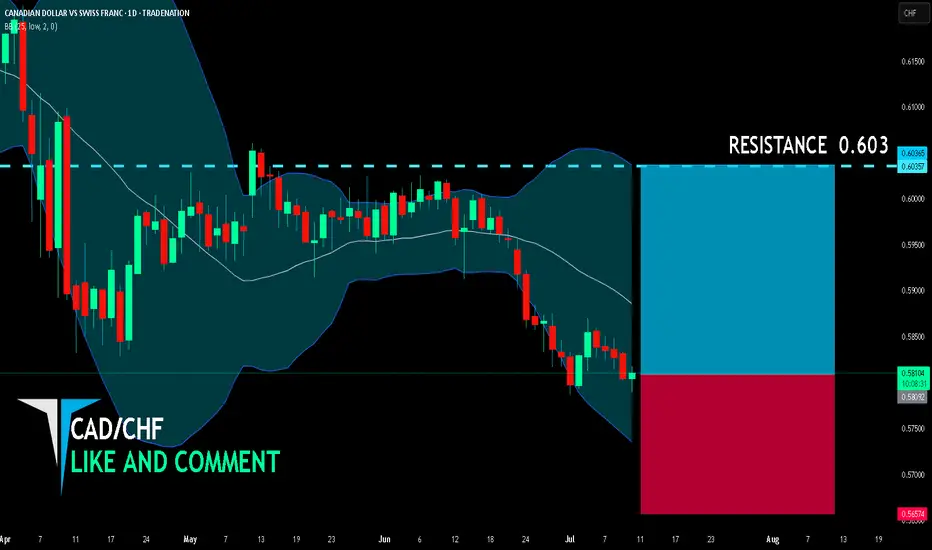
CAD/CHF BULLS ARE GAINING STRENGTH|LONG
CAD/CHF SIGNAL
Trade Direction: long
Entry Level: 0.580
Target Level: 0.603
Stop Loss: 0.565
RISK PROFILE
Risk level: medium
Suggested risk: 1%
Timeframe: 1D
Disclosure: I am part of Trade Nation's Influencer program and receive a monthly fee for using their TradingView charts in my analysis.
✅LIKE AND COMMENT MY IDEAS✅
CAD_CHF STRONG SUPPORT|LONG|
✅CAD_CHF has been falling recently
And the pair seems locally oversold
So as the pair is approaching a
Horizontal support of 0.5790
Price growth is to be expected
LONG🚀
✅Like and subscribe to never miss a new idea!✅
Disclosure: I am part of Trade Nation's Influencer program and receive a monthly fee for using their TradingView charts in my analysis.
CADCHF: Waiting for the Right MomentDespite the recent minor pullback, I’m still watching closely and waiting for a stronger bearish move. What’s your take on this pair? Feel free to share your thoughts!
CADCHF 4H Rocket Booster Strategy – Bearish Setup with EMA CADCHF 4H Rocket Boost Strategy – Bearish Setup with EMA Breakdown, Impulsive Sell Candles, MACD Momentum Shift, and Stoch RSI Signal
The CADCHF currency pair is setting up for a potential downside move on the 4-hour chart, following the Rocket Boost Strategy
framework for bearish trades. With price trading below key moving averages, momentum indicators confirming weakness,
and aggressive selling pressure evident, this setup may offer a clean sell opportunity for trend-following traders.
1. Price Below the 50 EMA
CADCHF is currently trading below the 50-period Exponential Moving Average (EMA), indicating that short-term momentum has
shifted in favor of sellers. The 50 EMA is no longer acting as support but now serves as resistance. This shift often marks the start of a downtrend.
2. Price Below the 200 EMA
Long-term trend bias has turned bearish, with price also below the 200 EMA. The 50 EMA has crossed below the 200 EMA,
forming a bearish stack—this adds weight to the idea that the market structure has flipped in favor of continued downside.
3. Breakout Candles / Bearish Impulse Moves
Recent candles show strong bearish momentum—long-bodied red candles with shallow upper wicks, suggesting aggressive
selling and minimal buyer defense. This behavior mimics a "gap-down" effect in forex terms, indicating institutional selling or
heavy supply pressure.
4. MACD Bearish Crossover Confirmation
The MACD line has crossed below the signal line, and the histogram is growing more negative with each candle close. This
is a key sign that momentum is accelerating to the downside. MACD crossovers below the zero line, especially during bearish
EMA alignment, often mark the start of significant downtrends.
5. Stochastic RSI Confirms Reversal Sell Signal
The Stochastic RSI recently reversed from overbought levels and crossed downward. This suggests a momentum reversal at a
local top, lining up perfectly with the broader bearish context. When used in conjunction with other trend signals, it helps
traders time their entries with greater precision.
What This Means for CADCHF Traders
This Rocket Boost bearish setup is showing full alignment: price under both major EMAs, downside confirmation from MACD,
strong bearish candles, and a Stoch RSI reversal. Traders watching this pair should be alert for continuation signals such as lower
highs, retests of broken support levels, or breakdowns through psychological price zones.
Targets could include previous swing lows, Fibonacci retracement levels, or key support zones on the daily chart.
To learn more about this kind of setup, search for Rocket Booster Strategy content.
Disclaimer: This article is for educational purposes only and does not constitute financial advice. Always do your own analysis and use proper risk management.
Use a simulation trading account before you trade with real money