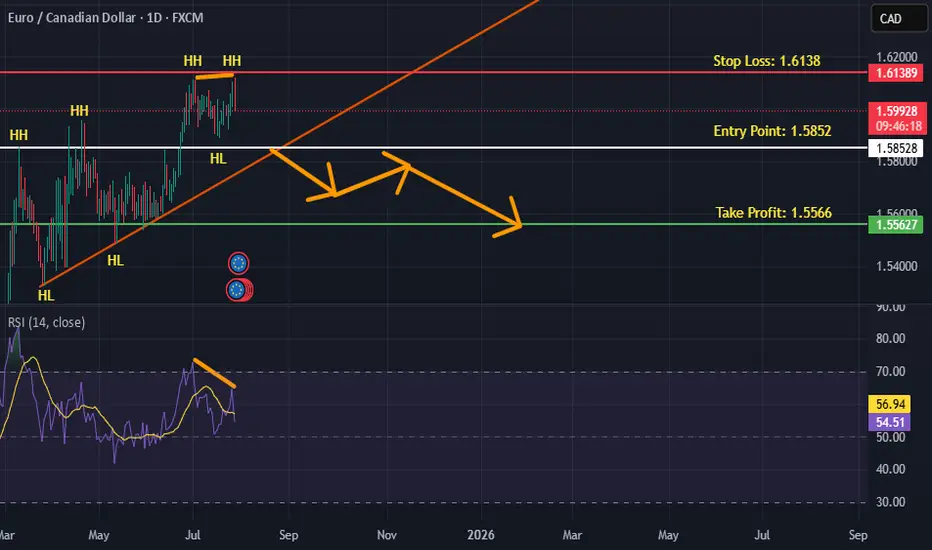
EURCAD is BearishPrice was in a strong uptrend, however now it seems that bulls are exhausted, the notion is further validated by a double top reversal pattern with bearish divergence. If previous higher low is broken with good volume, then we can expect a bearish reversal as per Dow theory. Targets are mentioned on the chart.
CADEUR trade ideas
EURCAD The Target Is DOWN! SELL!
My dear subscribers,
EURCAD looks like it will make a good move, and here are the details:
The market is trading on 1.6089 pivot level.
Bias - Bearish
My Stop Loss - 1.6104
Technical Indicators: Both Super Trend & Pivot HL indicate a highly probable Bearish continuation.
Target - 1.6061
About Used Indicators:
The average true range (ATR) plays an important role in 'Supertrend' as the indicator uses ATR to calculate its value. The ATR indicator signals the degree of price volatility.
Disclosure: I am part of Trade Nation's Influencer program and receive a monthly fee for using their TradingView charts in my analysis.
———————————
WISH YOU ALL LUCK

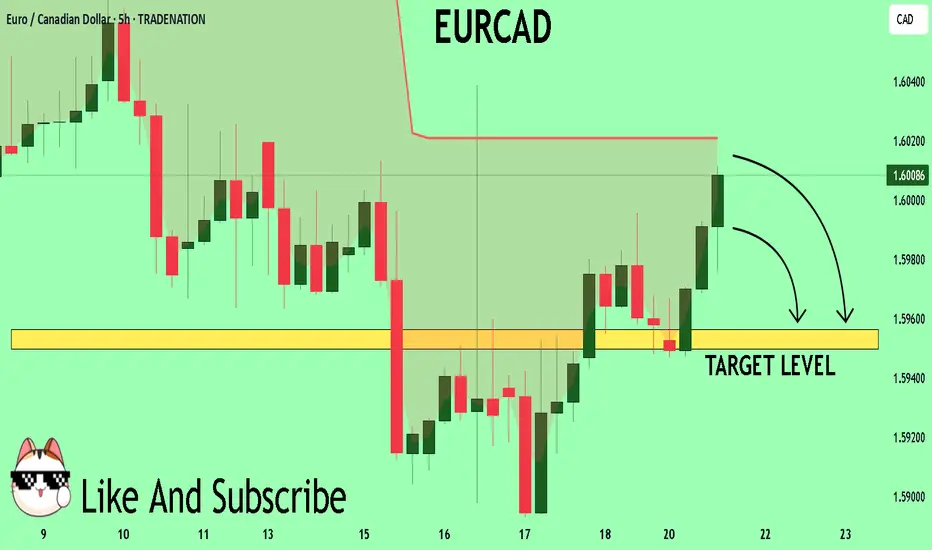
EURCAD Buyers In Panic! SELL!
My dear friends,
My technical analysis for EURCAD is below:
The market is trading on 1.6005 pivot level.
Bias - Bearish
Technical Indicators: Both Super Trend & Pivot HL indicate a highly probable Bearish continuation.
Target - 1.5956
About Used Indicators:
A pivot point is a technical analysis indicator, or calculations, used to determine the overall trend of the market over different time frames.
Disclosure: I am part of Trade Nation's Influencer program and receive a monthly fee for using their TradingView charts in my analysis.
———————————
WISH YOU ALL LUCK
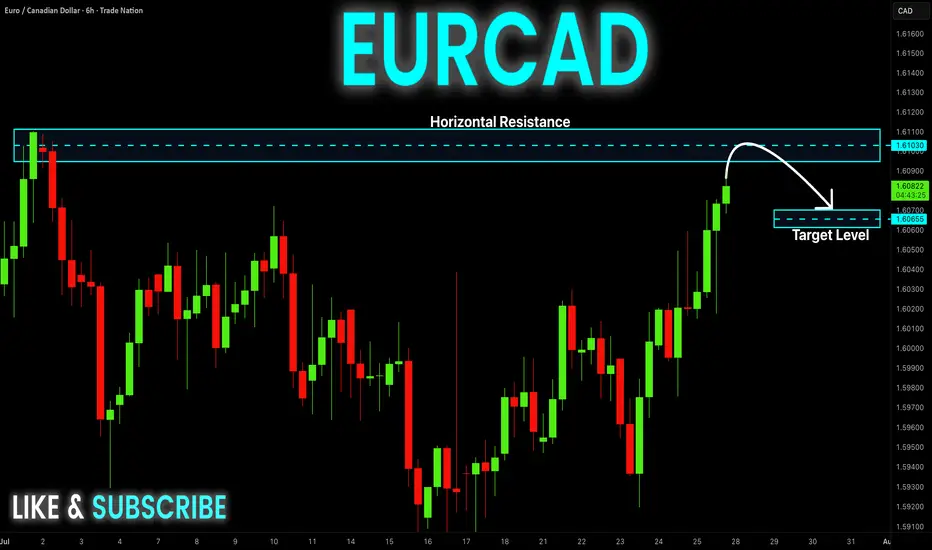
EUR-CAD Risky Short! Sell!
Hello,Traders!
EUR-CAD is trading in a
Strong uptrend so we are
Bullish biased long-term
However a strong horizontal
Resistance is ahead at 1.6110
And the pair is overbought
So after the retest of the
Resistance we will be
Expecting a bearish correction
Sell!
Comment and subscribe to help us grow!
Check out other forecasts below too!
Disclosure: I am part of Trade Nation's Influencer program and receive a monthly fee for using their TradingView charts in my analysis.
EURCAD Wave Analysis – 24 July 2025- EURCAD reversed from support zone
- Likely to rise to resistance level 1.6100
EURCAD currency pair earlier reversed up from the support zone between the key support level 1.5950 (former monthly high from April), 20-day moving average and the 38.2% Fibonacci correction of the upward impulse from May.
The upward reversal from this support zone started the active minor impulse wave iii – which belongs to the intermediate impulse wave (3) from the end of 2024.
Given the overriding daily uptrend, EURCAD currency pair can be expected to rise to the next resistance level 1.6100 (which stopped the previous impulse wave i in June).

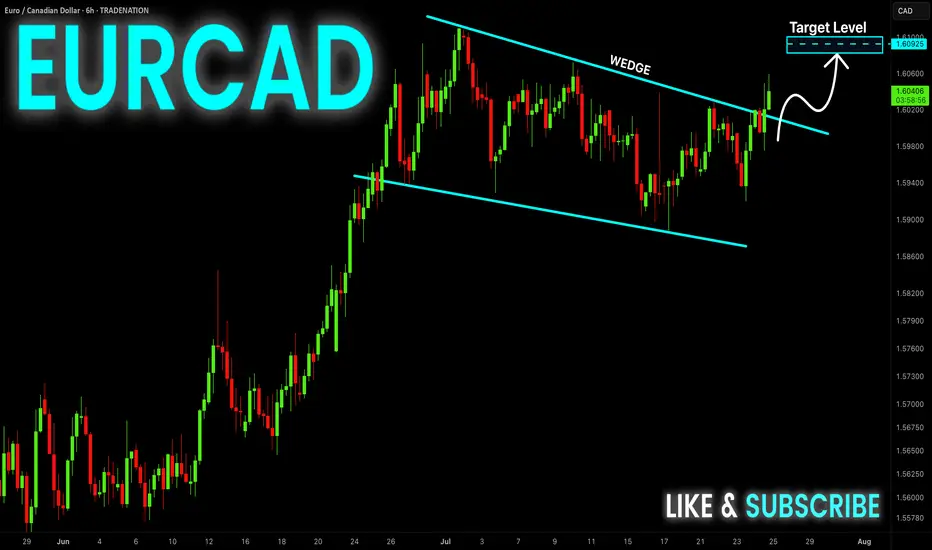
EUR-CAD Bullish Wedge! Buy!
Hello,Traders!
EUR-CAD is trading in an
Uptrend and the pair formed
A bullish wedge pattern and
Now we are seeing a bullish
Breakout from the wedge so
We are bullish biased and we
Will be expecting a further
Bullish move up
Buy!
Comment and subscribe to help us grow!
Check out other forecasts below too!
Disclosure: I am part of Trade Nation's Influencer program and receive a monthly fee for using their TradingView charts in my analysis.
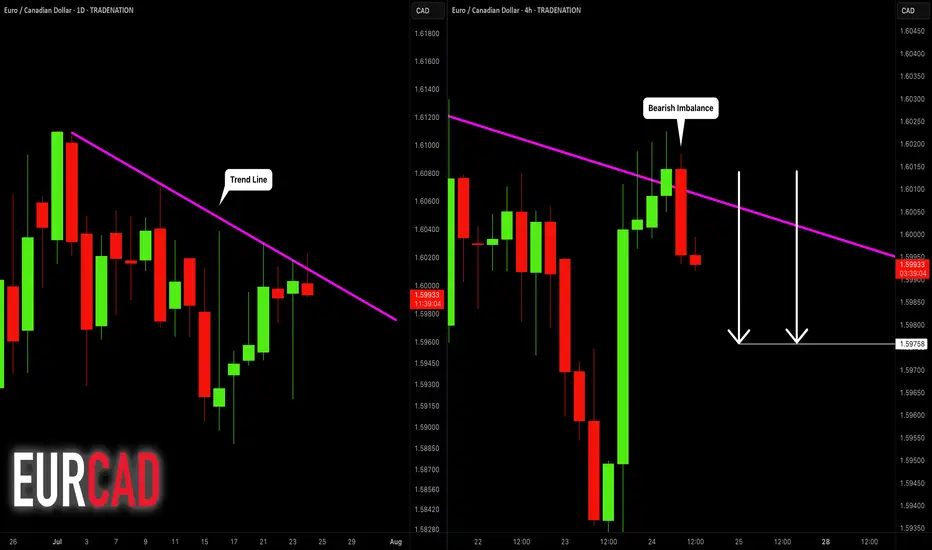
EURCAD: Expecting Bearish Continuation! Here is Why
Balance of buyers and sellers on the EURCAD pair, that is best felt when all the timeframes are analyzed properly is shifting in favor of the sellers, therefore is it only natural that we go short on the pair.
Disclosure: I am part of Trade Nation's Influencer program and receive a monthly fee for using their TradingView charts in my analysis.
❤️ Please, support our work with like & comment! ❤️
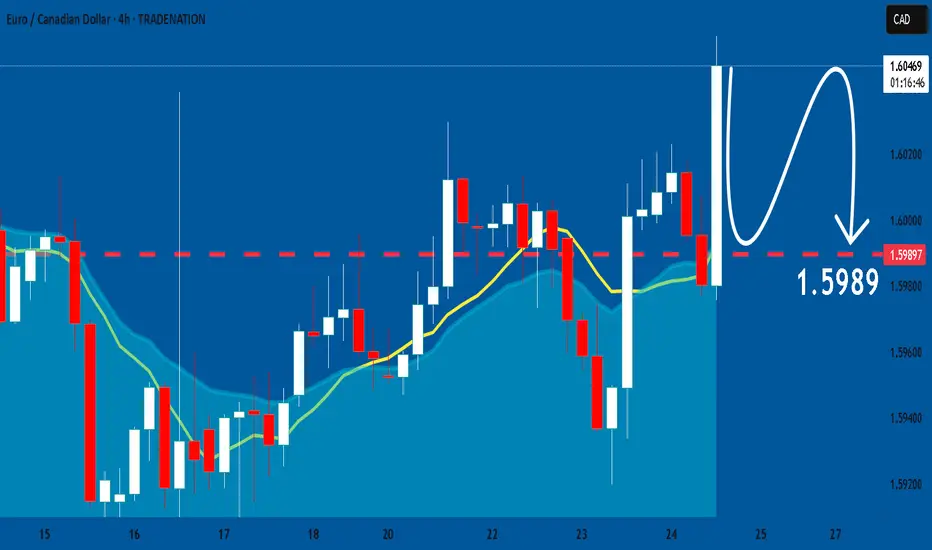
EURCAD: Bearish After the News 🇪🇺🇨🇦
EURCAD may drop from a solid daily resistance.
As a confirmation signal, I spotted a bearish engulfing candle
on a 4H time frame after its test.
The formation of this candle is accompanied by multiple negative
German fundamentals.
Goal - 1.5976
❤️Please, support my work with like, thank you!❤️
I am part of Trade Nation's Influencer program and receive a monthly fee for using their TradingView charts in my analysis.
EURCAD Long TradeOANDA:EURCAD
Long trade, with my back testing of this strategy, it hits multiple possible take profits, manage your position accordingly.
TP-1: 1.59517
TP-2: 1.59726
This is good trade, don't overload your risk like greedy, be disciplined trader, this is good trade.
Use proper risk management
Looks like good trade.
Lets monitor.
Use proper risk management.
Disclaimer: only idea, not advice
Could the price bounce from here?EUR/CAD has bounced off the pivot which is a pullback support, and could rise to the 1st resistanc,e which is a multi-swing high.
Pivot: 1.58922
1st Support: 1.57671
1st Resistance: 1.61066
Risk Warning:
Trading Forex and CFDs carries a high level of risk to your capital and you should only trade with money you can afford to lose. Trading Forex and CFDs may not be suitable for all investors, so please ensure that you fully understand the risks involved and seek independent advice if necessary.
Disclaimer:
The above opinions given constitute general market commentary, and do not constitute the opinion or advice of IC Markets or any form of personal or investment advice.
Any opinions, news, research, analyses, prices, other information, or links to third-party sites contained on this website are provided on an "as-is" basis, are intended only to be informative, is not an advice nor a recommendation, nor research, or a record of our trading prices, or an offer of, or solicitation for a transaction in any financial instrument and thus should not be treated as such. The information provided does not involve any specific investment objectives, financial situation and needs of any specific person who may receive it. Please be aware, that past performance is not a reliable indicator of future performance and/or results. Past Performance or Forward-looking scenarios based upon the reasonable beliefs of the third-party provider are not a guarantee of future performance. Actual results may differ materially from those anticipated in forward-looking or past performance statements. IC Markets makes no representation or warranty and assumes no liability as to the accuracy or completeness of the information provided, nor any loss arising from any investment based on a recommendation, forecast or any information supplied by any third-party.

EURCAD Buyers In Panic! SELL!
My dear subscribers,
This is my opinion on the EURCAD next move:
The instrument tests an important psychological level 1.5952
Bias - Bearish
Technical Indicators: Supper Trend gives a precise Bearish signal, while Pivot Point HL predicts price changes and potential reversals in the market.
Target - 1.5888
About Used Indicators:
On the subsequent day, trading above the pivot point is thought to indicate ongoing bullish sentiment, while trading below the pivot point indicates bearish sentiment.
Disclosure: I am part of Trade Nation's Influencer program and receive a monthly fee for using their TradingView charts in my analysis.
———————————
WISH YOU ALL LUCK

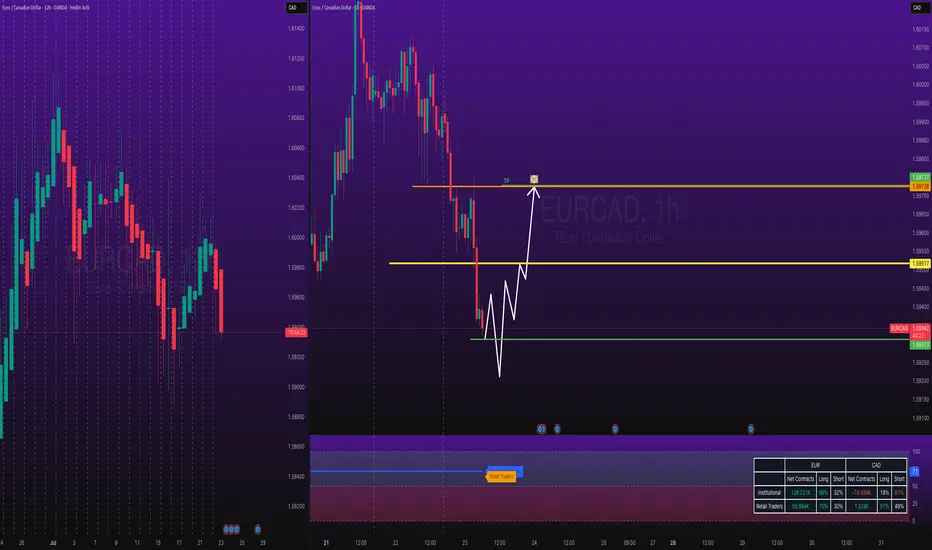
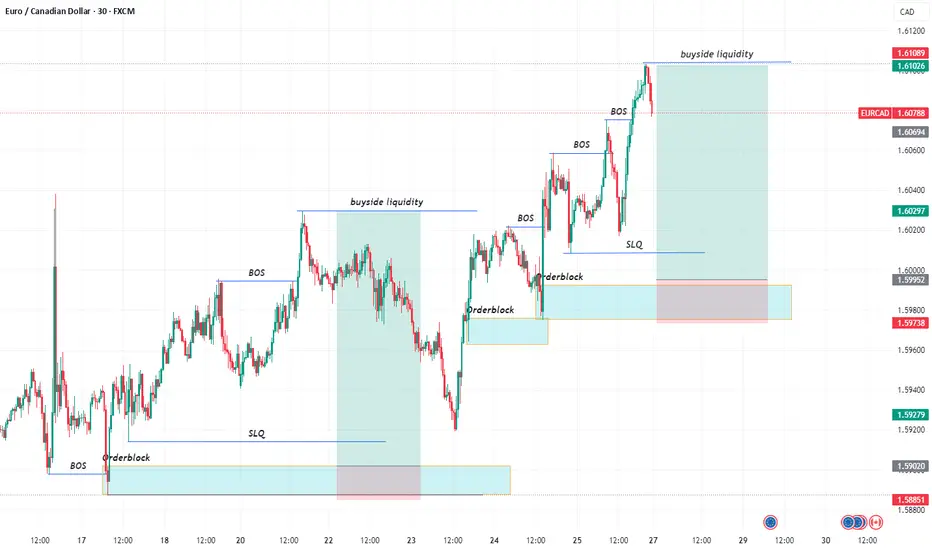
EURCAD SWING: SHORT-TERM SHORT OPPORTUNITYHi there,
Been a while... I was motivated resume sharing my trade ideas by a follower turned Pal (Shloydo). I say this to say - I'd be sharing my thoughts on price more often.
After running equal highs on the monthly chart, price created a MSS and I'd like to see a short-term bearish movement in price.
Once price trades into the highlighted key level (which aligns with the quarterly open price), I'd be looking for a setup to go short.
You could add this to the pairs on your radar.
Cheers,
Jabari

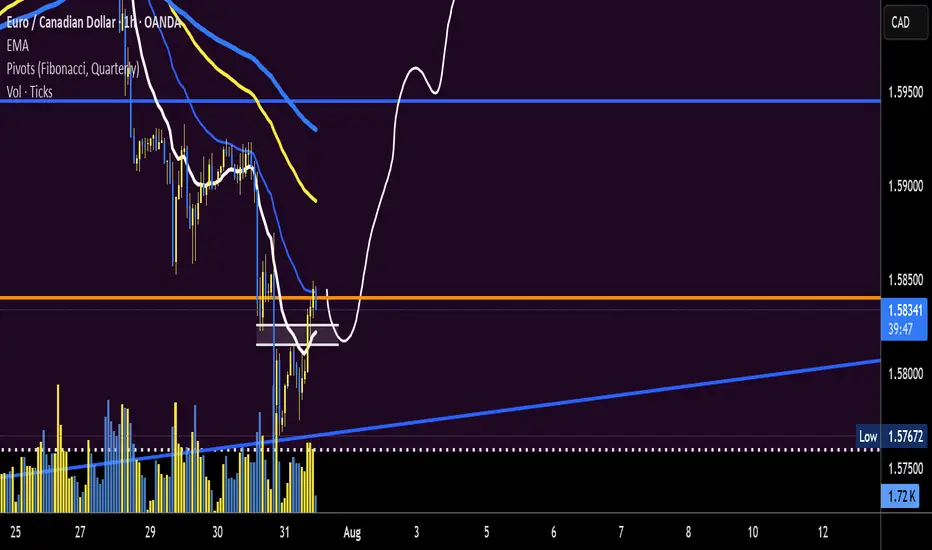
EURCAD | Eyes on the 50EMA — One Bold Candle and I’m All In💌 Still in Love with the Trend — Just Waiting for My Candle to Say “Yes”
1-hour chart has already whispered sweet nothings — a clean buy range has formed, and we’ve just dipped into a lovely little retracement. But guess what?
All my signals say the pullback is over — and it’s almost time to get back on this romantic ride! 😍
💘 WHAT TO DO NOW
✨Entry : I’m waiting for one bold Marubozu candle to confidently close above my 50EMA — no hesitation. Once that happens, I’m jumping in like it’s the last dance of the night. 💃🕺
🛡️Stop Loss:
If the candle is strong and healthy — like a partner I can trust — I’ll place my SL just below it.
If not, I’ll let it go… there’s always another setup waiting with love. ❤️
TP: 1.5985
❓WHAT IF PRICE REFUSES TO COMMIT?
No worries — this is a day trading love story.
While I keep an eye on the 15m chart flirting with the 50EMA, I’ll also glance at the 1-hour to make sure the romantic spark (a.k.a. bullish range) is still alive.
As long as the 1H trend is holding strong, this setup is still valid. 💍
Wish me luck… and may the markets fall in love with me today! 📈💕

EUR/CAD a potential leg up formingEUR/CAD trend line seems to be holding. look for a entry signal up after pull back. 14 ema and 34 ema may offer resistance on 15 min chart. monitor volume decrease on pull back and spike for upward force and continuation
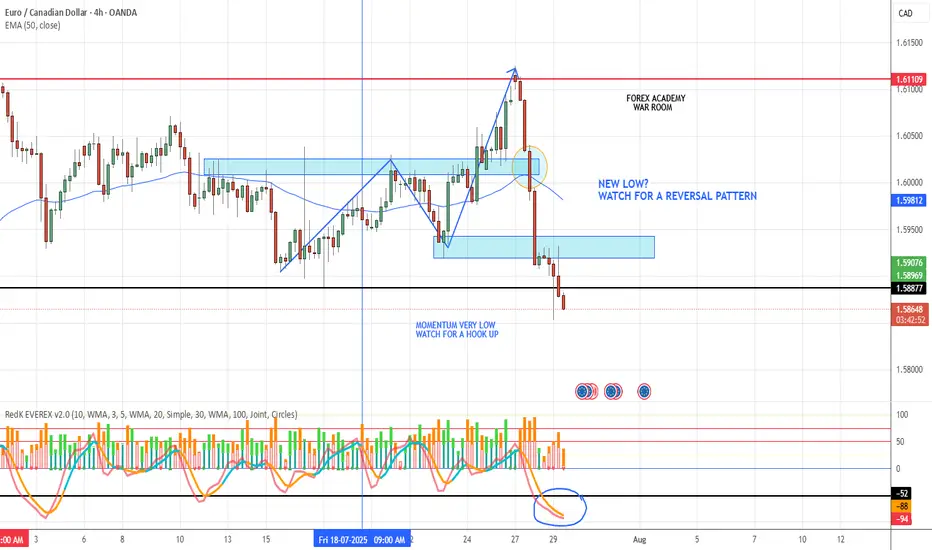
EUR/CAD ADDED TO WATCHLISTLike the other Euro markets this one is falling hard, we are watching for a possible reversal pattern to show up. Momentum is very low so we could see a rubber band effect here. Keep watching.

Daily outlook 7-28-25Daily outlook 7-28-25 - in this outlook i will tel my friend what i am gonna trade for today.

EURCAD LONG SETUP H4: 28 JULY - 1 AUGUST 2025✅ EUR/CAD Trade Plan (4H Timeframe)
🔍 Bias: Bullish
🧠 Why Buy EUR/CAD?
Reason Details
📊 COT Data
Institutions are 66.9% long EUR and 80.19% short CAD
👥 Retail Sentiment
87% of retail traders are short (contrarian signal = bullish)
📈 Technical Setup
Breakout + retest of descending trendline and resistance = bullish continuation setup
🔍 Technical Analysis Summary
✅ Trend & Price Action
The pair broke out of a descending trendline, indicating a shift from a short-term downtrend to a potential uptrend.
📊 Key Levels
1. Resistance / Take Profit (TP) Target Zone:
Around 1.61500 – 1.62000
Marked in red as the TP TARGET, this is a supply zone.
The market may face selling pressure at this point.
2. Current Price Levels:
Price is trading around 1.6088, slightly below the local resistance at 1.6108.
3. Support / Buy Zone:
Between 1.60701 – 1.60884
This zone has previously acted as resistance and may now serve as support, aligning with the breakout retest.
4. Lower Support Levels:
1.59218 and 1.58883 are marked as potential deeper support if the breakout fails.
📈 Indicators and Patterns
Trendline Breakout: The descending black trendline has been broken, suggesting bullish momentum.
Pivot Levels (R1, R2, S1, etc.) are overlaid, providing additional confirmation of key support/resistance zones.
---
📌 Trading Plan (as per the chart)
Bullish Bias: The breakout and retest imply a long entry from the BUY ZONE (1.607 – 1.6088).
TP Target: Around 1.615 – 1.620
Invalidation Level: A break below 1.6070, or especially below 1.5921, may invalidate the setup and turn bias bearish.
📊 COT Data Analysis
EUR (Euro):
Long Positions: 66.9%
Short Positions: 33.1%
Δ Weekly: -1.11% (net longs reduced slightly)
🔎 Interpretation:
Institutions are still heavily long on the Euro, showing confidence in its strength.
However, there's a slight weekly decrease, possibly a bit of profit-taking or caution ahead of upcoming data.
---
CAD (Canadian Dollar):
Long Positions: 19.81%
Short Positions: 80.19%
Δ Weekly: +1.22% (shorts increased further)
🔎 Interpretation:
Institutions are extremely bearish on the Canadian Dollar.
The increase in short positions shows growing conviction that CAD will weaken.
🧮 Institutional Bias:
Bullish on EUR/CAD: Institutions are net long EUR and net short CAD, meaning they expect EUR/CAD to rise.
---
👥 Retail Sentiment (EUR/CAD):
Long: 13%
Short: 87%
🔎 Interpretation:
Retail traders are massively short on EUR/CAD.
This is a contrarian signal: retail traders are often on the wrong side of the market.
Smart money likely sees upside if retail is heavily short.
📌 Conclusion
All signals — COT, retail sentiment, and technical structure — point toward a bullish EUR/CAD outlook.
Institutions are buying EUR and shorting CAD, while retail traders are mostly short, potentially fueling a short squeeze if price rallies. Technically, the breakout and retest also support a bullish trade idea.

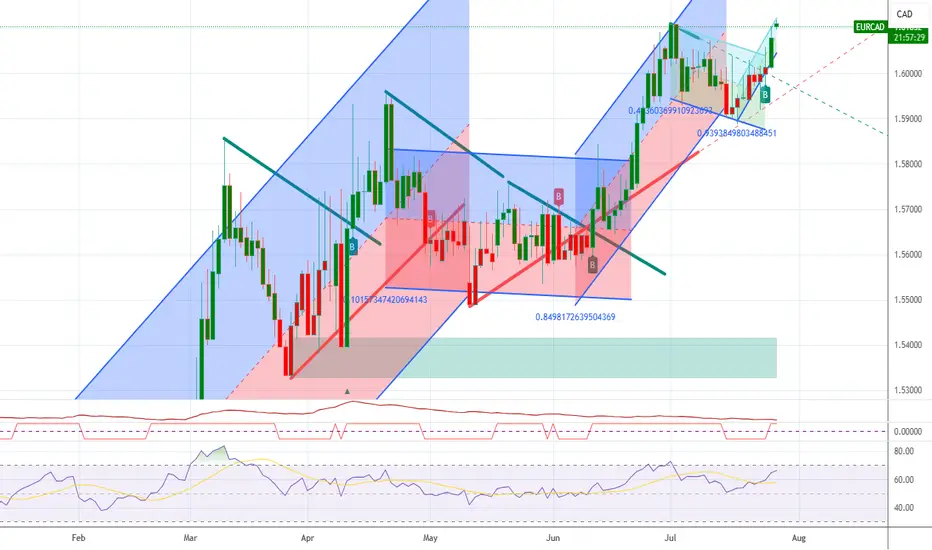
EURCAD--LONG--27_07_25--multi-timerfame bullish sentiment(Monthly,Weekly,Daily)
--TP1 is around 1.615, TP2 is upper side of ascending channel

EURCAD BUYS!Both entries still very much valid, we are bullish on the daily , first entry pushes to the upside to take out liquidity , then we target the imbalance in the market at the bottom, which then pushes the market to break our last daily high.
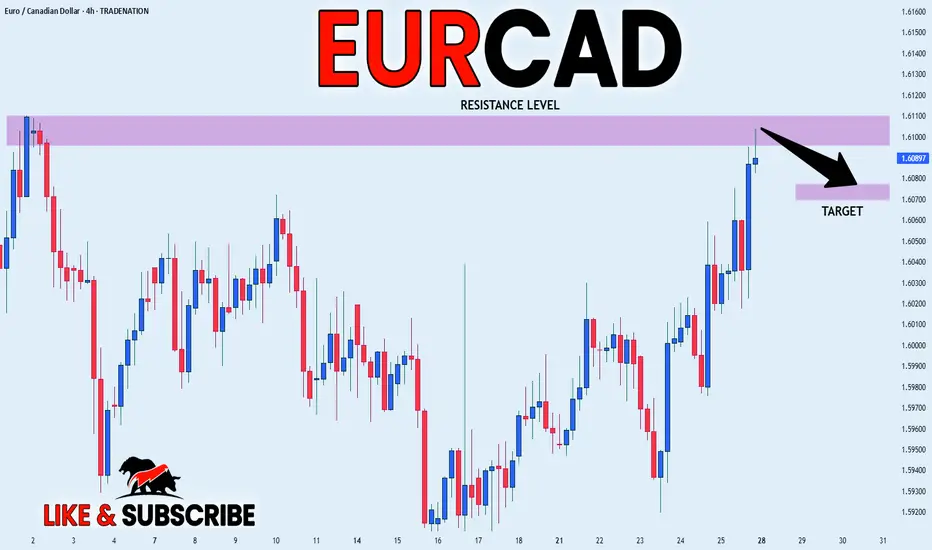
EUR_CAD LOCAL SHORT|
✅EUR_CAD is going up to retest
A horizontal resistance of 1.6110
Which makes me locally bearish biased
And I think that we will see a pullback
And a move down from the level
Towards the target below at 1.6077
SHORT🔥
✅Like and subscribe to never miss a new idea!✅
Disclosure: I am part of Trade Nation's Influencer program and receive a monthly fee for using their TradingView charts in my analysis.
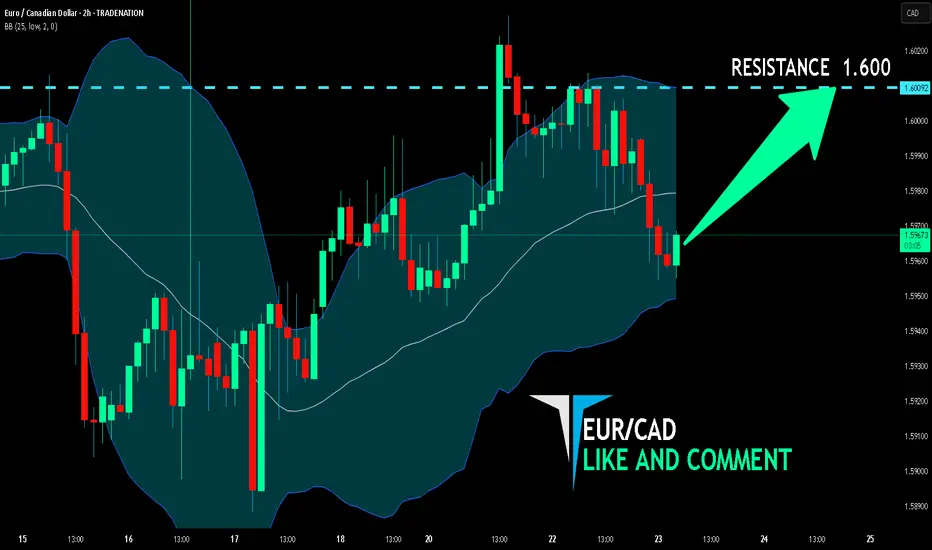
EUR/CAD BULLISH BIAS RIGHT NOW| LONG
Hello, Friends!
Previous week’s red candle means that for us the EUR/CAD pair is in the downtrend. And the current movement leg was also down but the support line will be hit soon and lower BB band proximity will signal an oversold condition so we will go for a counter-trend long trade with the target being at 1.600.
Disclosure: I am part of Trade Nation's Influencer program and receive a monthly fee for using their TradingView charts in my analysis.
✅LIKE AND COMMENT MY IDEAS✅