EURCAD (SMC BASED)TRADE SETUP EXPLANATION (SMC BASED):
PAIR: EURCAD
TIMEFRAME: 2H Chart (Entry Confirmation on 15M / 5M)
SETUP LOGIC (SMC STRATEGY):
BOS (Break of Structure) Confirmed — market is in bullish structure.
Price is retracing towards:
IMB (Imbalance zone)
POI 1H (Point of Interest - Demand Zone)
Liquidity (LIQ-$$$$) Sweep Expected Before Reaction.
TRIGGER CONDITION FOR ENTRY:
✅ After price enters the POI 1H Demand Zone, wait for:
→ CHoCH (Change of Character) confirmation on 15 min or 5 min timeframe.
→ CHoCH indicates buyers taking control after sweep and mitigation.
ENTRY PLAN:
🔹 Enter BUY trade after 15M / 5M CHoCH.
🔹 Stop Loss (SL) below POI zone.
🔹 Target previous high marked near 1.60296.
RISK-REWARD:
🎯 Aim for minimum 1:3 RR as visible on the chart.
KEY NOTES:
No entry directly at POI.
Entry only after confirmation (CHoCH) in lower timeframe.
Trade respects Smart Money Concepts (SMC) rules of BOS, Liquidity sweep, and POI reaction.
CADEUR trade ideas

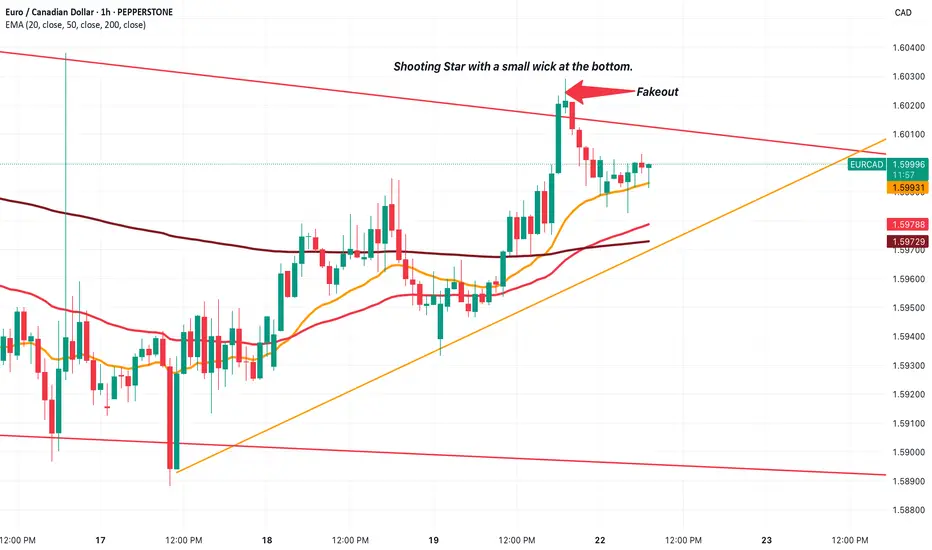
EUR/CAD make a fakeout and will soon decide its next trend.EURCAD recently made a faekout at the marked candle.
The candlestick pattern we can see is a Shooting Star. Yes, it does have a small wick at the bottom, but more or less looks like a Shooting Star.
After that, it fell right back into the channel. It's good to see that the channel is being respected.
Now, there's two possibilities that we're looking at for a trade.
Firstly, if we look at the Top Red trendline and the Green Trendline, we can see that there is a triangle formation. The price will decide if it wants to stay in the channel or not depending on how it reacts at the end of that triangle.
Next thing we look at is (assuming price respects the channel and continues down) that the price will start respect the big channel (Top Red trendline and Bottom Red Trendline) as it has been doing for a while now...
It's time to wait now and understand where price is going. In both possibilities, we have a trade which can be taken, but we must ensure that we have our rules and confluences in check before taking the trade.
Trade idea for EURCADThe sell-side liquidity at 1.58972 was purged, and now we target the buy-side liquidity at 1.60384. The potential entry zone is from CMP at 1.60016 with a stop loss at 1.59922. The 5-minute entry was taken based on the CISD strategy. Note the 1.59973 level; if this level is swept and not run through, then we can add more positions and maintain the same stop loss for larger rewards.

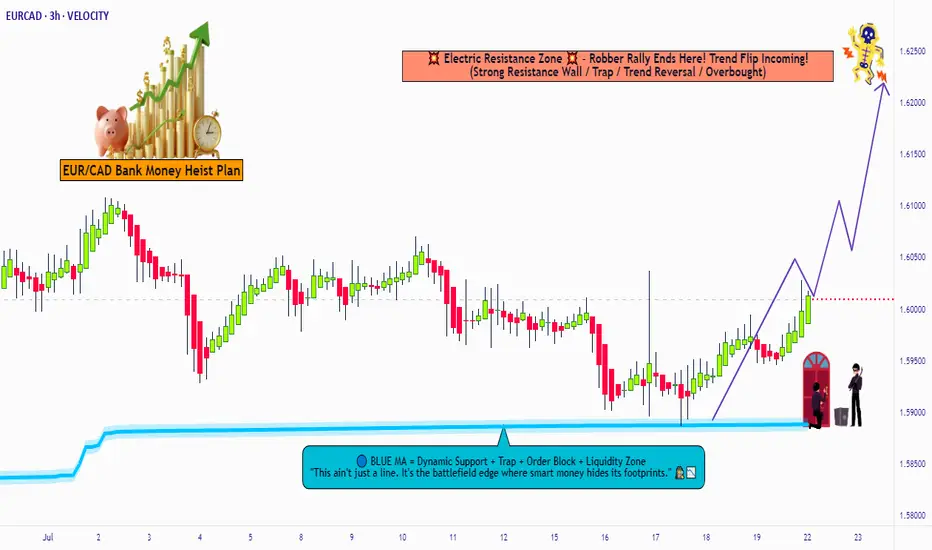
"EUR/CAD Price Pirate Mode: Long Entries Loading!"🔥🚨 "EUR/CAD BANK HEIST: The Ultimate Bullish Loot Grab! (Thief Trading Style) 🚨🔥
🌟 Greetings, Market Pirates & Profit Raiders! 🌟
(Hola! Oi! Bonjour! Hallo! Marhaba!)
The EUR/CAD "Euro vs Loonie" vault is WIDE OPEN—time to execute the Thief Trading Heist Plan! 🏦💰 Based on 🔥 high-probability technicals & stealthy fundamental analysis 🔥, here’s how we SWIPE THE LOOT before the bears catch on!
🎯 TRADE SETUP (Scalping/Day Heist)
📈 Entry (Bullish Raid):
"The vault door is cracked—enter anywhere!"
Pro Thief Move: Use buy limit orders near swing lows (15M/30M) for sneaky pullback entries.
Advanced Raid Tactics: Layer entries (DCA-style) for maximum loot efficiency.
🛑 Stop Loss (Escape Route):
Swing Low (4H) = 1.58800 (Adjust based on your risk tolerance & lot size!)
Thieves’ Golden Rule: "No heist is worth a jail sentence!" 🚔💨
🎯 Take Profit (Escape Before the Cops Arrive!):
Primary Target: 1.62300 (or exit early if resistance gets too hot!)
⚠️ Danger Zone: High-voltage resistance = Bear Trap Territory! ⚡🐻
💡 WHY THIS HEIST WILL WORK:
✅ Bullish Momentum Intact (Price structure favors buyers)
✅ Weak CAD Fundamentals (Loonie under pressure)
✅ Smart Money Algos Likely Pushing Higher (COT data hints at institutional bias)
📰 NEWS ALERT (Avoid the Market Police!)
🚨 Upcoming High-Impact Events?
Avoid new trades during news spikes!
Trailing stops = Your getaway car! 🚗💨
💥 BOOST THIS HEIST! (Let’s Get RICH Together!)
🔥 Hit the 👍 LIKE & 🚀 BOOST button to strengthen our robbery squad!
💬 Comment your entry & TP—let’s track the loot!
🔔 Follow for DAILY HEIST PLANS!
⚠️ DISCLAIMER (Stay Out of Jail!):
This is NOT financial advice—just a pirate’s treasure map! 🗺️
Manage risk like a pro thief—don’t blow your capital!
🚀 Ready to RAID? Let’s STEAL those pips! 🏴☠️💸
EURCAD looks great for buysOn the monthly timeframe, price recently broke and closed above a key resistance level, showing clear bullish direction in the bigger picture. The weekly chart confirms this bullish bias with a clean rejection of a strong Fibonacci support zone and weekly pivot area, highlighting solid buyer interest.
On the 4-hour chart, the pair broke out from a descending channel pattern, retested the breakout zone around the weekly pivot area, and bounced strongly. This re-test confirms buyer interest. Additionally, price is trading above both the 50 and 200 SMAs, indicating a strong bullish sentiment on lower timeframes.

BUY EURCAD now for 4h time frame bullish trend continuationBUY EURCAD now for 4h time frame bullish trend continuation ...............
STOP LOSS: 1.5933
This buy trade setup is based on hidden bullish divergence trend continuation trading pattern ...
Always remember, the trend is your friend, so whenever you can get a signal that the trend will continue, then good for you to be part of it
TAKE PROFIT : take profit will be when the trend comes to an end, feel from to send me a direct DM if you have any question about take profit or anything...
Remember to risk only what you are comfortable with... trading with the trend, patient and good risk management is the key to success here

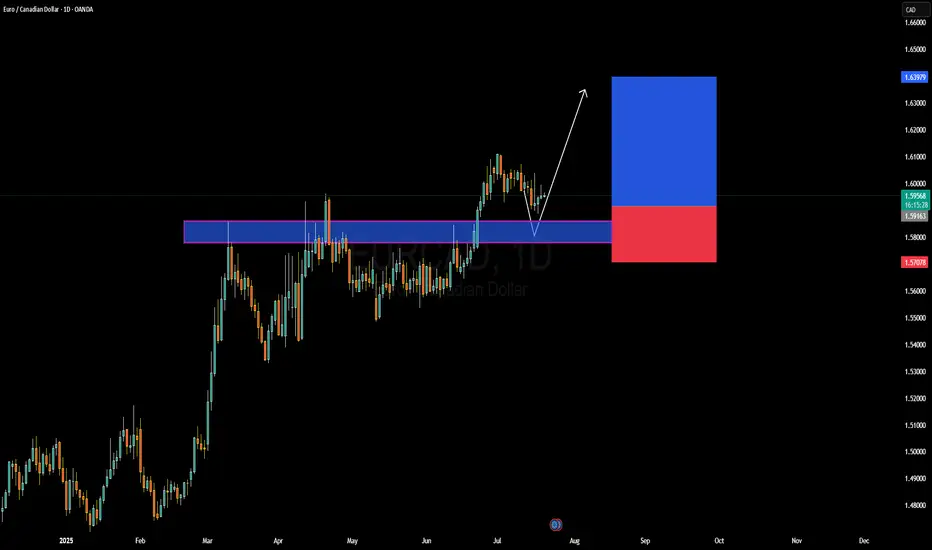
EURCAD Forming Bullish ContinuationEURCAD has recently respected a key demand zone and is now beginning to show early signs of bullish continuation. After a clean breakout above the 1.5900 resistance level earlier this month, price retested this structure and held strongly, creating a textbook bullish rejection wick. This price behavior suggests the pair is gearing up for another impulsive leg to the upside. I'm watching for follow-through momentum targeting the 1.6390–1.6400 zone in the coming weeks, aligning with the risk-to-reward setup visible on the chart.
From a fundamental perspective, the euro remains relatively supported following recent ECB comments signaling a more patient stance on future rate cuts. While inflation in the Eurozone has shown some signs of easing, policymakers remain cautious, especially with energy prices fluctuating again. On the other side, the Canadian dollar has been under pressure due to weaker-than-expected domestic growth and the Bank of Canada’s more dovish tone. Crude oil, which typically supports CAD, has been consolidating with no strong bullish drive lately, limiting CAD’s upside potential.
Technically, the current structure favors bullish continuation. The clean rejection from the previous resistance-turned-support, combined with bullish price action forming a higher low, reinforces the bullish setup. As long as the 1.5900 zone holds, this remains a high-probability long trade setup with potential to deliver strong profits in alignment with the trend.
Watch for daily closures above 1.6000 to confirm the next leg higher. Momentum indicators are flattening, and with liquidity sweeping both sides recently, it’s primed for a move. EURCAD remains on my radar for a swing buy opportunity, with the setup offering excellent technical confluence and favorable fundamental backing.
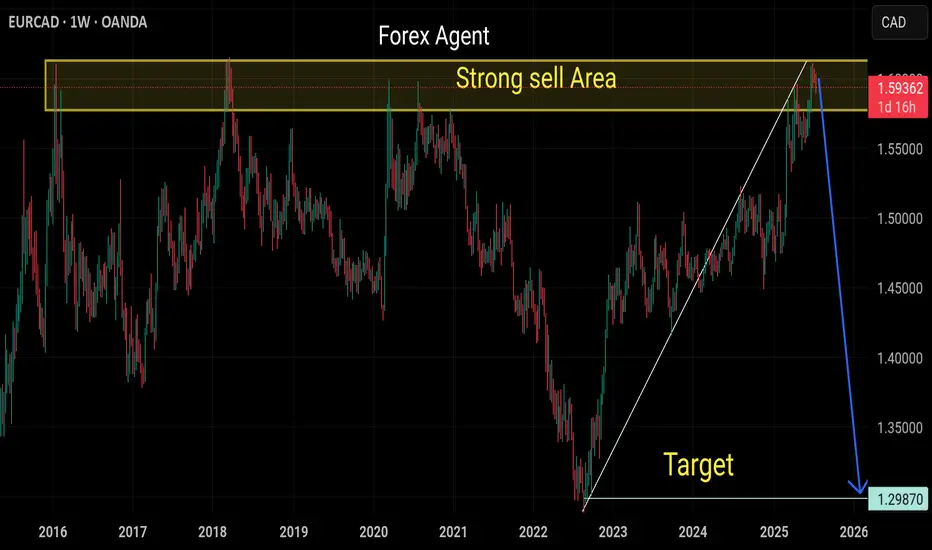
Sell eurcadStrong sell expected in next few weeks
Already too overbought in monthly and weekly time frame
Buy trend Already breaks and retested again
Strong selling area

EURCAD - Long Setup - Impulse, Correction, ImpulsePrice action has been setting up for the next impulse phase as we can the bullish continuation is completing to indicate price has further growth. Looking for a long entry this upcoming week.
Good Luck

EURCADA sell setup is forming on EUR/CAD based on a fractal “N” pattern.
Wait for a pullback after the 50% level is broken.

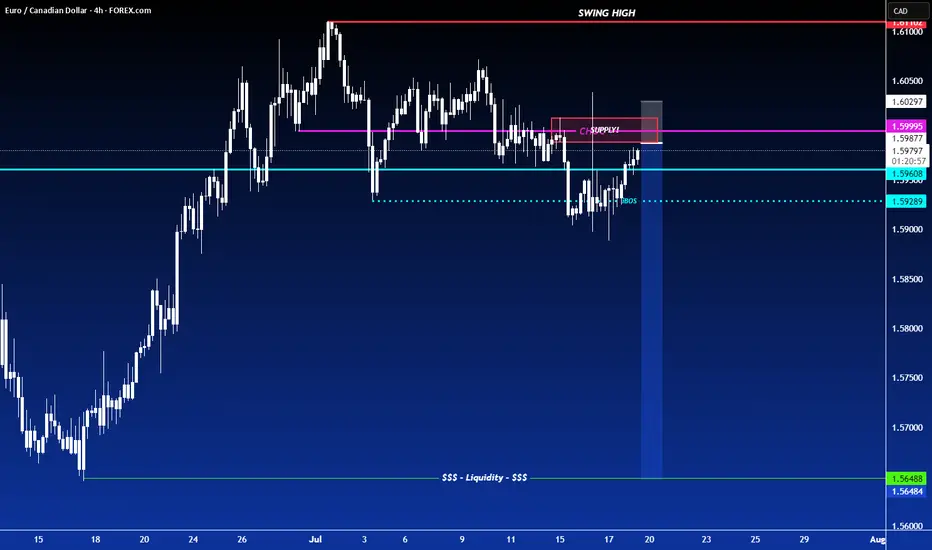
SHORT ON EUR/CADEUR/CAD has given us a nice CHOC (change of character) to the downside followed by a nice retest to supply.
I expect price to push up a little more into supply before dropping to the next support/demand level.
Looking to Catch 300-400 pips over the next few days.
18.07.25 Morning ForecastPairs on Watch -
FX:GBPAUD
FX:EURAUD
FX:EURNZD
FX:EURCAD
A short overview of the instruments I am looking at for today, multi-timeframe analysis down to what I will be looking at for an entry. Enjoy!

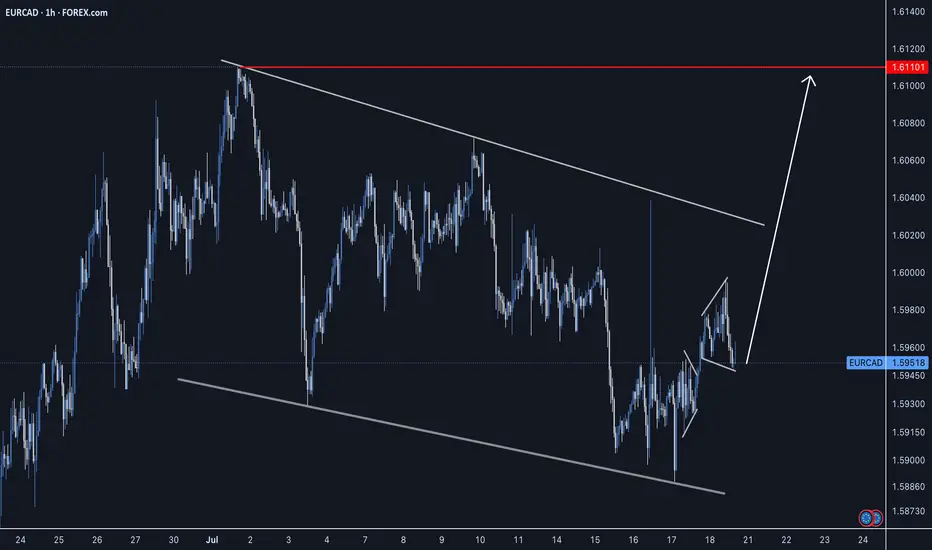
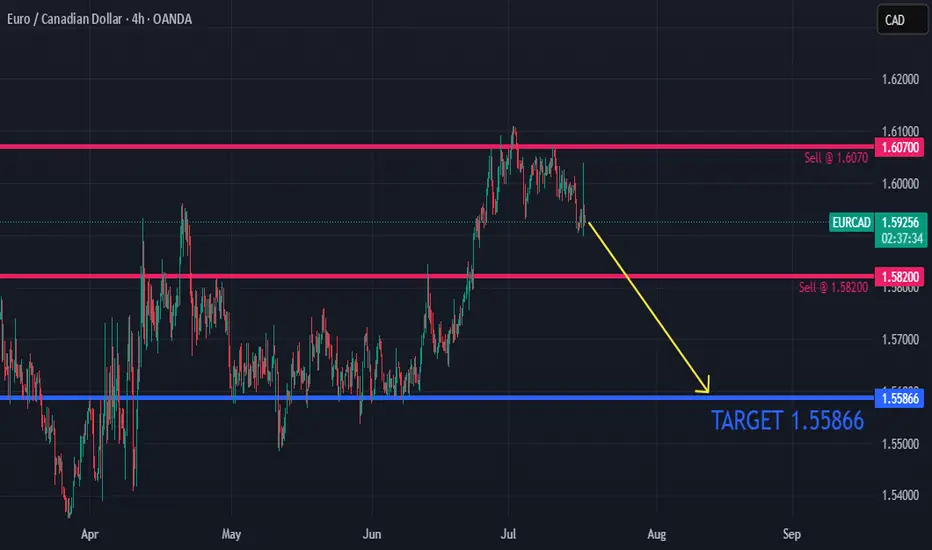
HEAD & SHOULDER PATTERN SPOTTED IN EUR/CADHead & Shoulder Pattern Spotted in EUR/CAD – Bearish Trend Expected
The EUR/CAD pair has recently formed a Head & Shoulder (H&S) pattern, a classic reversal signal that often indicates a shift from an uptrend to a downtrend. This pattern, combined with the formation of lower lows, suggests increasing bearish momentum in the market.
Current Market Structure
Price action has been moving within a secondary (corrective) trend, which appears to be nearing its end. Once this phase completes, sellers are expected to regain control, pushing the pair downward. The recent lower lows reinforce the weakening bullish sentiment, increasing the likelihood of a bearish continuation.
Key Levels to Watch
- Resistance Level (1.61100): This level is critical for sellers. If price approaches this zone and gets rejected, it could confirm the bearish outlook and trigger a downward move.
- Support/Target (1.58000): If the bearish momentum strengthens, the pair could decline toward 1.58000, aligning with the measured move of the H&S pattern.
Conclusion
With the Head & Shoulder pattern and lower lows in place, EUR/CAD is showing signs of an impending bearish move. Traders should watch 1.61100 for resistance and 1.58000 as a potential downside target. A confirmed breakdown could present a strong selling opportunity in the coming sessions.

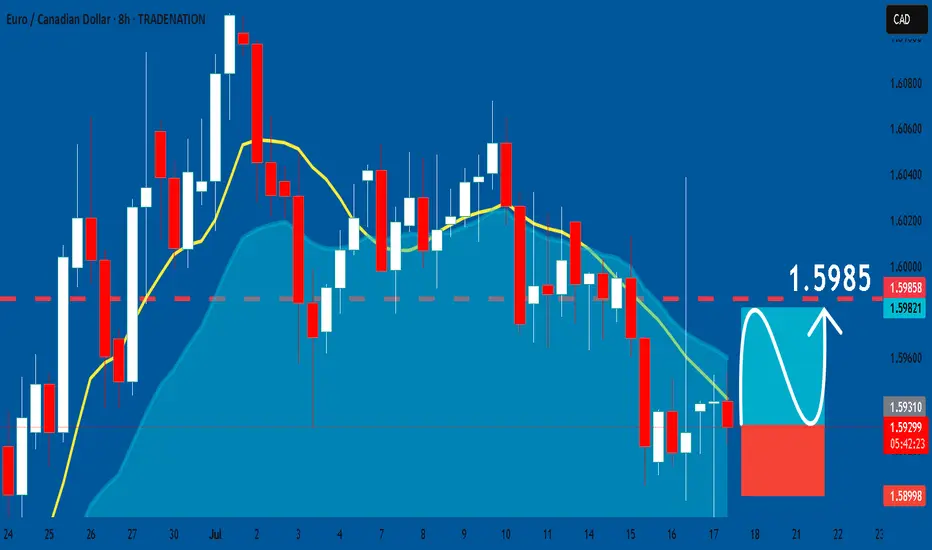
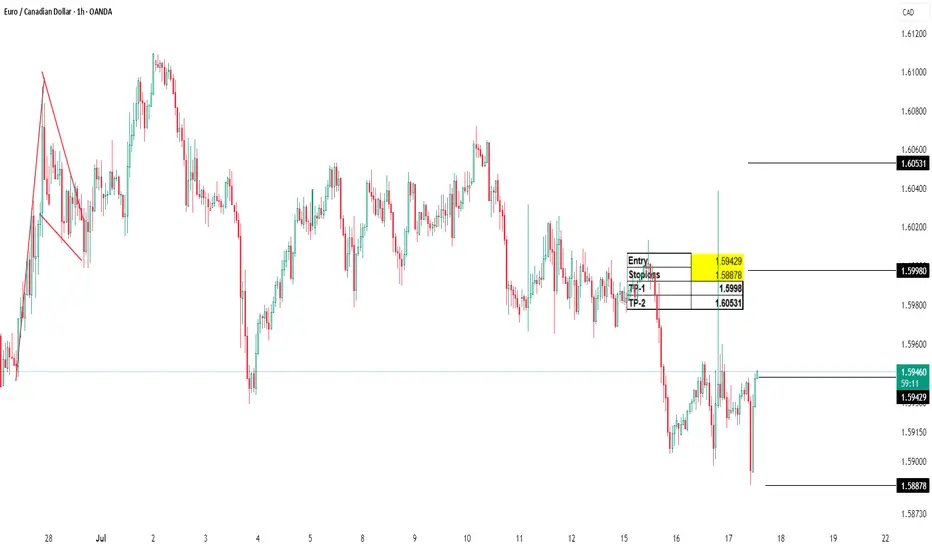
EURCAD: Long Signal with Entry/SL/TP
EURCAD
- Classic bullish pattern
- Our team expects retracement
SUGGESTED TRADE:
Swing Trade
Buy EURCAD
Entry - 1.5929
Stop - 1.5899
Take - 1.5985
Our Risk - 1%
Start protection of your profits from lower levels
Disclosure: I am part of Trade Nation's Influencer program and receive a monthly fee for using their TradingView charts in my analysis.
❤️ Please, support our work with like & comment! ❤️
Sell eurcadStrongly sell expected from this marked area
Monthly and weekly overbought pair
Ready for the bearish correction now
Daily and weekly trend breaks and retested
EURCAD Short Trade OANDA:EURCAD Short trade, with my back testing of this strategy, it hits multiple possible take profits, manage your position accordingly.
This is good trade, don't overload your risk like greedy, be disciplined trader, this is good trade.
Use proper risk management
Looks like good trade.
Lets monitor.
Use proper risk management.
Disclaimer: only idea, not advice
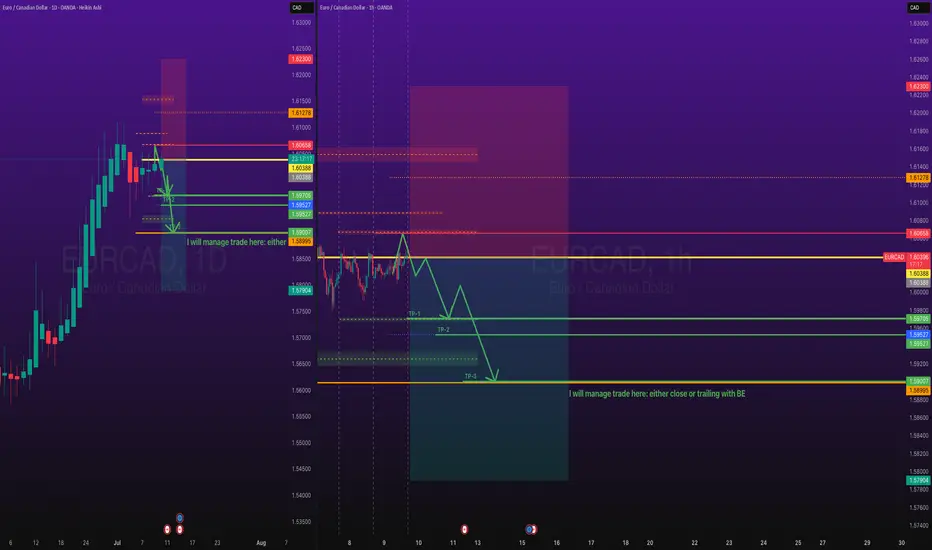
EURCAD – Two Key Levels, One Solid PlanOn this pair, we have two important levels:
🟡 The first level might act as a trap (stop hunting).
So don’t rush to buy — wait for confirmation.
🟢 The second level offers a safer buy opportunity.
As always, our plan stays firm —
we don’t tell the market what to do, we follow it.
🔻 If a clean break and valid pullback occurs on the first level,
a short trade toward the lower level is possible.
⚠️ This pullback short scenario is only valid until price reaches the lower level.
If price hits the lower level and starts moving up,
any short position becomes much riskier.
Discipline > Prediction.

EURCADWEEKLY is bullish, I'm expecting the continuation if price breaks above the bearish candles and gives us a bullish OB. Then we can buy back to the weekly high. confirmation is waiting for the 4h bullish OB to form.

EurCAD LongWe are at key area. At the support. We are looking to buy to the level as shown. We hope to get1:2 Return

YOU MUST BE A CONFLUENCE FINDER, let me explain.......All the information you need to find a high probability trade are in front of you on the charts so build your trading decisions on 'the facts' of the chart NOT what you think or what you want to happen or even what you heard will happen. If you have enough facts telling you to trade in a certain direction and therefore enough confluence to take a trade, then this is how you will gain consistency in you trading and build confidence. Check out my trade idea!!
tradingview.sweetlogin.com
