GBPCAD Q3 | D24 | W30 | Y25📊GBPCAD Q3 | D24 | W30 | Y25
Daily Forecast🔍📅
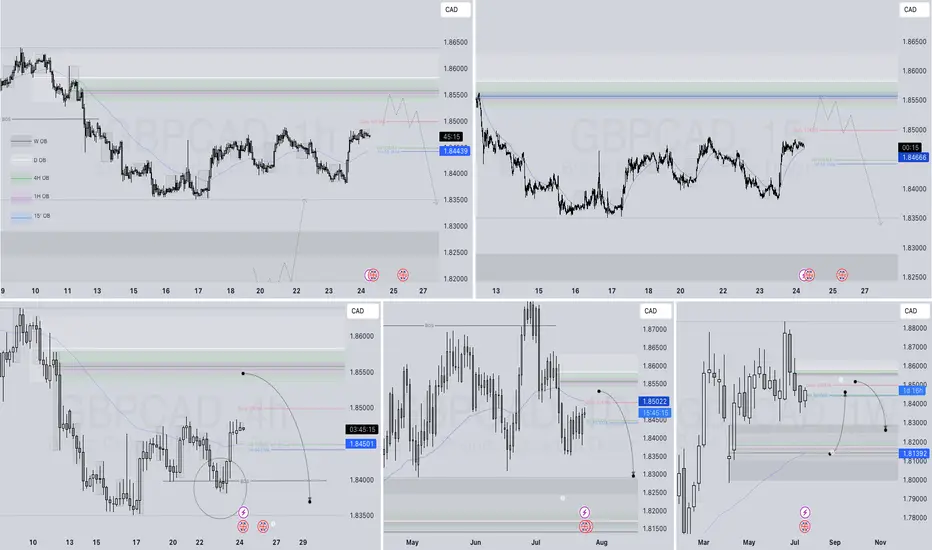
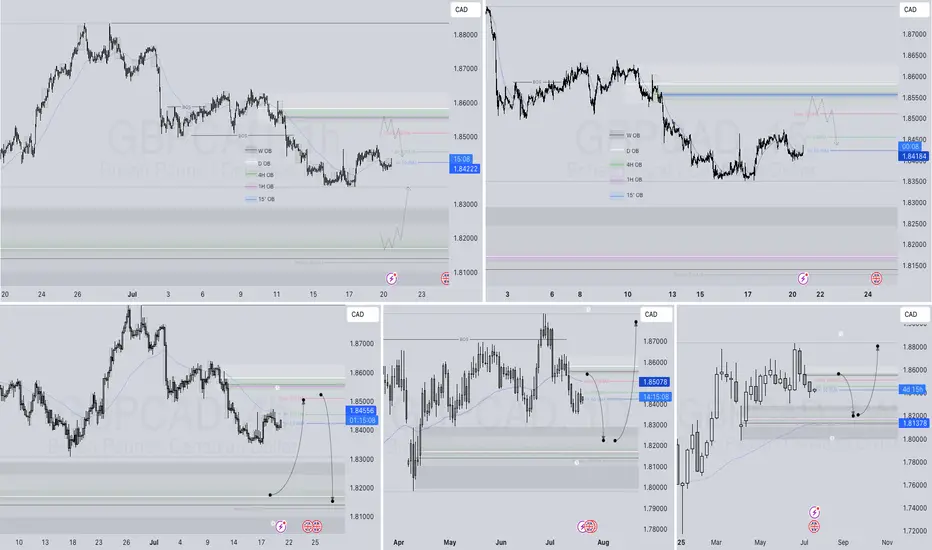
Here’s a short diagnosis of the current chart setup 🧠📈
Higher time frame order blocks have been identified — these are our patient points of interest 🎯🧭.
It’s crucial to wait for a confirmed break of structure 🧱✅ before forming a directional bias.
This keeps us disciplined and aligned with what price action is truly telling us.
📈 Risk Management Protocols
🔑 Core principles:
Max 1% risk per trade
Only execute at pre-identified levels
Use alerts, not emotion
Stick to your RR plan — minimum 1:2
🧠 You’re not paid for how many trades you take, you’re paid for how well you manage risk.
🧠 Weekly FRGNT Insight
"Trade what the market gives, not what your ego wants."
Stay mechanical. Stay focused. Let the probabilities work.
FRGNT
CADGBP trade ideas
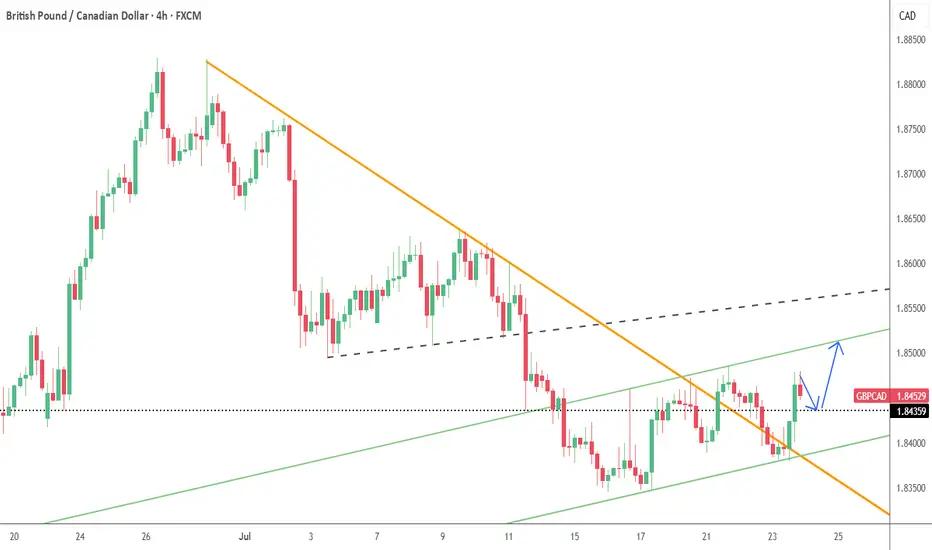
GBPCAD--BUY4h timeframe
--break of descending line (orange line)
--BUY at level around 1.84350
--TP is at upper line of ascending channel
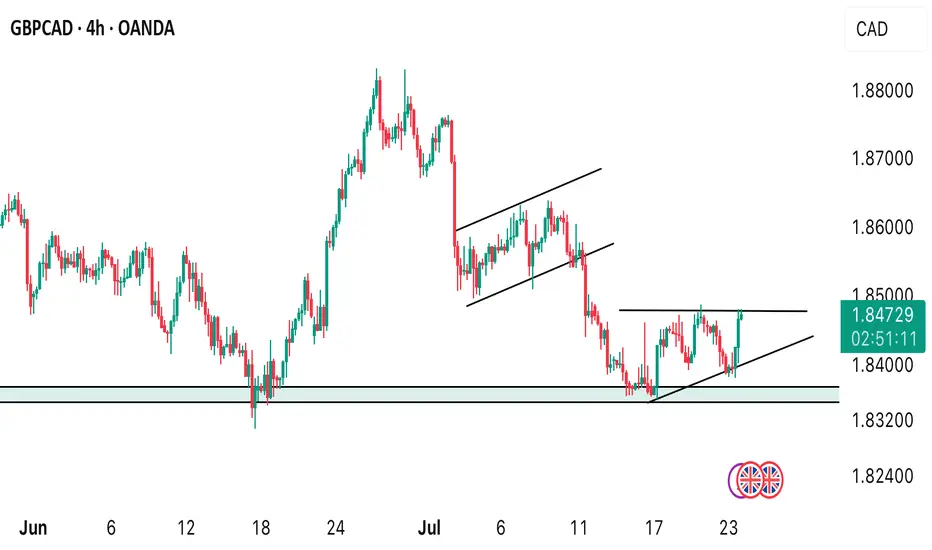
GBPCAD H4 TIMEFRAME. BIG MOVE IS EXPECTED!From the H4 timeframe, price aggressively pushed to the support level of 1.83460 we’re waiting for the next update on price to either see a rebound around the support level or a break below the level. We keep a close watch.
GBPCADDate:
July 23,2025
Session:
Tokyo and London session
Pair:
GBPCAD
Bias:
Long
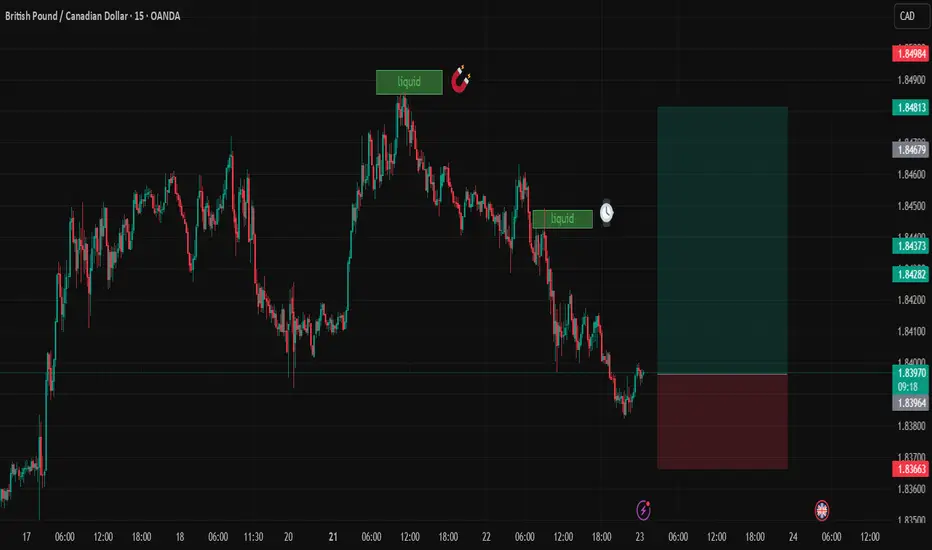
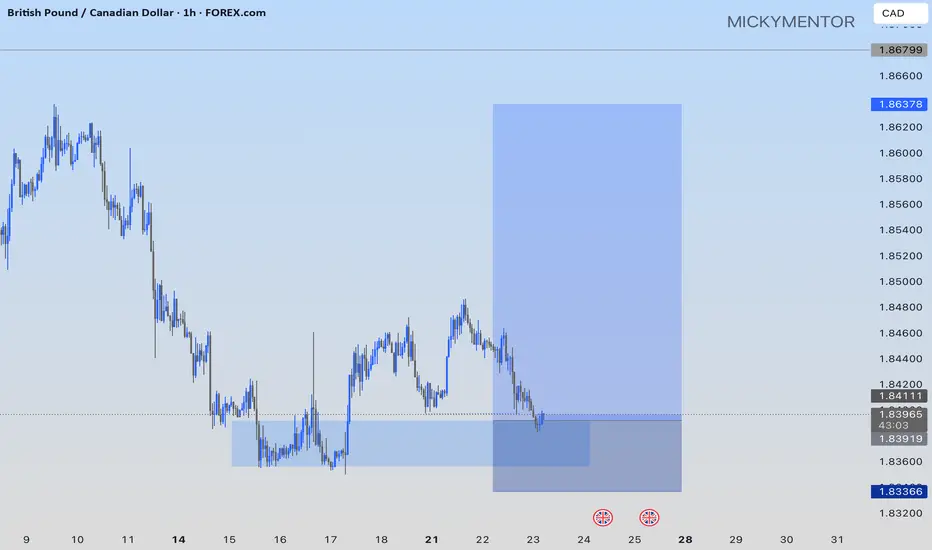
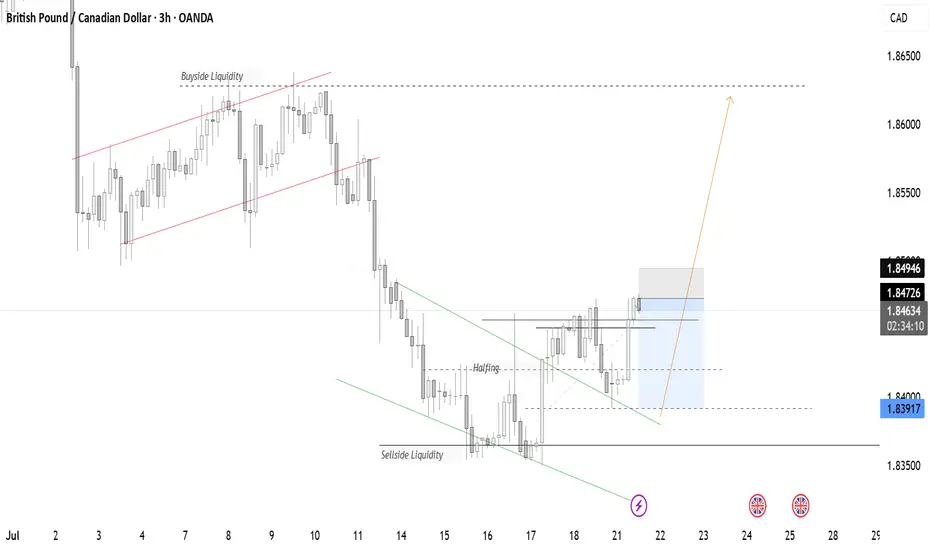
2 liquidity pools that are waiting to be swept this week. Looks like price is gonna be magnetized towards these levels during London and Tokyo. The trade may even stretch into NYC.
Entry: 1.83970
Stop Loss: 1.83674
Target: 1.84811
RR: 2.82
GBPCAD Moving UpAs per our previous analysis GBPCAD has taken off. We can expect a reversal to breakeven point, do not hesitate to add more positions.
LONG ON GBP/CADGBP/CAD is now at a major key area/demand zone after completing its pullback phase.
I expect price to now rise to the next level of supply or previous high.
looking to catch 200-400 pips throughout the week.

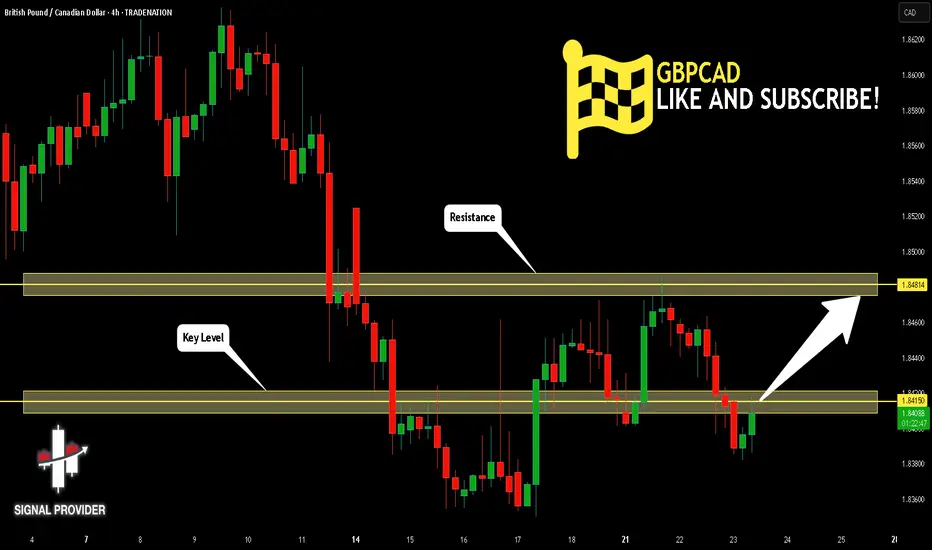
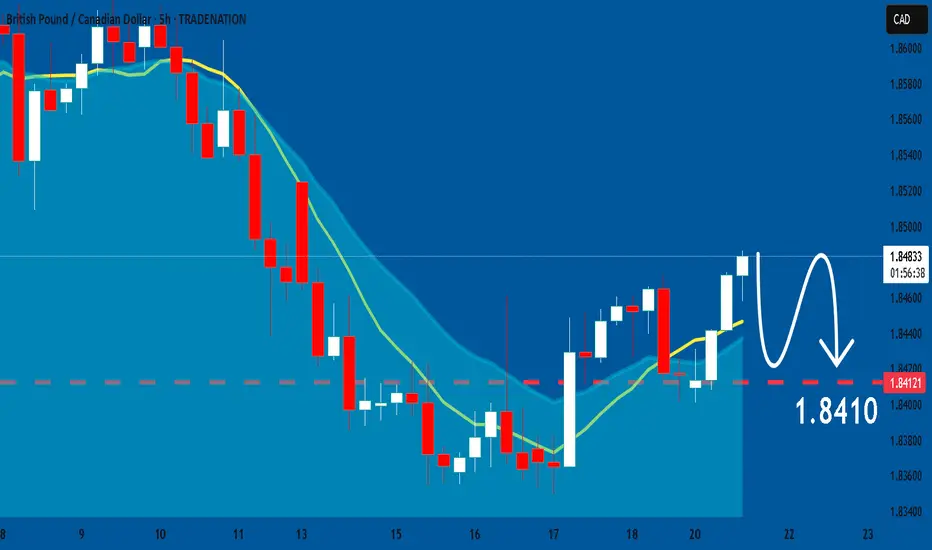
GBPCAD Is Very Bullish! Buy!
Please, check our technical outlook for GBPCAD.
Time Frame: 4h
Current Trend: Bullish
Sentiment: Oversold (based on 7-period RSI)
Forecast: Bullish
The market is approaching a significant support area 1.841.
The underlined horizontal cluster clearly indicates a highly probable bullish movement with target 1.848 level.
P.S
The term oversold refers to a condition where an asset has traded lower in price and has the potential for a price bounce.
Overbought refers to market scenarios where the instrument is traded considerably higher than its fair value. Overvaluation is caused by market sentiments when there is positive news.
Disclosure: I am part of Trade Nation's Influencer program and receive a monthly fee for using their TradingView charts in my analysis.
Like and subscribe and comment my ideas if you enjoy them!
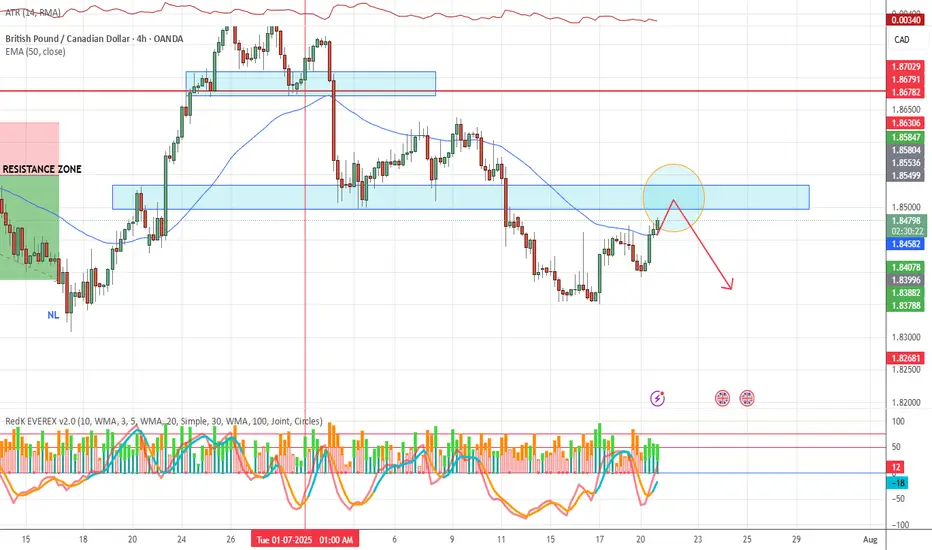
GBPCAD SELLSH4 double top with broken neckline at a strong daily zone, bearish flag was also formed. Looking at next daily support around 1.81500
GBPCAD: I’M BUYING NOW!!!OANDA:GBPCAD I’m buying at the current market price with my target at 1.86378
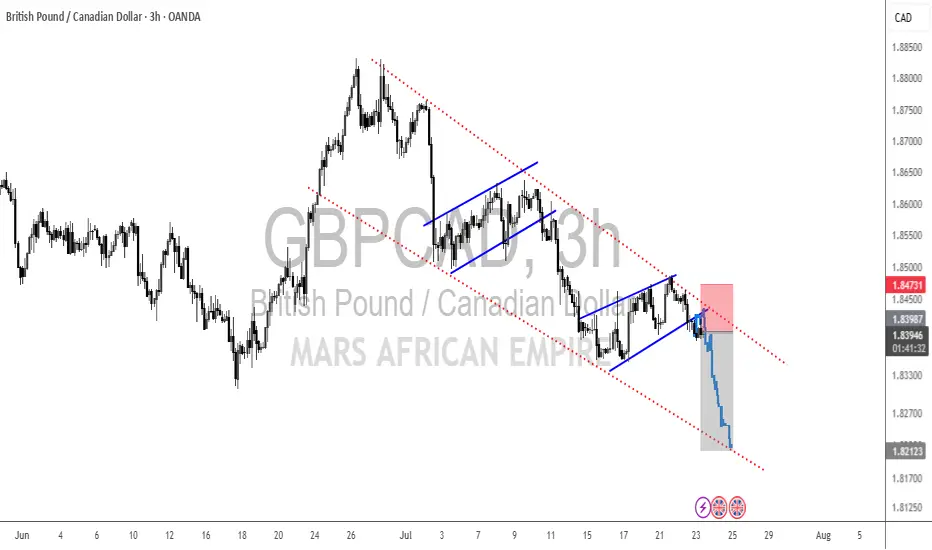
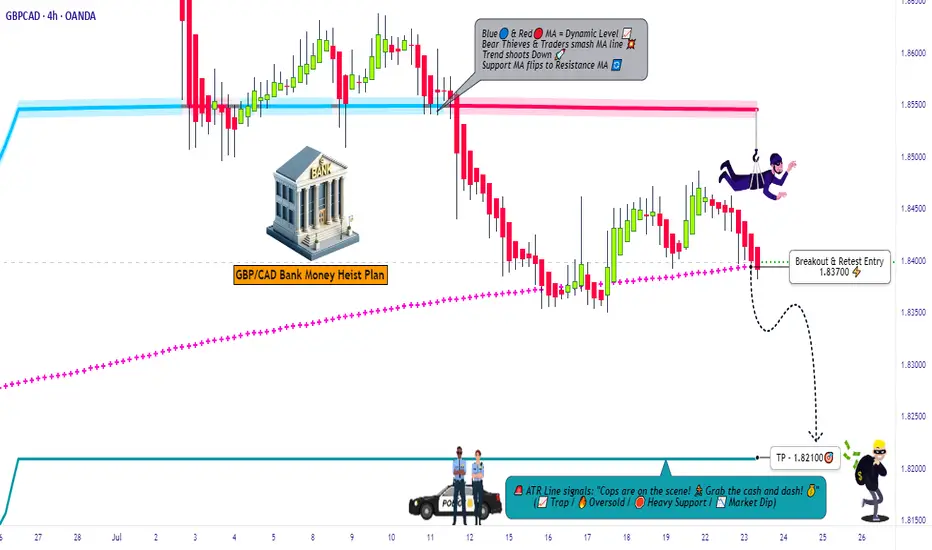
GBP/CAD Downtrend Setup – Clean Heist Entry Strategy🔥💷💣 THE GBP/CAD FOREX HEIST PLAN 💣💷🔥
Thief Trader Style – "Rob the Market, Not Each Other"
🧠 Smart Strategy | 🔍 Deep Analysis | 🎯 High Probability Plays | ⚔️ Risk-Controlled Attack
🌍 Hi! Hola! Ola! Bonjour! Hallo! Marhaba!
Dear Money Makers & Market Robbers, 🤑💰✈️
Welcome to another legendary forex robbery mission – this time, we’re planning the ultimate Pound vs. Loonie Heist (GBP/CAD). Powered by Thief Trading’s precision analysis (both technical & fundamental), this setup is designed for disciplined, stealthy traders who know how to attack at the right moment. Let’s take what’s ours from the market – the Thief way.
🔫 THE SETUP: GBP/CAD MARKET RAID
We’re eyeing a Short Entry near 1.83700 after the Moving Average Breakout Confirmation.
This ain’t just any pullback – this is a trap zone, a Police Barricade ATR Blue Zone, where liquidity fakes out the greedy bulls and invites a high-probability short for those with a thief’s vision.
Chart structure screams: overbought, slowing momentum, divergence + confluence = Bear Attack.
📍 Entry Plan:
💥 “The Heist is ON! Wait for the MA break… Then make your move at 1.83700!”
☑️ Sell Stop Orders – Just above the Moving Average or after key Support Break
☑️ Sell Limit Orders – For pullbacks at 15m or 30m TF near SWING H/L
☑️ Layered Entries / DCA Style – Multiple small entries for maximum control
☑️ Set Alerts! – Chart alarms keep your eyes sharp, your entries sharper.
🚨 Stop Loss Protocol (SL):
🛑 “No SL before breakout. You place early – you get burned.”
🗡️ After Breakout ONLY: SL near 1.84500, 4H Swing High
🛡️ Adapt based on your risk %, lot size, and number of open orders
🤫 Pro Tip: Smart SLs protect you, not limit you. Be like a ghost in the market.
🎯 Target Zone (TP):
📉 Initial Target: 1.82100
💨 “Get in, grab the bag, get out.”
You’re a thief – no greed, just precision. Exit before the alarms ring if the market flips!
🔎 Macro Factors Fueling the Bear Trend:
📉 Hawkish BOC tones down, GDP data contraction vibes
📈 GBP sentiment mixed; technical overbought signals dominate
🎭 Consolidation breakdown = High-Reward Entry Window
📰 News Awareness = Smart Survival:
⚠️ Avoid New Trades During Major News
📍 Use Trailing SLs to Protect Open Profits
🧨 Don’t get caught in the volatility trap – let the chaos work for you, not against you.
💥 BOOST THIS HEIST PLAN – ROBBERS UNITE 💥
Smash the “Boost” Button to power up our Thief Gang's momentum. Your support sharpens the edge for all fellow robbers in this daily market hustle.
🧠 Precision Plan
🧭 Risk-Aligned Entry
📈 Profitable Exit
That’s how Thief Traders operate.
🤑 Stay ready for the next drop. Another Forex bank is about to get robbed clean.
💣💰Let’s rob the charts – not each other.
— Thief Trader, Robbin’ with Logic & Style
🏴☠️📉📲
BUY GBPCADGBPCAD finally reaches an area of demand where we should see price steadily climb back to the resistance. We can expect some aggressive bullish moves from the pair.
SHORT in GBPCADHello Fellows,
I’m opening a SHORT position on GBPCAD, supported by the sustained downtrend we've been observing. This move is further reinforced by signs of economic slowdown in the UK, which could continue to weigh on the pound.
GBPCAD new bearish expecting
OANDA:GBPCAD last analysis we are be accurate (attached), currently continuation type, RAISING WEDGE pattern visible, we are have strong bearish push, and still expectations are bearish.
SUP zone: 1.85000
RES zone: 1.83000, 1.82200

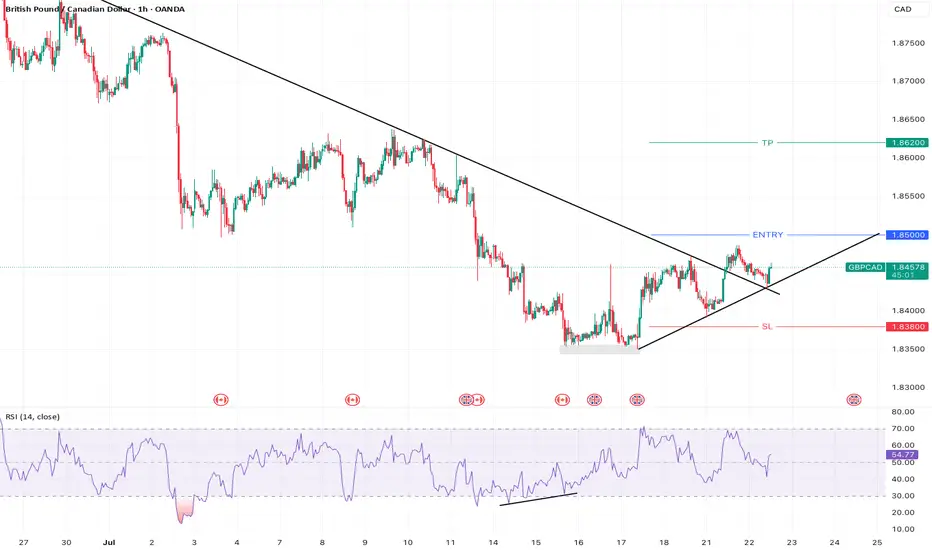
GBPCAD - Bullish ReversalGBPCAD has formed a double bottom with divergence and broken its lower high and trend line. There is a potential upside.
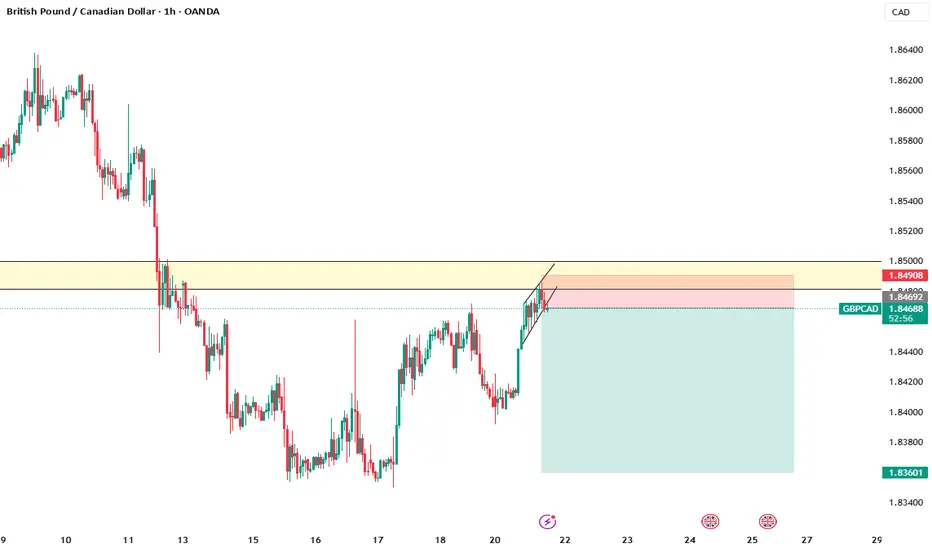
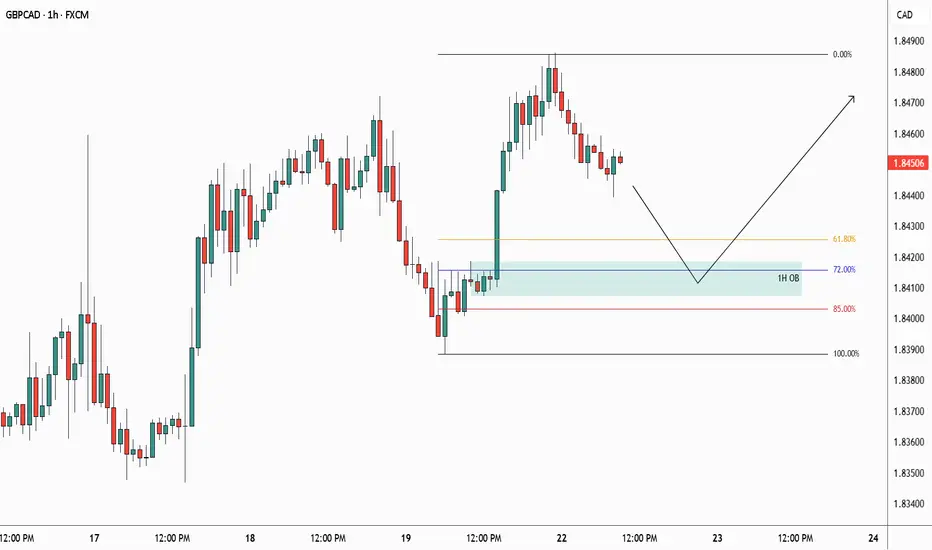
GBPCAD Bullish Set-upAfter an impulsive bullish move, price is currently in a corrective phase. It is approaching the Optimal Trade Entry (OTE) zone, which aligns with the 1-hour demand zone (bullish order block). This confluence of the Fibonacci 61.8%–85% retracement levels and the demand area suggests a potential bullish bounce and continuation toward the recent high.
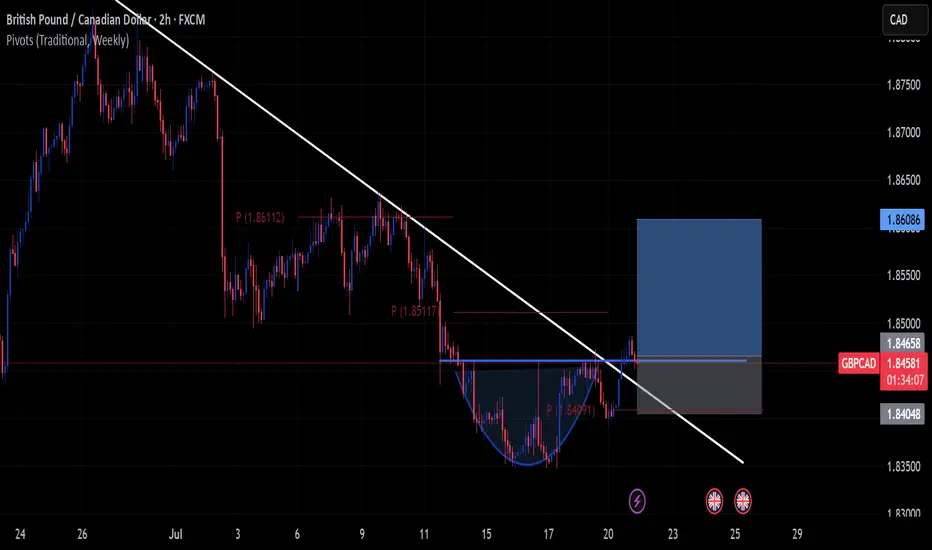
GBPCAD juicy very juicyThis is an A+ setup!!
Not perfect but clean.
I dont usually see a cup and handle a lot but this one certainly looks juicy.
SL behind the pivot, mmmhhh just juicy.
GBPCAD: Will Start Falling! Here is Why:
Remember that we can not, and should not impose our will on the market but rather listen to its whims and make profit by following it. And thus shall be done today on the GBPCAD pair which is likely to be pushed down by the bears so we will sell!
Disclosure: I am part of Trade Nation's Influencer program and receive a monthly fee for using their TradingView charts in my analysis.
❤️ Please, support our work with like & comment! ❤️
GBP/CAD POSSIBLE SETUPWatching this market closely as price approaches the key S/R zone.
If we get a pullback into that area, we’ll be looking for:
*Volume to increase in the direction of the trade (downside),
*Momentum to first push up, then hook down (the deeper the rise before the hook, the better),
*A clean engulfing candle to the downside for the trigger.
*All of this must happen near the 50EMA and in full alignment with the VMS strategy rules.
📌 Stay patient. Let the setup come to us.
Keep watching.
Sell GBPCADOur long awaited setup has triggered. Sell GBPCAD to the low created at the beginning of todays trading sessions.
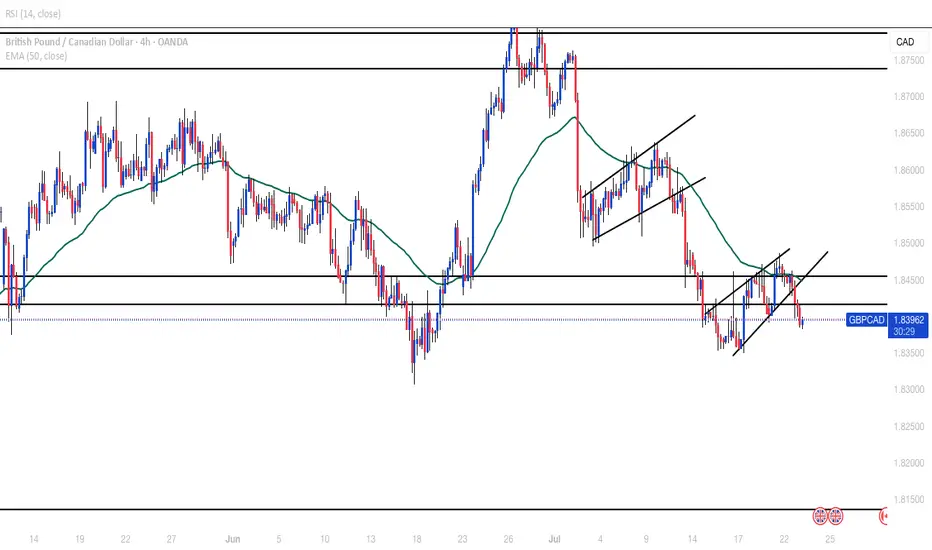
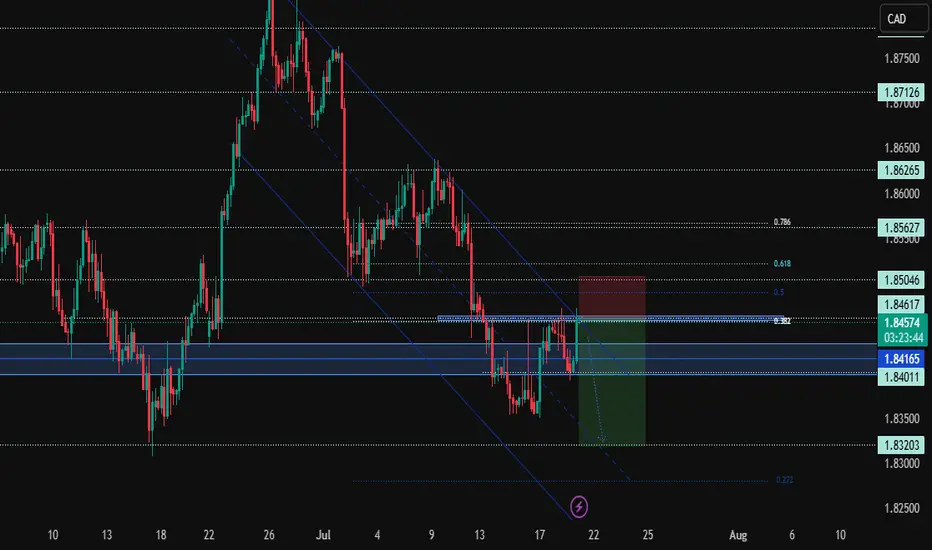
GBPCAD Rejects Key Fib Resistance – Bearish Continuation Ahead?Hey Traders,
OANDA:GBPCAD has tapped into the 1.84617–1.85046 resistance zone, aligning with the 0.382–0.5 Fibonacci retracement and channel resistance. Price is showing signs of rejection with wicks and a bearish setup brewing- suggesting a potential continuation to the downside within the descending channel.
Current Market Conditions:
Price is respecting a well-defined descending channel, consistently printing lower highs and lower lows.
Recent rejection from the 1.84617–1.85046 resistance zone (Fibonacci 0.382–0.5 zone).
Structure still bearish; price remains below channel midline.
Support region stands around 1.84165, with further room toward 1.83203.
Fundamental Analysis/Outlook:
The Canadian Dollar is underpinned by stable oil prices and cautious BoC policy tightening bias, while the British Pound remains pressured due to soft economic data and BoE’s mixed tone on rate trajectory. With risk sentiment fragile and commodity demand still steady, CAD strength could persist, adding downward pressure to GBPCAD.
Targets:
TP1: 1.84165
TP2: 1.83203
TP3: 1.83000 (channel extension / -0.272 Fib)
Risk Management:
Stop-loss: Above 1.85046 (Fibonacci 0.5 + structural high)
R:R of approximately 1:2.5 on current setup.
Watch for volatility during CAD and GBP news—tighten stops if needed.
Technical Outlook:
As long as price holds below 1.84617 and fails to break above the descending channel, the bearish outlook remains intact. Look for confirmation via bearish engulfing candle or lower time frame break of 1.84165. A decisive break below this level could accelerate a fall toward 1.8320 support.
Conclusion:
GBPCAD remains in bearish territory, rejecting a significant supply zone. With sellers defending the structure and no bullish breakout in sight, we anticipate further downside unless buyers reclaim 1.8500+. Let the chart lead—trade what you see, not what you feel.
Sign-off:
"In markets, clarity often lies just beyond the fear. Trade the levels, not the noise."
💬 I’d love to hear your thoughts- drop a comment, boost the post, and follow for more sharp setups. Stay focused and trade wisely!
GBPCAD Q3 | D21 | W30 | Y25📊GBPCAD Q3 | D21 | W30 | Y25
Daily Forecast 🔍📅
Here’s a short diagnosis of the current chart setup 🧠📈
Higher time frame order blocks have been identified — these are our patient points of interest 🎯🧭.
It’s crucial to wait for a confirmed break of structure 🧱✅ before forming a directional bias.
This keeps us disciplined and aligned with what price action is truly telling us.
📈 Risk Management Protocols
🔑 Core principles:
Max 1% risk per trade
Only execute at pre-identified levels
Use alerts, not emotion
Stick to your RR plan — minimum 1:2
🧠 You’re not paid for how many trades you take, you’re paid for how well you manage risk.
🧠 Weekly FRGNT Insight
"Trade what the market gives, not what your ego wants."
Stay mechanical. Stay focused. Let the probabilities work.
FRGNT 📊
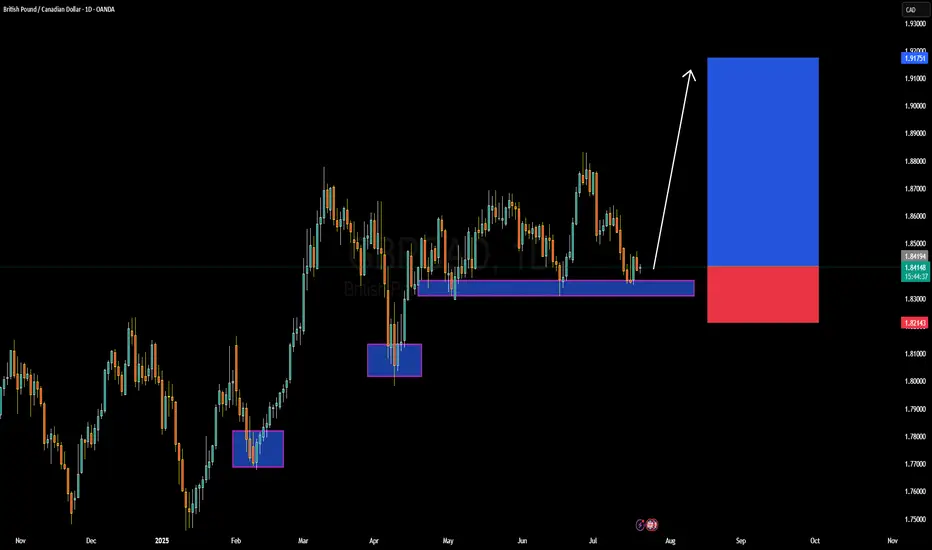
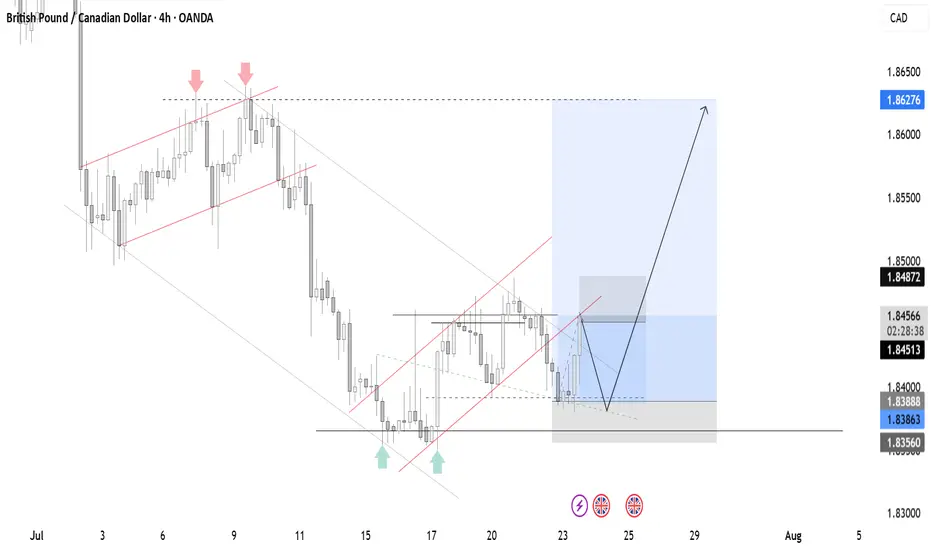
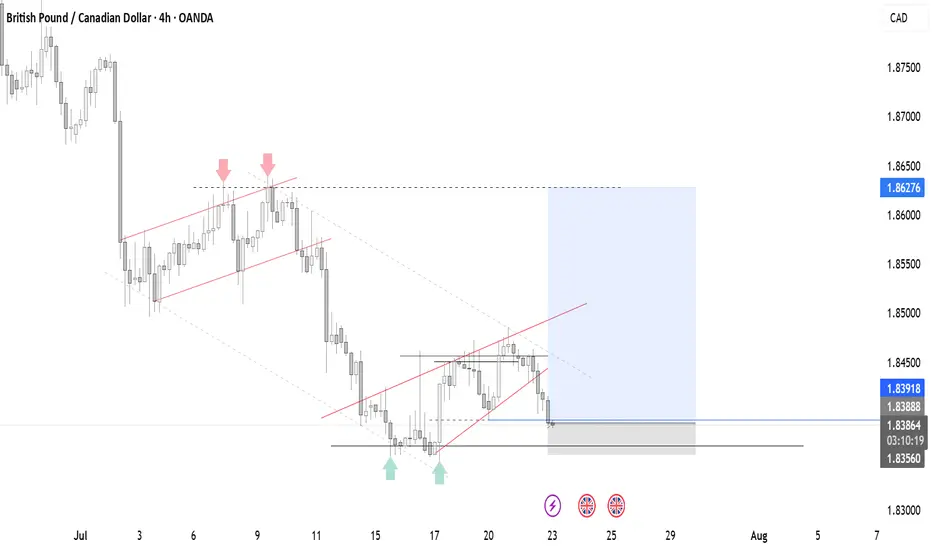
GBPCAD Forming Strong Bullish ReactionGBPCAD has once again tapped into a key daily demand zone that's held strong multiple times this year, forming a reliable support base around the 1.8200–1.8300 level. Price action has consistently respected this area, creating a clear bullish structure of higher lows following each test. The recent bounce indicates buyer interest is still strong, and I’ve entered long positions here with a high conviction that the bullish leg is about to resume. The risk-to-reward ratio on this setup is highly favorable, with upside potential targeting the 1.9150–1.9200 region.
From a macro perspective, the British pound remains supported by the Bank of England’s hawkish stance. Inflationary pressure in the UK remains sticky, keeping the door open for further rate hikes or at least prolonged tight monetary policy. On the flip side, the Canadian dollar is under slight pressure due to falling crude oil prices and the Bank of Canada's relatively more dovish outlook in recent statements, despite recent CPI upticks. This divergence in policy bias adds tailwind to the GBPCAD bullish bias.
Technically, this pair is respecting market structure with precision. Each bounce from the marked support zones has led to meaningful rallies, and current price behavior is following the same playbook. The consolidation over the past few sessions suggests accumulation, with a bullish breakout likely to follow. The marked blue target zone aligns with a clean price inefficiency and liquidity pool on the left side of the chart.
With momentum building and fundamental drivers favoring GBP strength, I expect a continuation move toward 1.9150 in the coming weeks. Patience and position management are key here, but the setup remains valid and in profit. Traders watching this zone should be alert for bullish confirmations and volume spikes to ride the next impulsive wave.