Buy Cadjpy if new high is made above current current You can wait for retracement or put buy stop above current handle. Readjust stop loss when you see 30pips profits
CADJPY trade ideas
A breakout spotted in CADJPY daily timeframe!!We now have a clear trending market in CADJPY from the daily chart. It’s a good time to position for a buy opportunity. I’d be monitoring price for a shift in momentum so as to buy

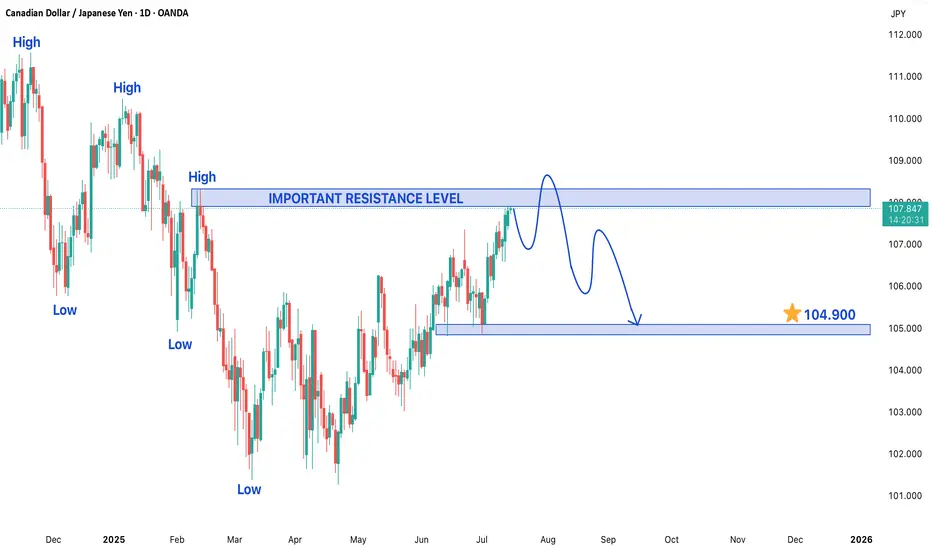
CAD/JPY is currently exhibiting a bearish trend structureThe CAD/JPY currency pair is currently exhibiting a bearish trend structure, indicating a prevailing downward momentum in its price action. At present, the pair is trading within a secondary trend near a significant resistance level, which is a critical point that could determine its next directional move. Traders and investors are closely monitoring this level as a breakout or rejection here could set the tone for future price movements.
On the lower side, if the bearish momentum continues, the price may decline toward the target of 104.900. This level could act as a key support zone, where buyers might step in to halt further losses. A break below this support could intensify selling pressure, potentially pushing the pair toward lower levels. Conversely, if the price finds stability near this support, a short-term rebound could occur, providing traders with potential buying opportunities in a corrective phase.
On the higher side, if the pair manages to overcome the current resistance, it may attempt to test the next key resistance level at 108.300. A successful breakout above this level could signal a shift in market sentiment, possibly leading to a trend reversal or a stronger corrective rally. However, given the prevailing bearish structure, any upward movement may face strong selling pressure near resistance zones, limiting upside potential.
Traders should remain cautious and watch for confirmation signals before entering positions. Key indicators such as moving averages, RSI, and MACD can provide additional insights into momentum and potential reversals. Risk management strategies, including stop-loss orders, should be employed to mitigate downside risks in case the market moves against expectations. Overall, the CAD/JPY pair remains in a bearish phase, and its next major move will depend on how it reacts to the critical resistance and support levels mentioned.
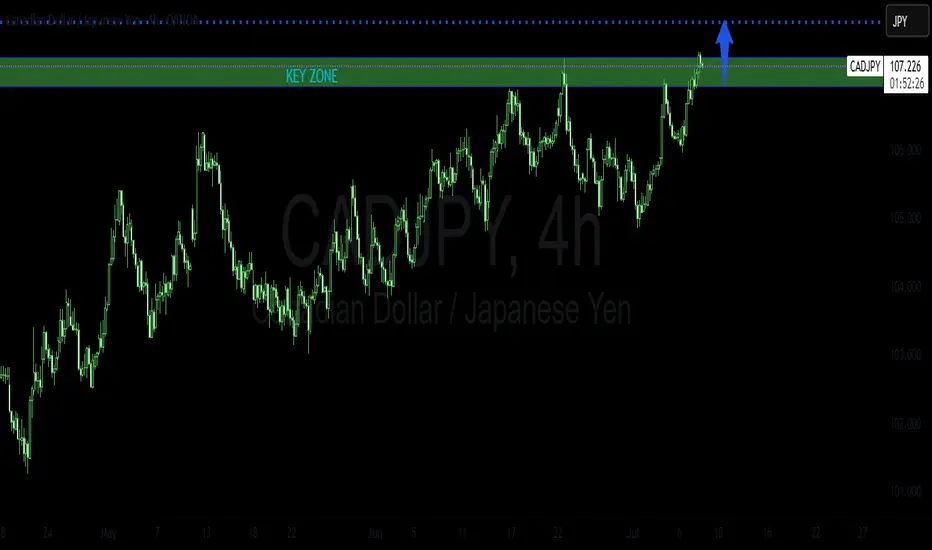
CADJPY LONG TRADE PLANThe pair broke above the key zone area on H4. Next level to test is near the 107.770 and 108.350 area.
Please do your own analysis before placing any trades.
Cheers and Happy Trading !!!!
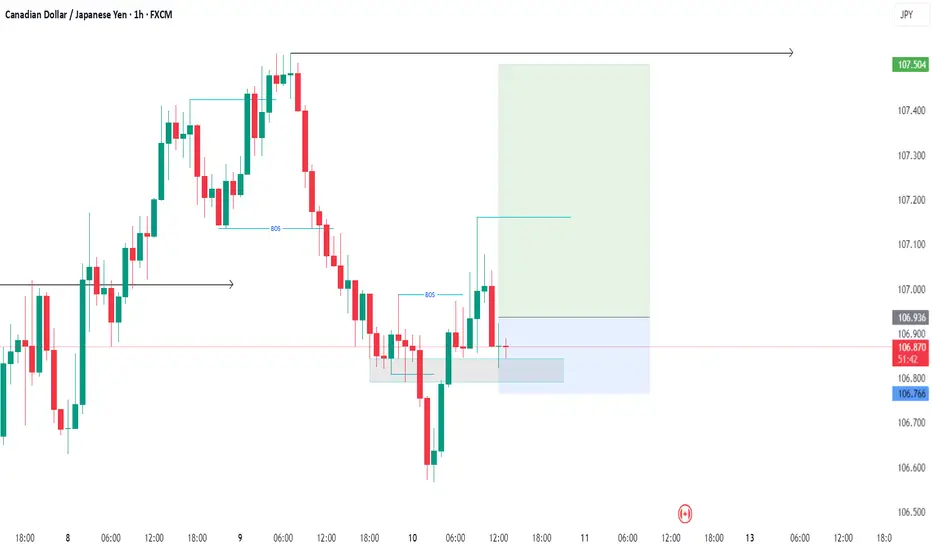
The Market Rewards the PatientLast week was probably one of the slowest weeks I’ve ever had. I found two setups, but neither one truly materialized. They just didn’t meet all the conditions in my plan. It was tough. I won’t pretend it wasn’t tempting to drop my rules and chase other strategies just so I could be in the market.
But deep down, I knew exactly what I wanted. I want to be consistent . I want to trade like a professional . So I held back. All week, I watched and waited. No trades taken. It was boring, honestly . But that boredom protected my capital.
Instead of forcing trades, I spent the entire weekend backtesting , drilling into my strategy even more. I wanted to be sure that when my moment came, I’d recognize it without hesitation.
Then this week started. I didn’t know if it would be any different, but I trusted my process and stayed ready. Eventually, one clean setup appeared. I shared it here on TradingView. I managed my risk properly , took half my usual size at just 0.5%, and let the trade run. It almost hit my stop, but I didn’t touch it. It was simple: either TP or SL .
And this time, it hit TP. A clean 1:4.
This was a powerful lesson. Following my plan didn’t just lead to a winning trade. It protected my capital all of last week when the market wasn’t offering quality setups. That patience and discipline paid off.
That’s how you build consistency. That’s how you survive long enough to catch the trades that truly matter.
CADJPY BUYWe have transitioned from a downtrend to and up trend as shown by the transition for lower low and lower high to a higher high and potential higher low. we have pulled back to a key level for an entry.
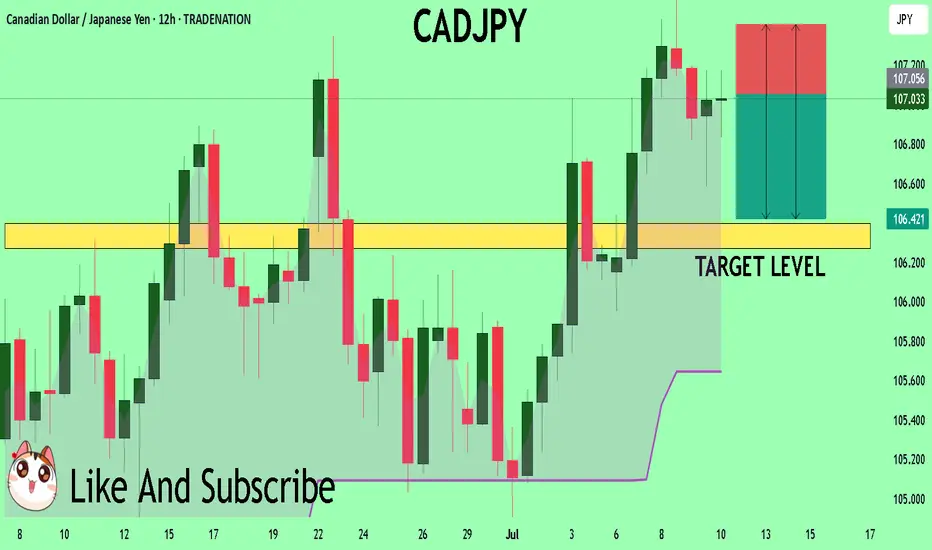
CADJPY Under Pressure! SELL!
My dear subscribers,
CADJPY looks like it will make a good move, and here are the details:
The market is trading on 107.07 pivot level.
Bias - Bearish
My Stop Loss - 107.40
Technical Indicators: Both Super Trend & Pivot HL indicate a highly probable Bearish continuation.
Target - 106.39
About Used Indicators:
The average true range (ATR) plays an important role in 'Supertrend' as the indicator uses ATR to calculate its value. The ATR indicator signals the degree of price volatility.
Disclosure: I am part of Trade Nation's Influencer program and receive a monthly fee for using their TradingView charts in my analysis.
———————————
WISH YOU ALL LUCK
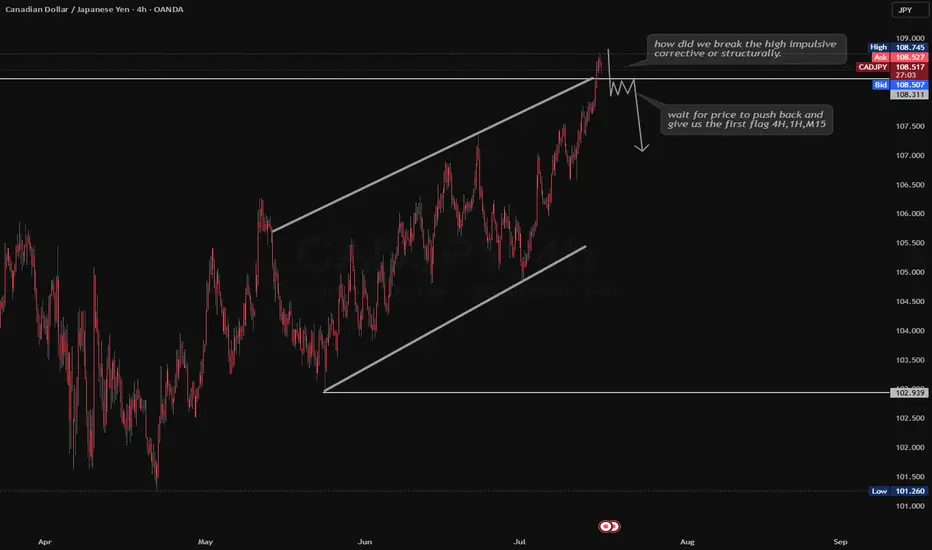
CADJPY Shortwe saw price creating a channel towards the top of structure and broke the area of value impulsively .
now we waiting for price to push back into the channel and give us a flag either an hourly flag or 15 min flag for entry confirmation to go short.
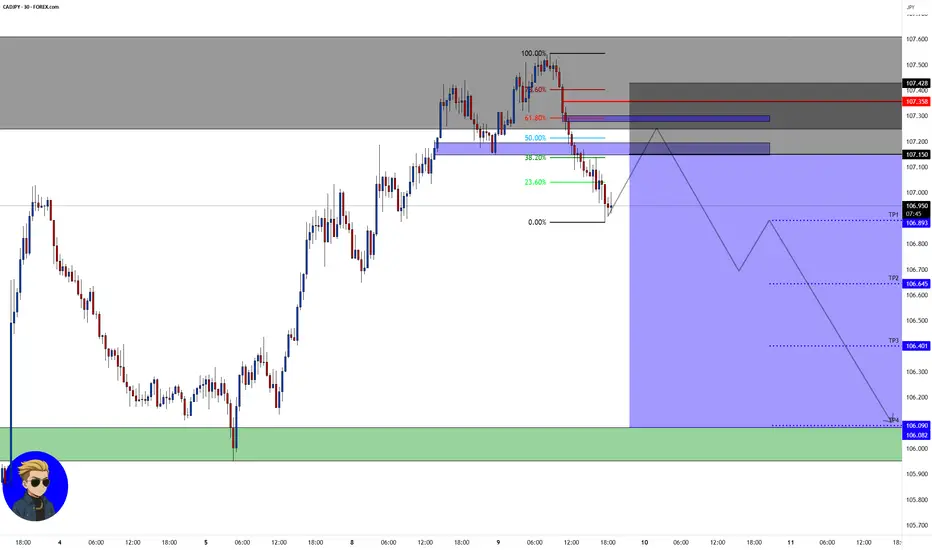
CAD/JPY💰Symbol: { CAD/JPY }
🟩Price: { 107.150 }
🟥Stop: { 107.428 }
1️⃣profit: { 106.893 }
2️⃣profit: { 106.645 }
3️⃣profit: { 106.401 }
4️⃣profit: { 106.090 }
📊Check your chart before entering.
🚨Check before use to make sure there is no important news.🚨
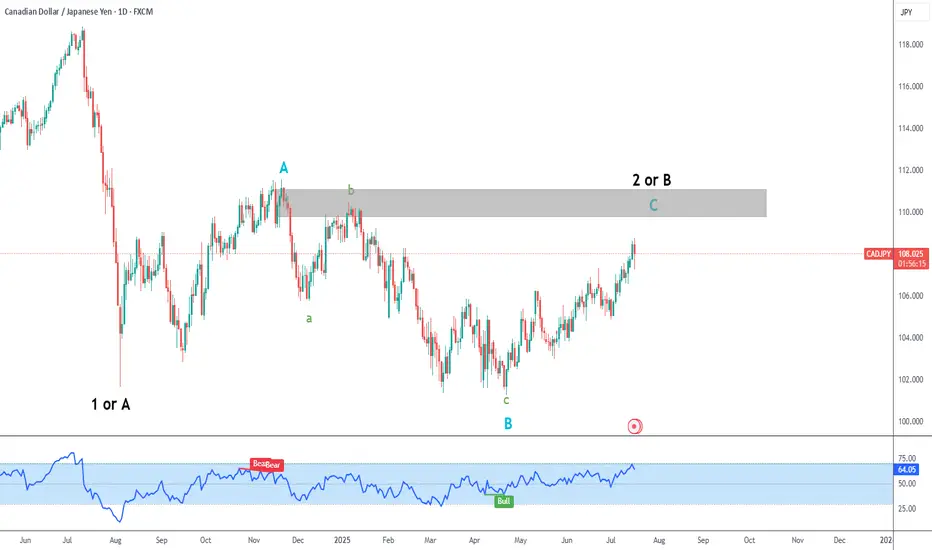
CADJPY Short-Term UpsideIn the bigger picture, the pair is currently inside black wave 2 or B, which is happening as a flat correction (blue ABC).
We should still have some upside in the short term.
The gray area is an interesting zone to begin looking for short trades.
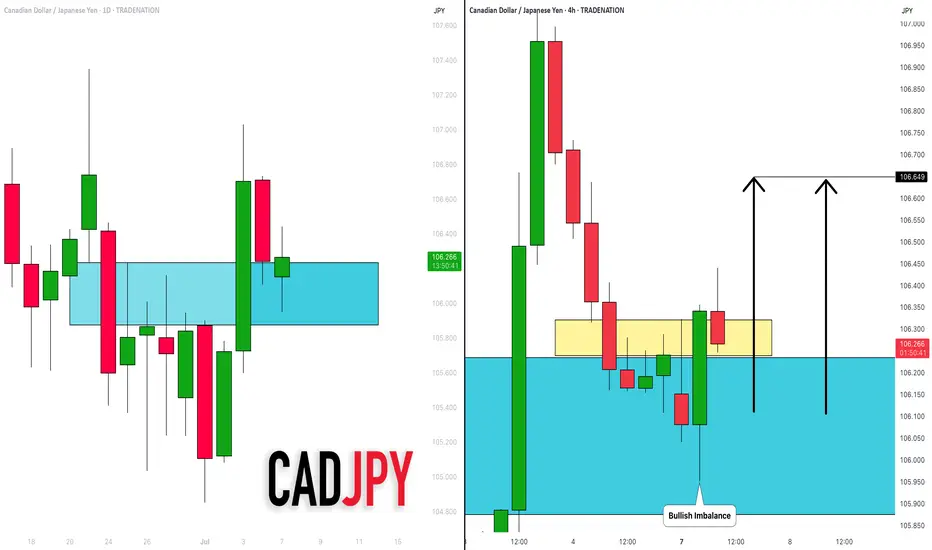
CADJPY: Bullish Move From Support Confirmed?! 🇨🇦🇯🇵
CADJPY may bounce from a key daily horizontal support cluster.
As a confirmation signal, I spotted a bullish imbalance candle
on a 4H time frame after its deep test.
I expect a pullback to 106.65
❤️Please, support my work with like, thank you!❤️
I am part of Trade Nation's Influencer program and receive a monthly fee for using their TradingView charts in my analysis.
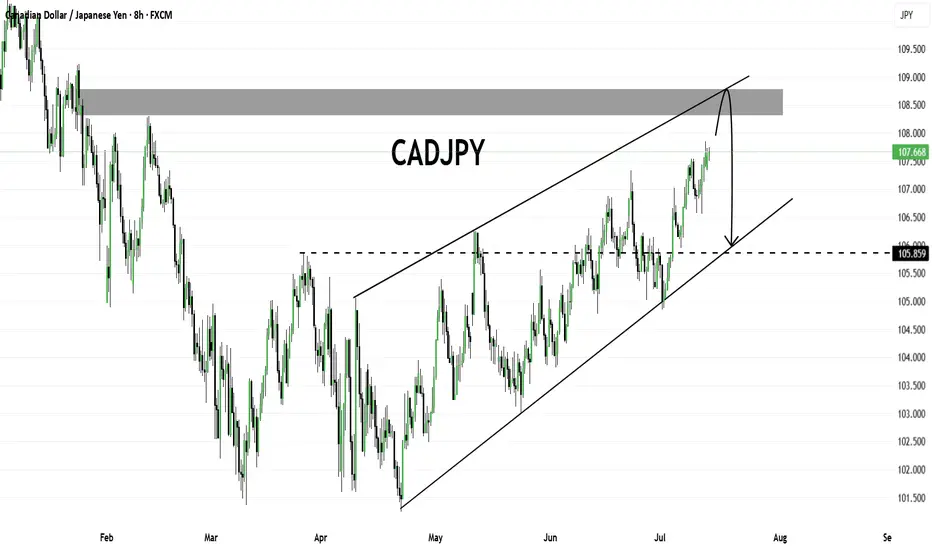
CADJPY Analysis – Bearish Rejection Expected from Key ResistanceCADJPY is currently trading within a rising wedge structure and approaching a major supply zone around the 108.300–108.700 region, which previously acted as strong resistance. Price has shown consistent upward momentum, but as it nears the upper boundary of the wedge and supply area, signs of exhaustion may appear.
A potential bearish rejection from this zone could lead to a corrective move towards the lower trendline of the wedge, aligning with the previous breakout level at 105.850, which also acts as horizontal support.
Traders should watch for bearish confirmation signals near the supply zone for a potential short opportunity, targeting the 105.850 region. A breakout above the supply zone would invalidate this bearish scenario
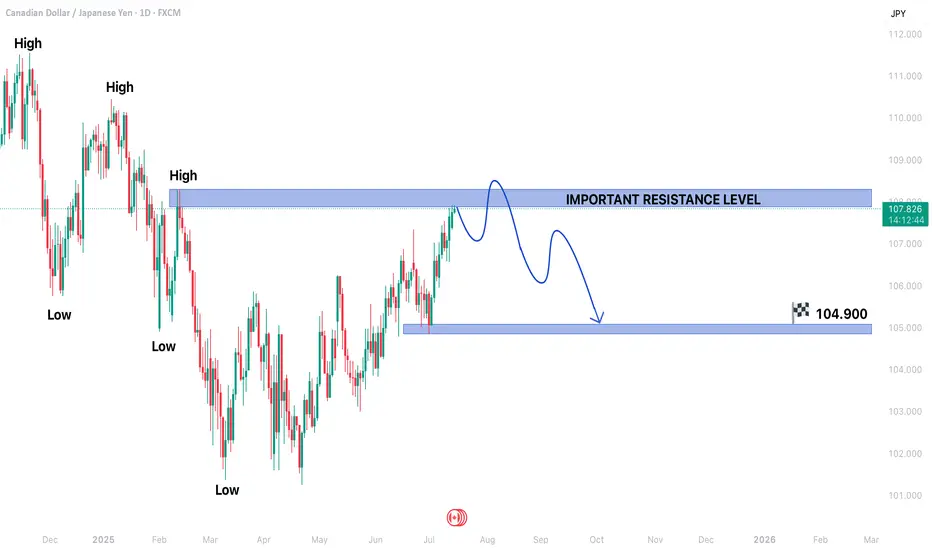
CADJPY TRADING IN A BEARISH TREND STRUCTUREThe CAD/JPY currency pair is currently exhibiting a bearish trend structure, indicating a prevailing downward momentum in its price action. At present, the pair is trading within a secondary trend near a significant resistance level, which is a critical point that could determine its next directional move. Traders and investors are closely monitoring this level as a breakout or rejection here could set the tone for future price movements.
On the lower side, if the bearish momentum continues, the price may decline toward the target of 104.900. This level could act as a key support zone, where buyers might step in to halt further losses. A break below this support could intensify selling pressure, potentially pushing the pair toward lower levels. Conversely, if the price finds stability near this support, a short-term rebound could occur, providing traders with potential buying opportunities in a corrective phase.
On the higher side, if the pair manages to overcome the current resistance, it may attempt to test the next key resistance level at 108.300. A successful breakout above this level could signal a shift in market sentiment, possibly leading to a trend reversal or a stronger corrective rally. However, given the prevailing bearish structure, any upward movement may face strong selling pressure near resistance zones, limiting upside potential.
Traders should remain cautious and watch for confirmation signals before entering positions. Key indicators such as moving averages, RSI, and MACD can provide additional insights into momentum and potential reversals. Risk management strategies, including stop-loss orders, should be employed to mitigate downside risks in case the market moves against expectations. Overall, the CAD/JPY pair remains in a bearish phase, and its next major move will depend on how it reacts to the critical resistance and support levels mentioned.
CADJPY BUY OPPORTUNITY!Price is moving well from the H1 perspective. I anticipate a massive breakout in price to make a new high. This is a follow up to a BUY idea we published earlier from the daily timeframe. A buy opportunity is envisaged from the current market price.
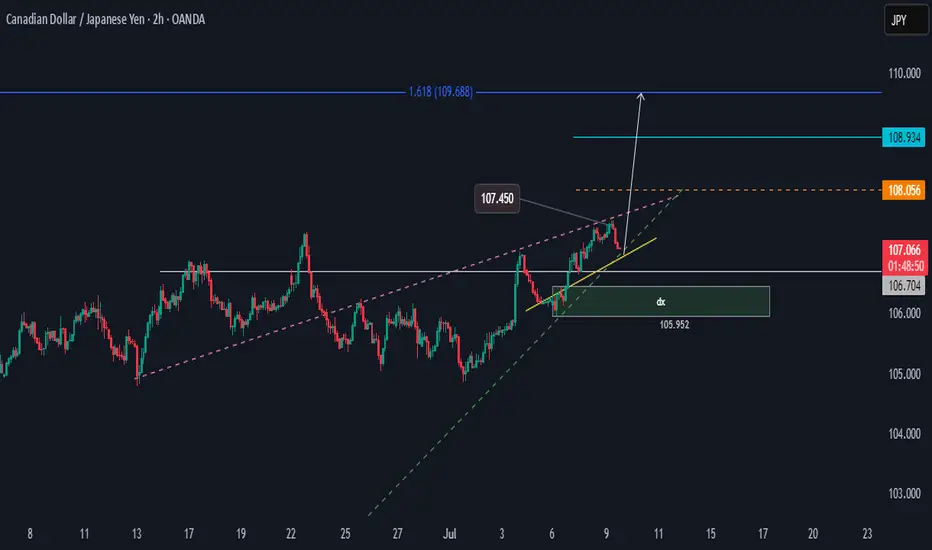
CADJPY Bullish SetupHi
CADJPY has the potential to rise above 107.450, targeting two price areas of 108.056 and 108.934 for a bias of 109.688
If the price breaks active demand (dx) and falls below 105.952, then that will signal a trend reversal.
Happy Trading,
Not trading advice
Khiwe
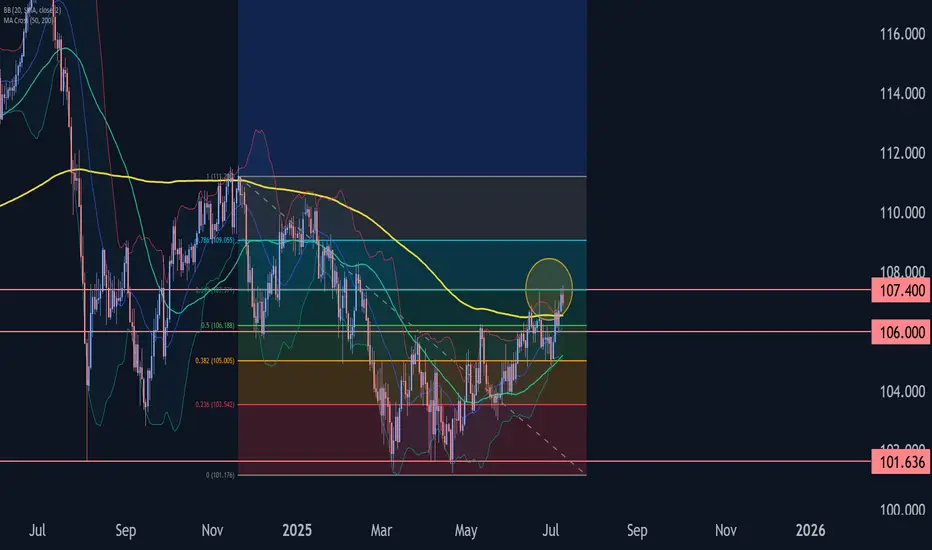
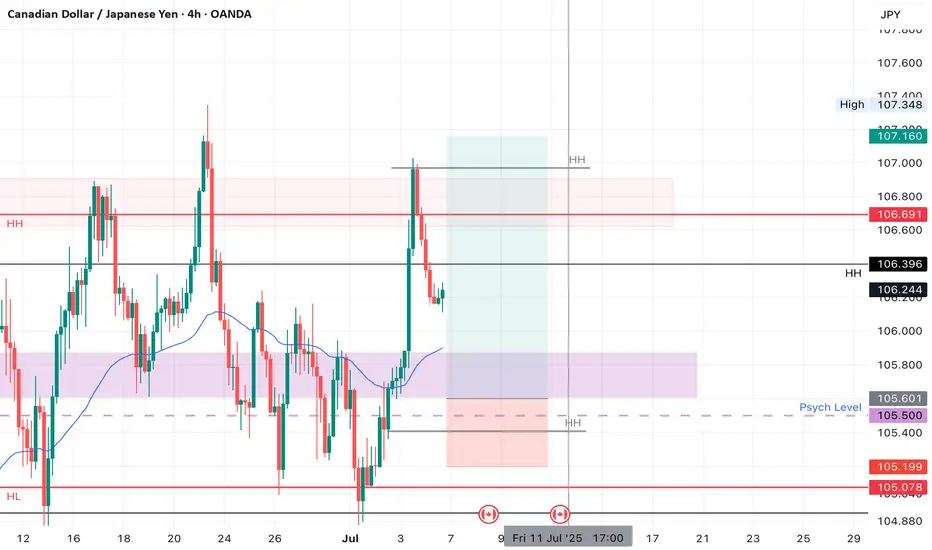
CADJPY Wave Analysis – 9 July 2025- CADJPY reversed from resistance area
- Likely to fall to support level 106.00
CADJPY currency pair recently reversed from the resistance area located between the resistance level 107.40 (former monthly high from June), upper daily Bollinger Band and the 61.8% Fibonacci correction of the downward impulse from November.
The downward reversal from this resistance area stopped the previous intermediate corrective wave (B).
Given the strength of the resistance level 107.40 and moderately bullish yen sentiment seen today, CADJPY currency pair can be expected to fall to the next support level 106.00.
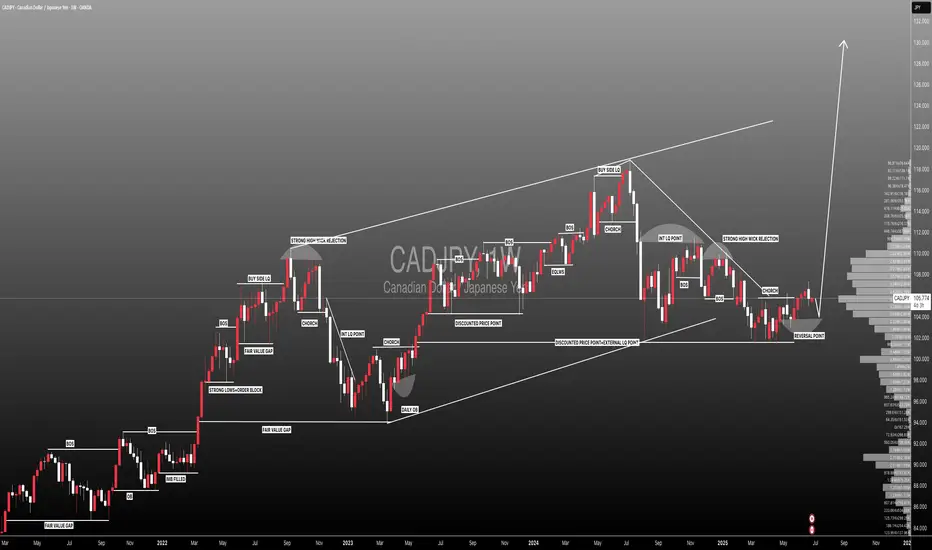
#CADJPY:Targeting 130.00 Almost 30,000 Pips Swing TradeThe long-term outlook for CADJPY remains extremely bullish in the coming week. My initial target is 115, followed by 120, and ultimately 130. This would result in a total of 30,000 pips of movement in the swing. Please use this analysis for educational purposes only.
Good luck and trade safely!
Like, comment, and share this idea!
Team Setupsfx_
❤️🚀
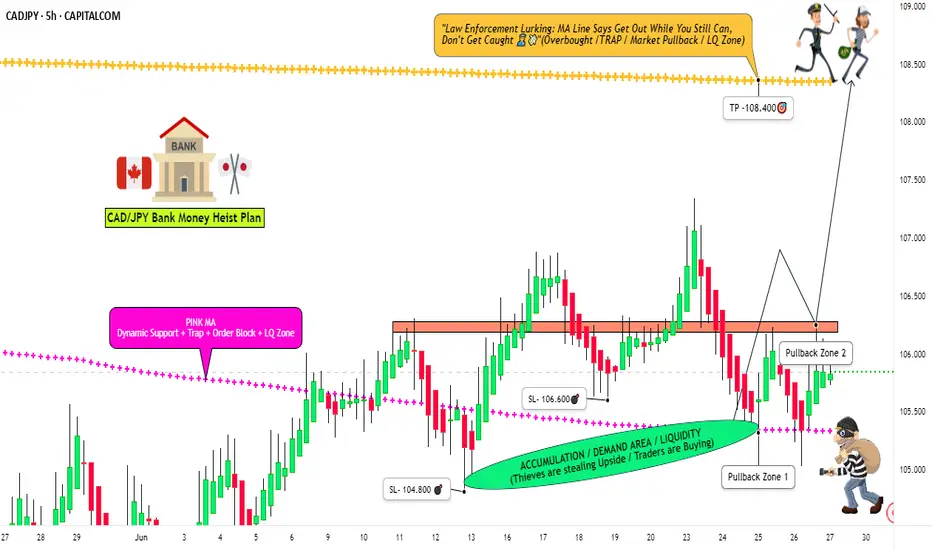
Forex Bank Job: CAD/JPY Profit Extraction Strategy🏦 "Operation Loonie Lift-Off" – CAD/JPY Forex Heist Blueprint! 💰💣
🌟Hi! Hola! Ola! Bonjour! Hallo! Marhaba!🌟
To all fellow Market Bandits & Profit Seekers, 🕶️💸💼
We’ve scoped out our next target – the CAD/JPY vault – and the blueprint is ready. This isn’t just a trade... it's a full-blown Forex infiltration mission based on undercover technical and fundamental recon 🔎📊.
🎯 The Mission Plan:
📍Entry Point – The Vault's Backdoor
💥 Strike at Pullback Zones 1 & 2
→ Use 15–30 min timeframe to ambush at recent lows or swings.
The best loot lies in waiting – buy limits only!
🛡️Stop Loss – Escape Routes
Set SL like a pro thief:
Pullback 1 ➤ 104.800
Pullback 2 ➤ 105.600
Base it on your crew’s bankroll and lot size. Always prep a clean getaway.
🏁Target – Secure the Goods
Primary loot zone: 106.000
(Or vanish before heat arrives 🚓💨)
⚔️ Scalpers’ Special Ops:
Only operate long side. Big wallets = quick hits. Small stacks? Join the swing squad and trail your SL like a shadow 🕶️🔐.
🔥Why This Hit?
CAD/JPY is in bullish mood driven by:
COT shifts 📈
Sentiment setups 🧠
Macro flow + cross-asset whispers 🔄
🚨 But remember: market conditions flip like fake IDs. Stay alert.
🧠 Final Tips from HQ:
🔕 Avoid new ops during major news drops
💣 Use trailing SLs to lock profits before the sirens go off
💖 Smash that 💥BOOST💥 to fund the next big mission
💼 From the Black Market Desks of the Thief Trading Syndicate™
This ain't your grandpa's trade plan — it's a strategic smash-and-grab with style and smarts. 📡🔐
💬 Drop a comment, hit the like, and recruit more to the crew.
📍See you in the next chart heist. Keep it stealthy, sharp, and profitable. 🤑🚀👊
CADJPY LONGMarket structure bullish on HTFs 3
Entry at both Daily and Weekly AOI
Weekly rejection at AOi
Daily Rejection at AOi
Previous Structure point Daily
Daily EMA retest
Around Psychological Level 105.500
H4 Candlestick rejection
Rejection from Previous structure
Levels 3.88
Entry 110%
REMEMBER : Trading is a Game Of Probability
: Manage Your Risk
: Be Patient
: Every Moment Is Unique
: Rinse, Wash, Repeat!
: Christ is King.
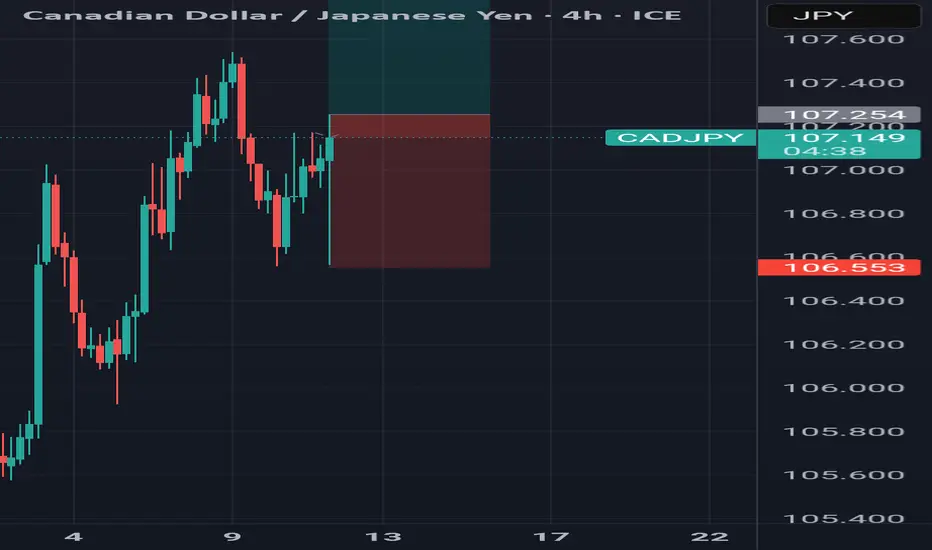
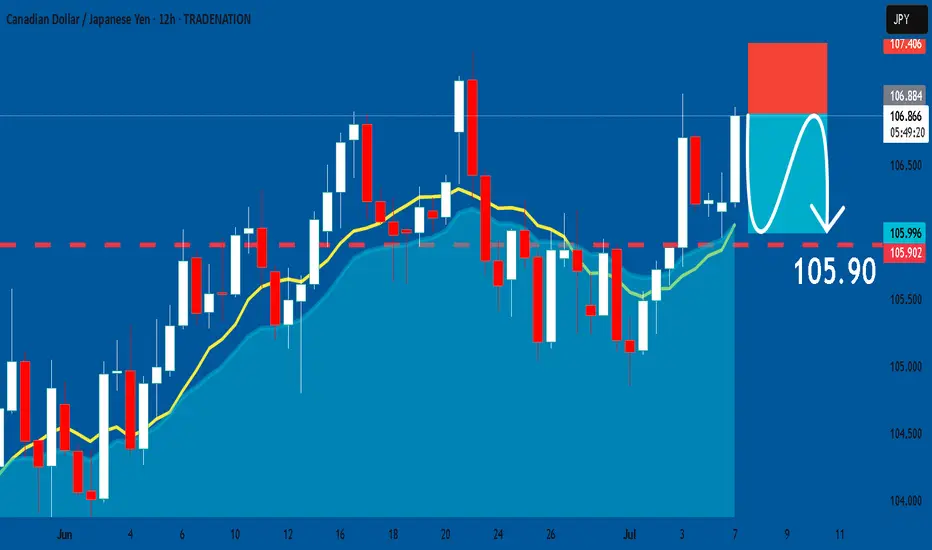
CADJPY: Short Trading Opportunity
CADJPY
- Classic bearish formation
- Our team expects fall
SUGGESTED TRADE:
Swing Trade
Sell CADJPY
Entry Level - 106.89
Sl - 107.40
Tp - 105.90
Our Risk - 1%
Start protection of your profits from lower levels
Disclosure: I am part of Trade Nation's Influencer program and receive a monthly fee for using their TradingView charts in my analysis.
❤️ Please, support our work with like & comment! ❤️
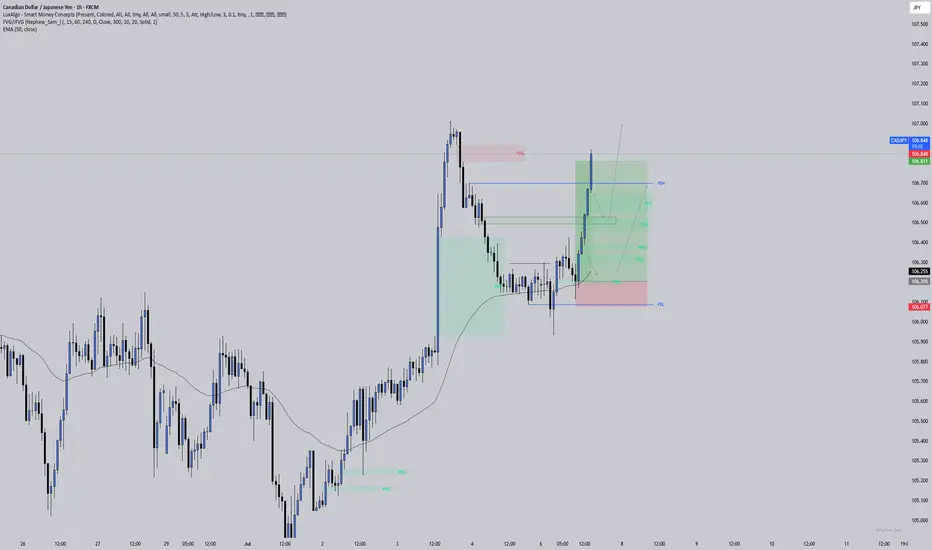
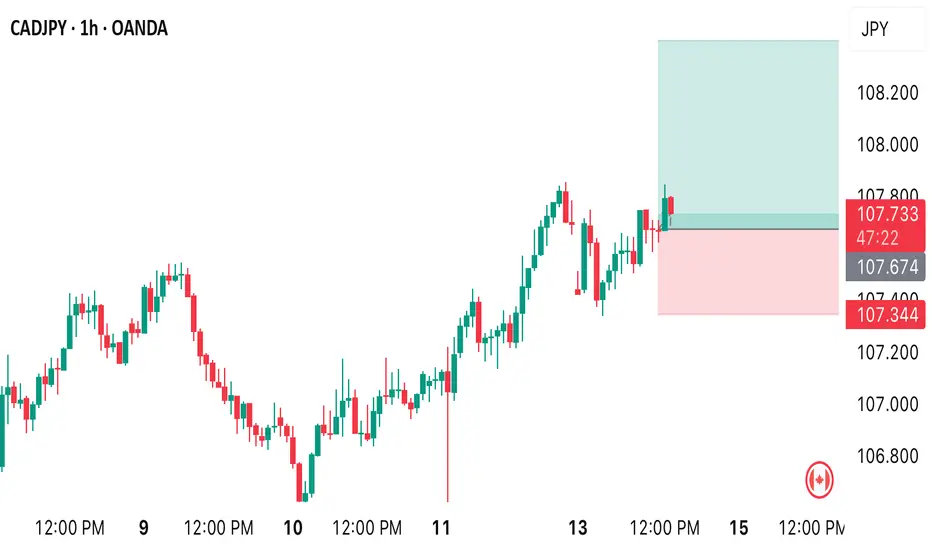
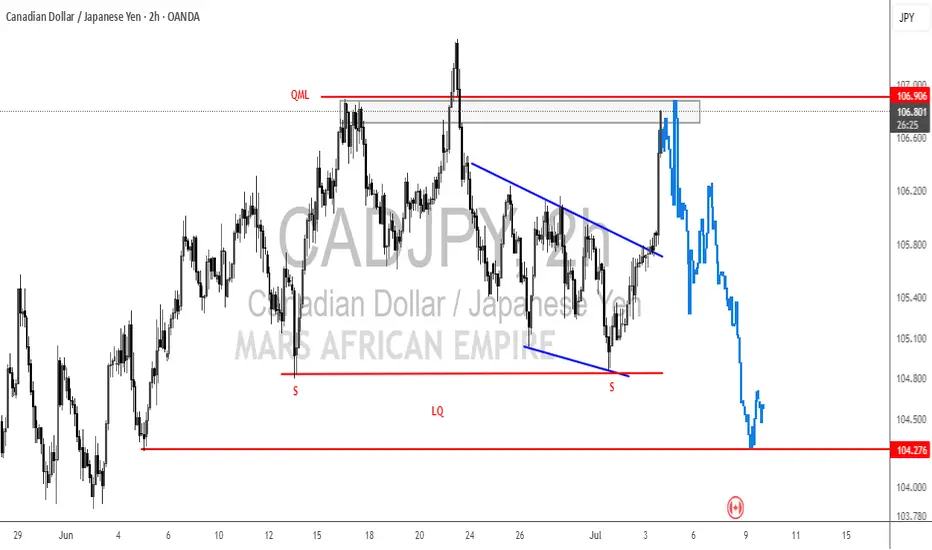
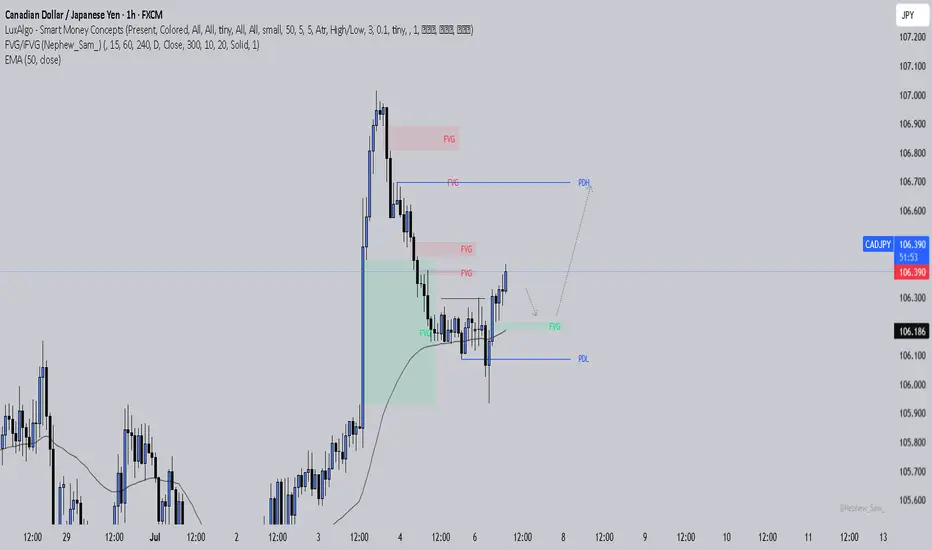
CADJPY: Is the Trap Set?Price swept the liquidity below the previous day’s low and then broke structure to the upside. That’s often a strong sign that smart money just stepped in. I’m now watching for price to pull back and fill the imbalance it left after the break. If it respects that zone, there’s a good chance we’ll see it push higher toward the previous day’s high where more liquidity is waiting.
I’ve also added the 50 EMA on this chart as an extra layer of confluence. It helps me stay aligned with the overall market direction and avoid taking trades that fight the current trend.
It’s easy to get impatient here and jump in too soon, but discipline means waiting for the story to fully unfold. Trust your levels, trust the process, and remember that protecting your mental capital is just as important as protecting your trading account.
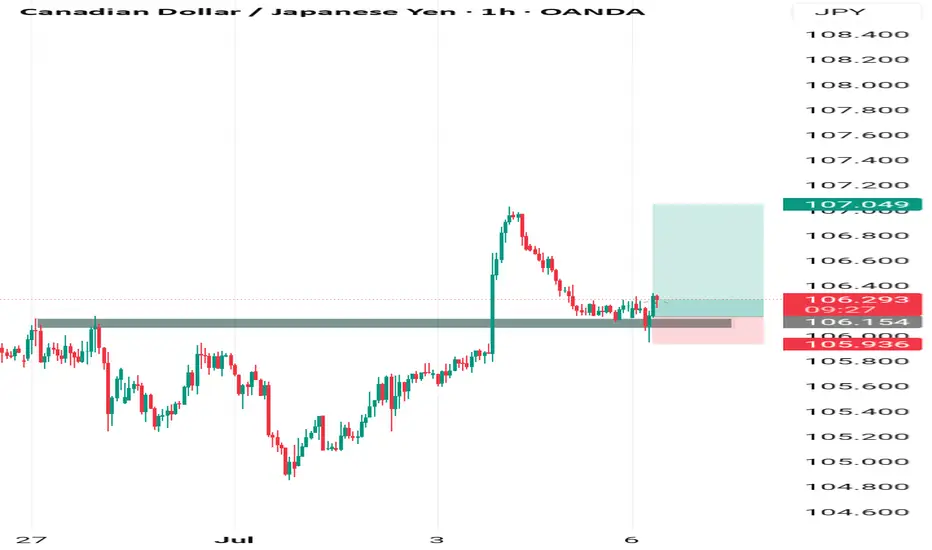
CADJPYAm seeing a buy Opportunities on cadjpy
Entry: 106.150
Stoploss: 105.900
Take profit: 107.050
Comment your opinion
For fund management contact me on X @shajudeakinoba1