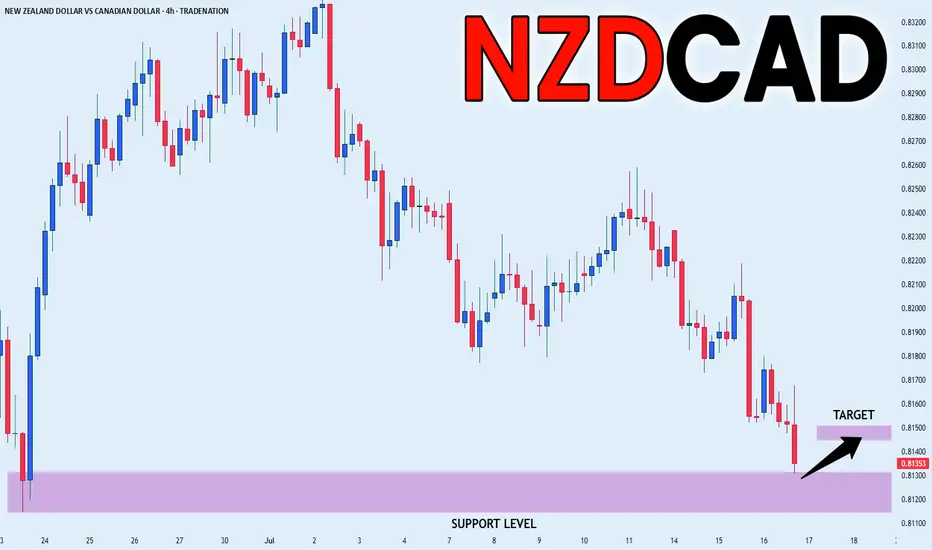
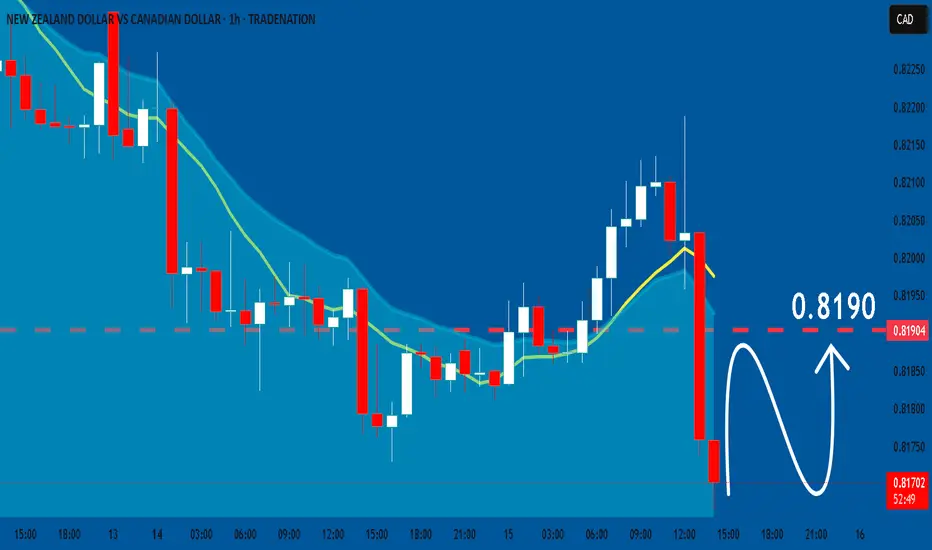
NZD_CAD POTENTIAL SHORT|
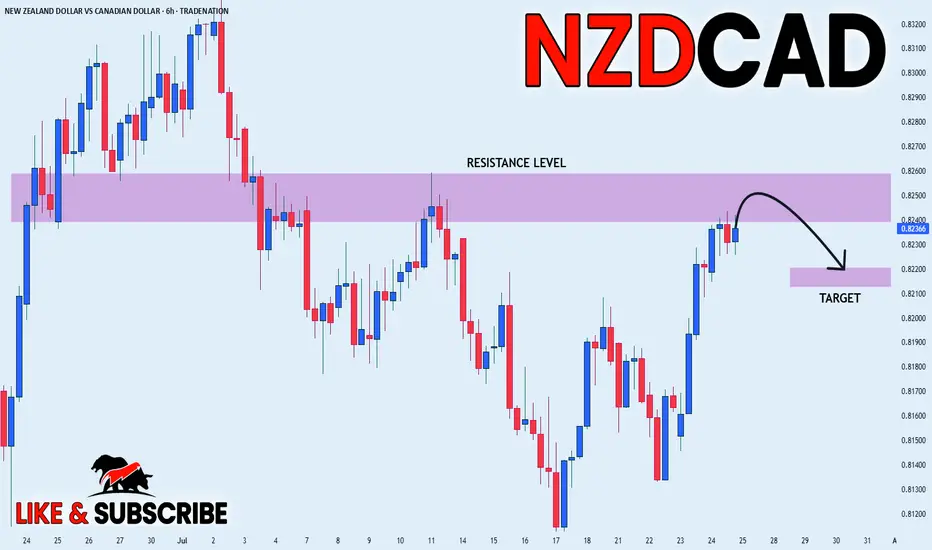
✅NZD_CAD has been growing recently
And the pair seems locally overbought
So as the pair is approaching
A horizontal resistance of 0.8260
Price decline is to be expected
SHORT🔥
✅Like and subscribe to never miss a new idea!✅
Disclosure: I am part of Trade Nation's Influencer program and receive a monthly fee for using their TradingView charts in my analysis.
CADNZD trade ideas
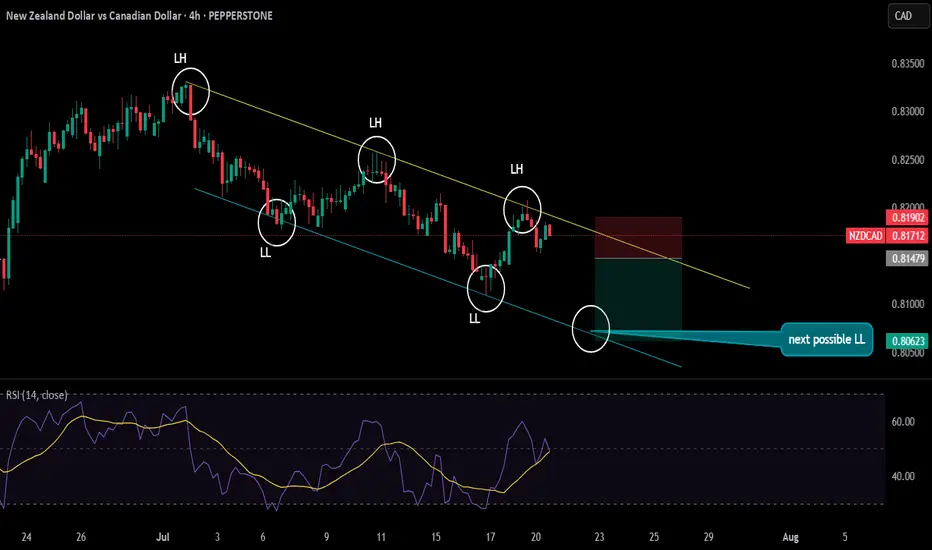
NZDCAD in bearish rallythe pair is making LHs and LLs just following DOW theory right now the price has marked its LH and now it is towards marking LL and with that a simple trade idea has been shown on the chart
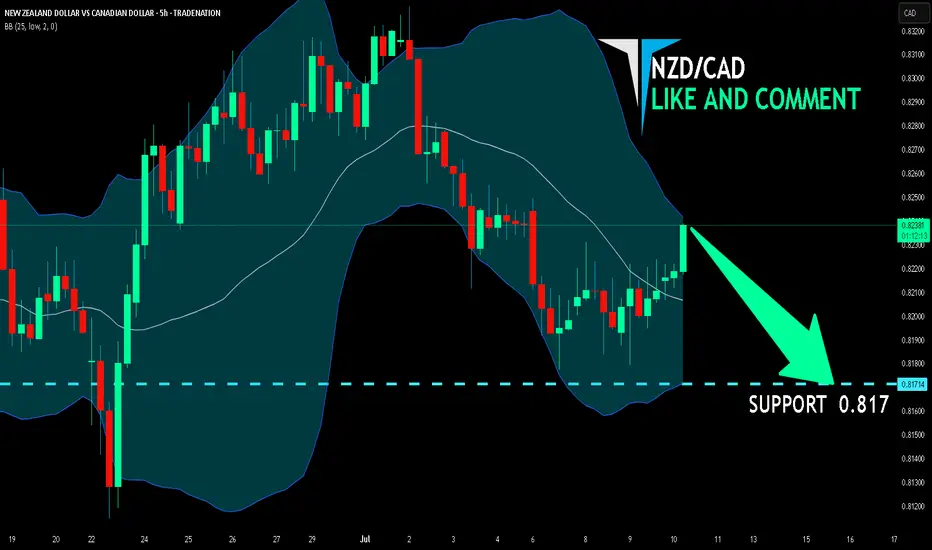
NZD/CAD SELLERS WILL DOMINATE THE MARKET|SHORT
Hello, Friends!
NZD/CAD pair is trading in a local uptrend which we know by looking at the previous 1W candle which is green. On the 5H timeframe the pair is going up too. The pair is overbought because the price is close to the upper band of the BB indicator. So we are looking to sell the pair with the upper BB line acting as resistance. The next target is 0.817 area.
Disclosure: I am part of Trade Nation's Influencer program and receive a monthly fee for using their TradingView charts in my analysis.
✅LIKE AND COMMENT MY IDEAS✅
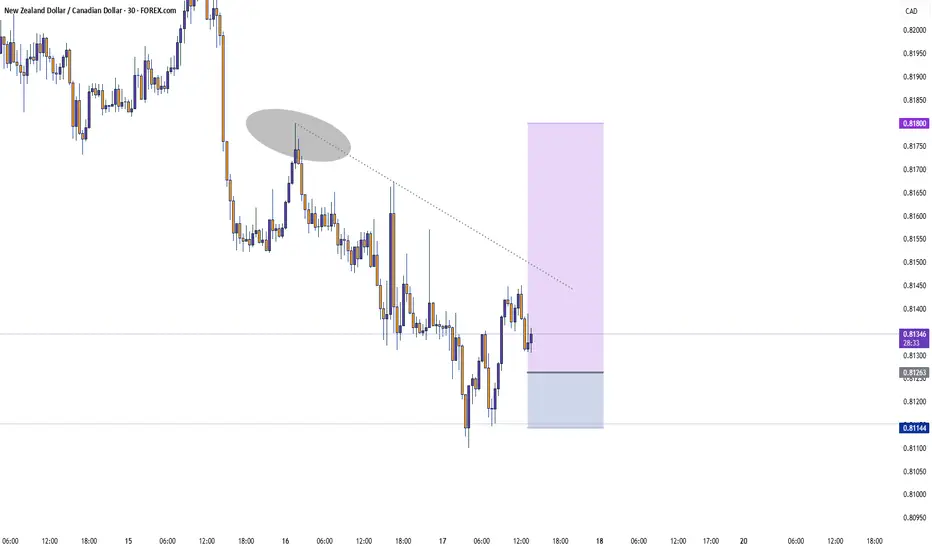
NZDCAD bearish continuatiuonPrice was consolidating in the last 2 months, now it finally broke the level and got the retest waiting for a beutiful Bearsih Engulfing 30M,1H,2H to enter this trade.
very clear trade for me this week, it has to start now the downtrend.
---
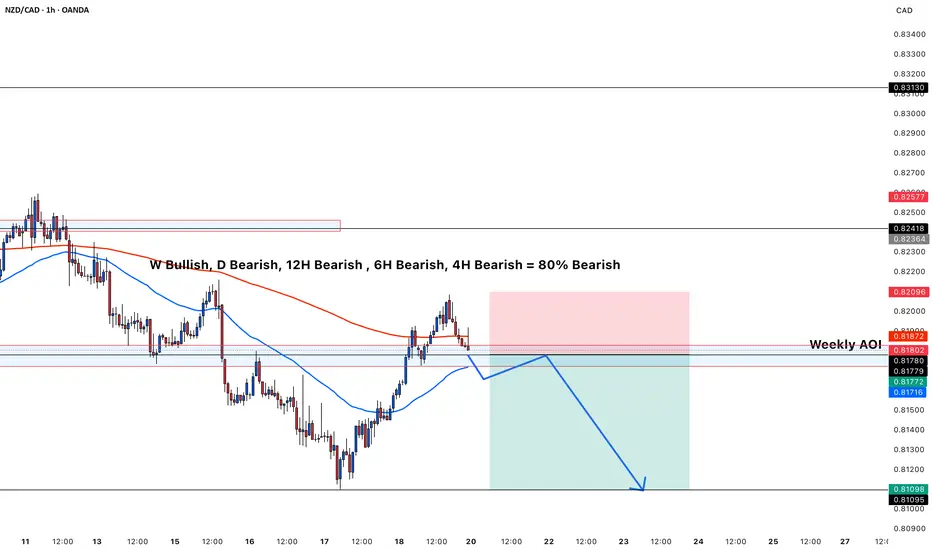
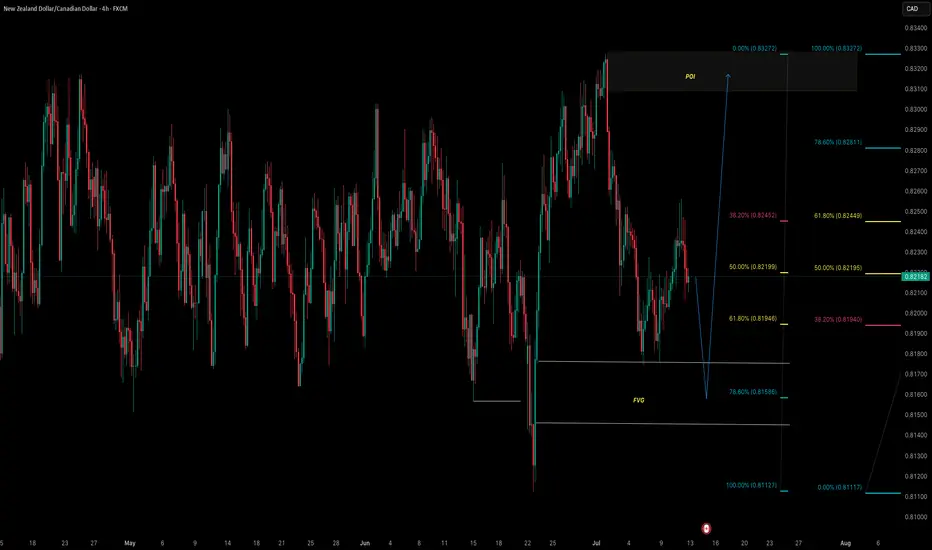
### 🔎 **Multi‑timeframe Bias**
* **Weekly:** Bullish (but higher‑timeframe bullishness often takes longer to play out; intraday moves can still be bearish).
* **Daily:** Bearish
* **12H:** Bearish
* **6H:** Bearish
* **4H:** Bearish
✅ **Result:** 80% of your major timeframes are **aligned bearish**, giving you strong confluence to look for sells rather than buys.
---
### 📉 **Structure and Price Action**
* **Market Structure:**
Price is making **lower highs and lower lows** on the 4H and 1H timeframes, which confirms a **downtrend** in the short/medium term.
* **Current Zone:**
Price is currently reacting from a **Weekly Area of Interest (AOI)**, a previous support now acting as resistance.
* **Bearish Rejection:**
The recent move up into the AOI has been rejected, shown by the price failing to break above the resistance zone and starting to turn down.
---
### 📊 **Moving Averages**
* **50 EMA (blue) is below the 200 EMA (red):** classic bearish alignment.
* Price is currently **under the 200 EMA** and testing the 50 EMA from above — if it breaks back below, this often signals momentum returning to the downside.
---
### 📐 **Risk‑Reward and Setup**
* You’ve marked a **short entry** from the AOI, with:
* **Stop Loss** above the resistance zone (red area)
* **Take Profit** targeting lower liquidity levels (green area near 0.8110)
* The projected move matches the dominant trend direction, increasing probability.
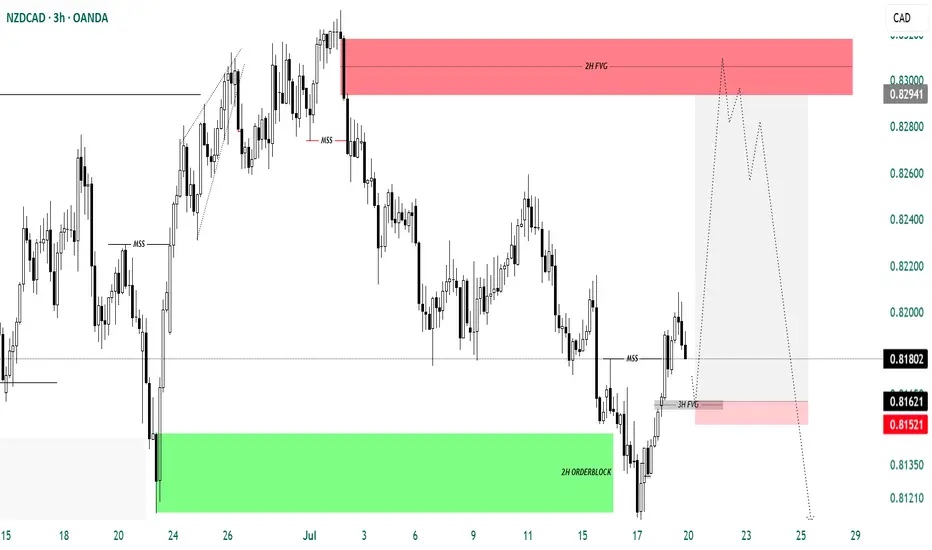
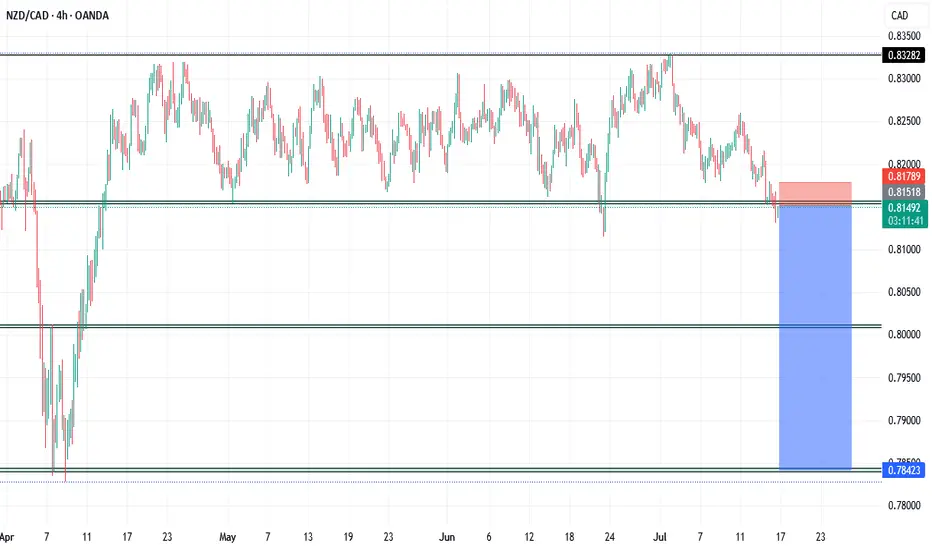
NZD/CADNZD/CAD Has Retraced Into My 2h/4h Orderblock And Made A Market Structure Shift To The Upside For A Possible Move Higher Towards The Higher Timeframe Fair Value Gap. I Will Look For Longs Form This Zone And Then Wait For A Market Structure Shift To The Downside To Look For Short Entries To My Daily OrderBlock Which Sits Between 0.79705 - 0.78667. Once There I Will Look For Long Positions.
Trade Carefully HK
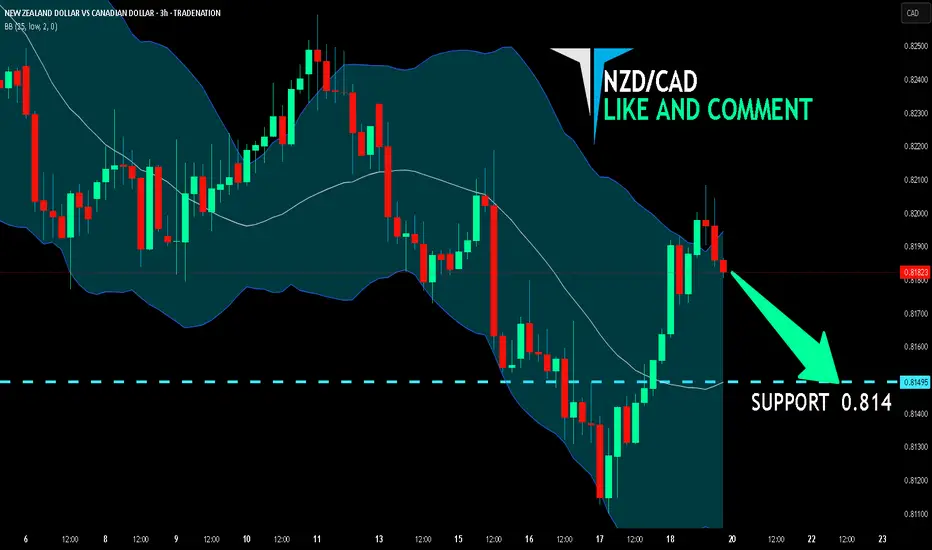
NZD/CAD BEARS ARE GAINING STRENGTH|SHORT
Hello, Friends!
NZD/CAD is trending down which is obvious from the red colour of the previous weekly candle. However, the price has locally surged into the overbought territory. Which can be told from its proximity to the BB upper band. Which presents a great trend following opportunity for a short trade from the resistance line above towards the demand level of 0.814.
Disclosure: I am part of Trade Nation's Influencer program and receive a monthly fee for using their TradingView charts in my analysis.
✅LIKE AND COMMENT MY IDEAS✅
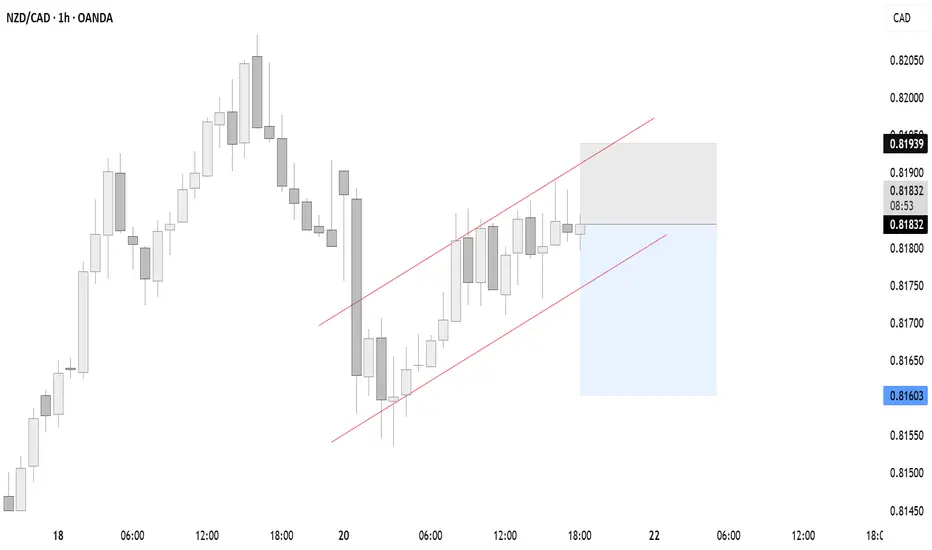
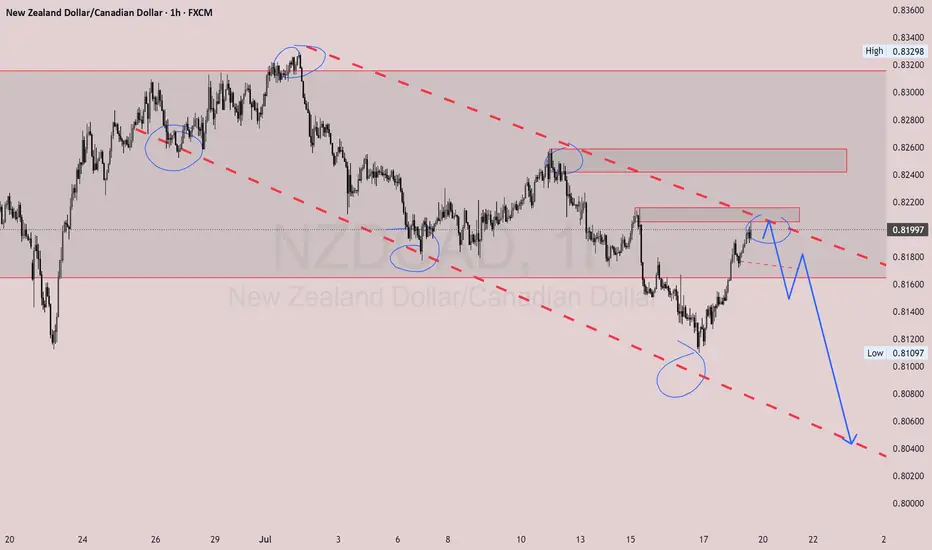
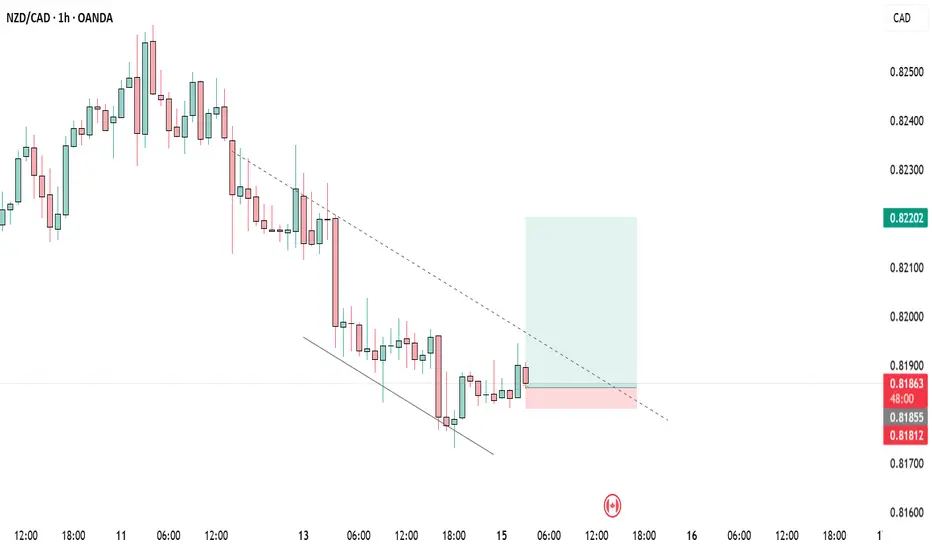
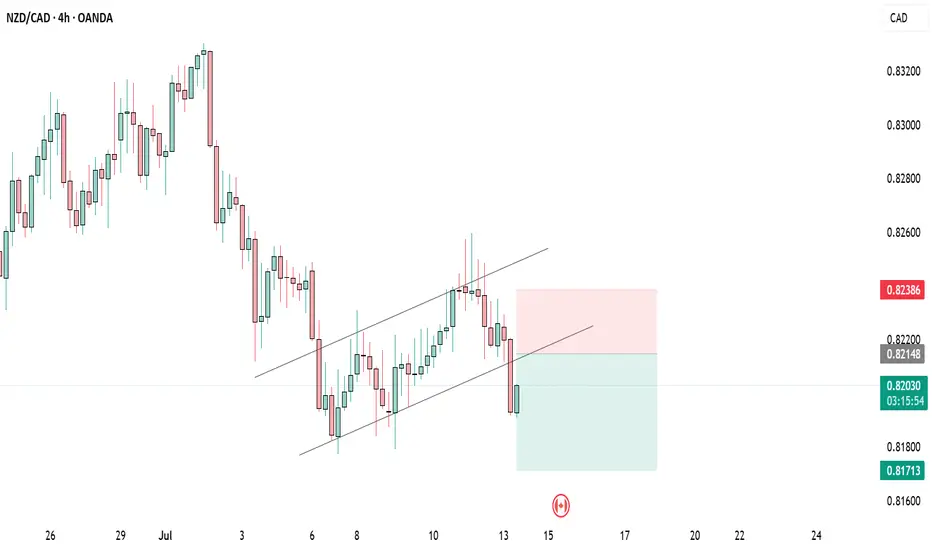
NZDCADThis is a 1-hour chart of NZDCAD, and you’ve clearly marked a descending channel with multiple respected touches on both trendlines — showing clean market structure.
Analysis:
- Price is approaching the upper boundary of the descending channel again.
- There’s a potential supply zone just above current price.
- The blue projection suggests a possible rejection from that upper zone, continuing the overall bearish trend.
- Repeated reactions at the channel edges signal strong technical respect.
What to Do Next:
- Wait for bearish confirmation (e.g. rejection wick, bearish engulfing) at the upper trendline/supply zone.
- If confirmed, enter a sell trade with targets toward the lower boundary of the channel.
- Place stop-loss just above the supply zone or last swing high.
Suggested Caption for Social Media:
"NZDCAD playing beautifully within this descending channel. Watching closely for a bearish reaction at this key zone. Patience is power in trading. Let the market speak. 📉🔥 #ForexAnalysis #NZDCAD #PriceAction #SmartTrading"
Let me know if you want it in a more casual or motivational tone.
BuyRejection Level
Daily Volume
Market Structure Shift
London Session
Trend Line Break
Untapped Order Point
NZDCAD SHORTThe Price of the New Zealand Dollar to the Canadian Dollar, has been in a downtrend for the month of July, and the canadian dollar is having a strong index for this month, after the break and retest of the daily zone to the downside,my bias is a short.
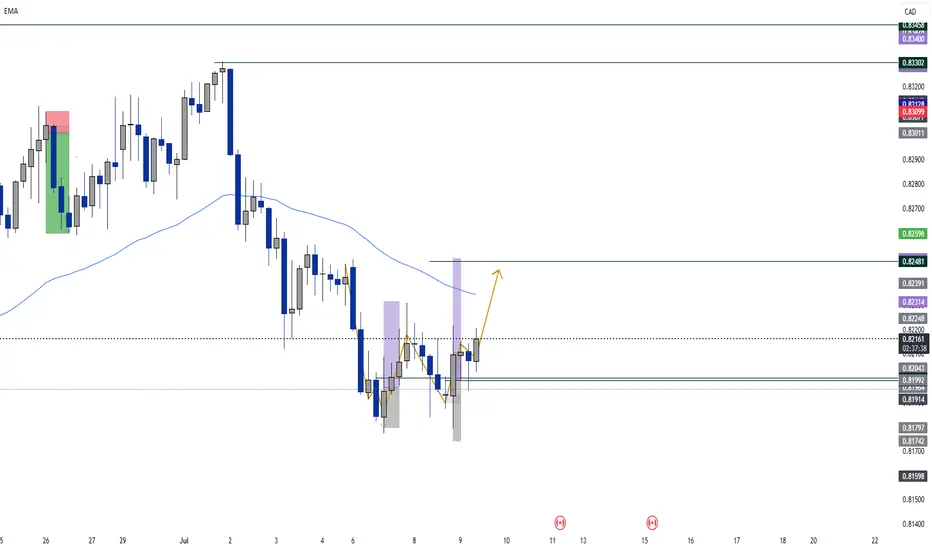
NZD_CAD LOCAL LONG|
✅NZD_CAD is set to retest a
Strong support level below at 0.8114
After trading in a local downtrend for some time
Which makes a bullish rebound a likely scenario
With the target being a local resistance above at 0.8145
LONG🚀
✅Like and subscribe to never miss a new idea!✅
Disclosure: I am part of Trade Nation's Influencer program and receive a monthly fee for using their TradingView charts in my analysis.
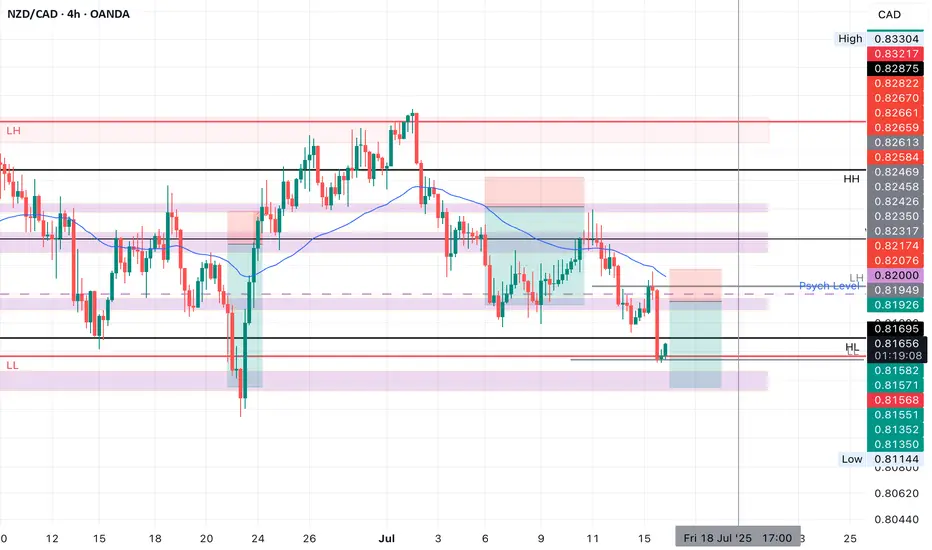
NZDCAD SHORT Market structure bearish on HTFs DH
Entry at both Weekly and Daily AOi
Weekly Rejection at AOi
Daily Rejection at AOi
Previous Structure point Daily
Around Psychological Level 0.82000
H4 EMA retest
H4 Candlestick rejection
Rejection from Previous structure
Levels 2.66
Entry 100%
REMEMBER : Trading is a Game Of Probability
: Manage Your Risk
: Be Patient
: Every Moment Is Unique
: Rinse, Wash, Repeat!
: Christ is King.
Bearish continuation?NZD/CAD is rising towards the pivot and could drop to the 1st support.
Pivot: 0.81773
1st Support: 0.81235
1st Resistance: 0.82162
Risk Warning:
Trading Forex and CFDs carries a high level of risk to your capital and you should only trade with money you can afford to lose. Trading Forex and CFDs may not be suitable for all investors, so please ensure that you fully understand the risks involved and seek independent advice if necessary.
Disclaimer:
The above opinions given constitute general market commentary, and do not constitute the opinion or advice of IC Markets or any form of personal or investment advice.
Any opinions, news, research, analyses, prices, other information, or links to third-party sites contained on this website are provided on an "as-is" basis, are intended only to be informative, is not an advice nor a recommendation, nor research, or a record of our trading prices, or an offer of, or solicitation for a transaction in any financial instrument and thus should not be treated as such. The information provided does not involve any specific investment objectives, financial situation and needs of any specific person who may receive it. Please be aware, that past performance is not a reliable indicator of future performance and/or results. Past Performance or Forward-looking scenarios based upon the reasonable beliefs of the third-party provider are not a guarantee of future performance. Actual results may differ materially from those anticipated in forward-looking or past performance statements. IC Markets makes no representation or warranty and assumes no liability as to the accuracy or completeness of the information provided, nor any loss arising from any investment based on a recommendation, forecast or any information supplied by any third-party.

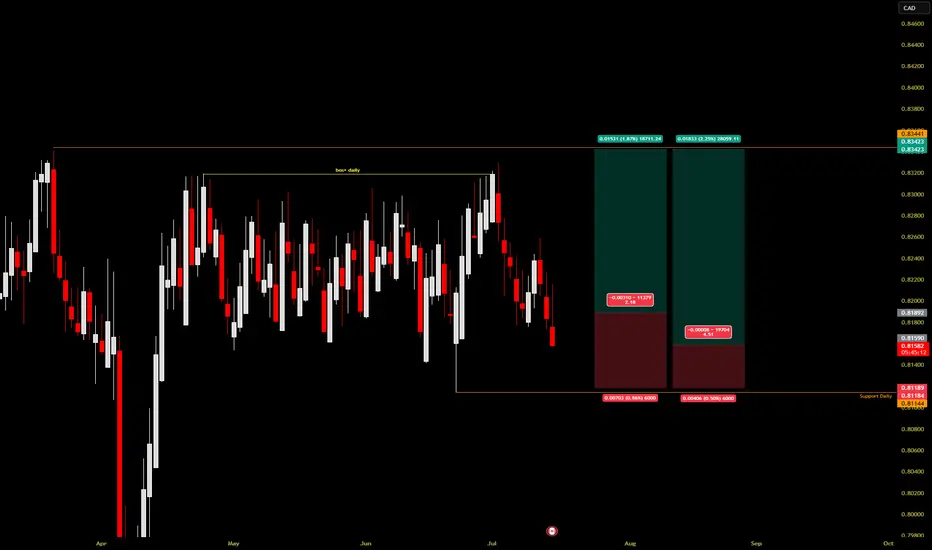
BULLISH COT DATA last friday for NZDCADLast week COT data is bullish for NZDCAD
Daily Support is at 0.812
0.812 is the origin of the Daily bullish move
That broke 0.832 resistance, creating a higher high.
Target is 0.834
This is a swing trade.
NZDCAD: Will Start Growing! Here is Why:
Our strategy, polished by years of trial and error has helped us identify what seems to be a great trading opportunity and we are here to share it with you as the time is ripe for us to buy NZDCAD.
Disclosure: I am part of Trade Nation's Influencer program and receive a monthly fee for using their TradingView charts in my analysis.
❤️ Please, support our work with like & comment! ❤️
BUY NZDCADNZDCAD price looking to recover yesterday's loss. A falling channel pattern seems complete an ready to break to the upside. Buy
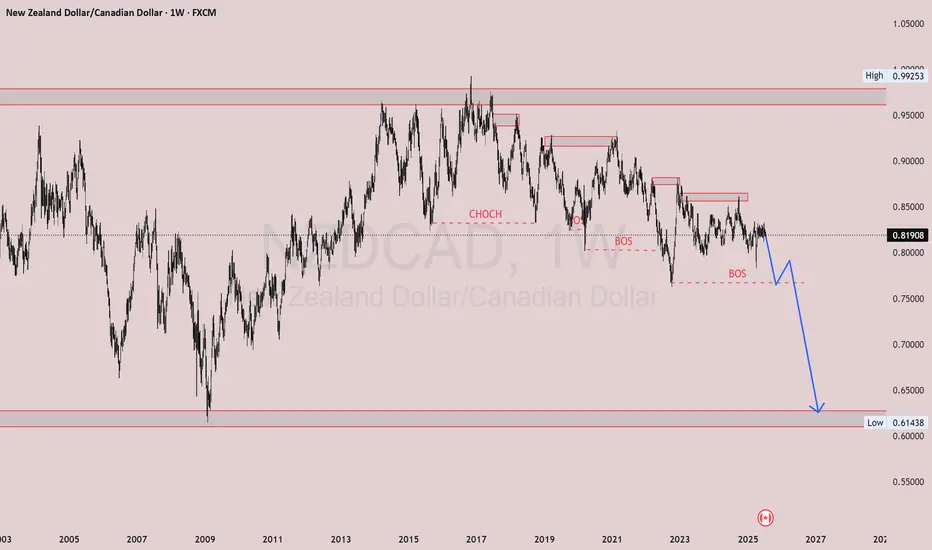
NZDCAD Weekly NZDCAD Weekly Outlook 🔍📉
After a clean CHoCH, price has continued forming lower highs and lower lows, confirming the bearish trend. We've now had multiple BOS, and price is respecting supply zones.
The chart shows a strong potential for a further drop, especially if the current structure fails to hold. Expecting price to continue down to the next major demand zone marked on the chart.
Bias: Bearish
Plan: Watching for a pullback into supply, then continuation to the downside.
This is a classic example of structure leading direction. Stay patient, wait for confirmations. 📊
---
You can also say:
"Smart money never rushes. Structure first, entry second. Let’s see how NZDCAD plays out."
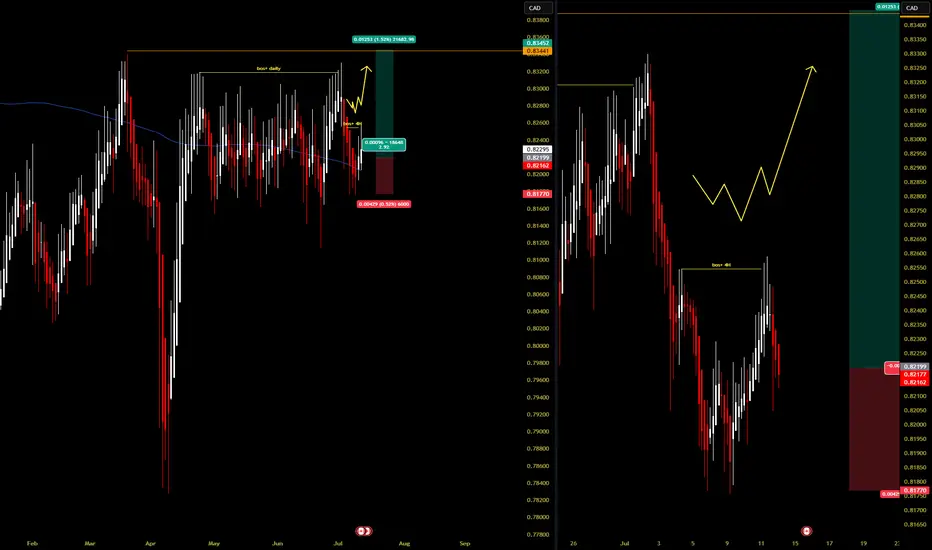
[LONG] NZDCAD Daily bullish. 4H shifted bullish gears signal BUYCOT data suggests institutions are buying NZD less than CAD by the COT Friday release.
Marked on the daily chart, a bullish break of structure.
If we look at 4H timeframe, an internal bullish structure happened last Friday. This can be a signal that the Daily correction/pullback is done.
An internal bullish shift of structure is a confirmation that price may now continue its DAILY bullish move targeting the highs at 0.83441
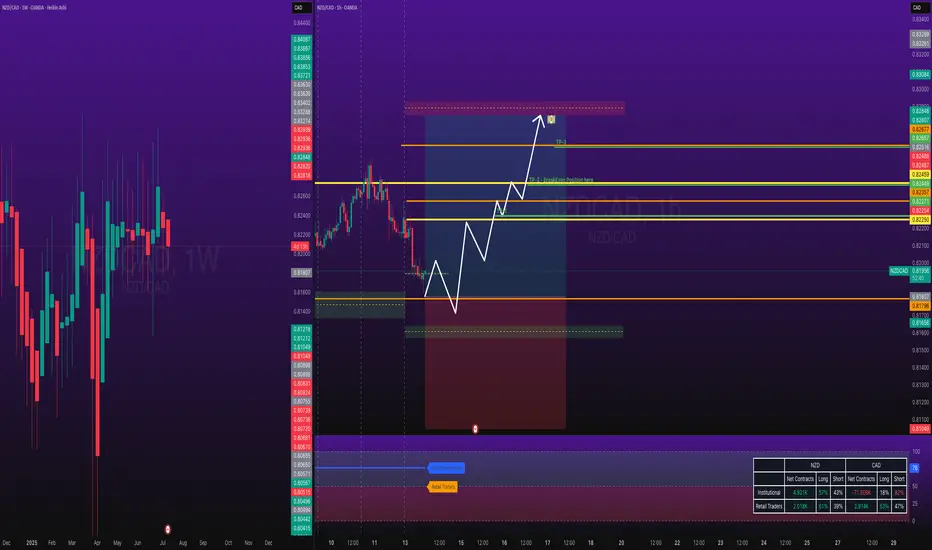
NZDCAD Long Trade 1:1.37 OANDA:NZDCAD Long Trade, with my back testing of this strategy, it hits multiple possible take profits, manage your position accordingly.
Institutions are Bullish, price is at good support, buying pressure is good also.
Risking 1% to make 1.37%
Note: Manage your risk yourself, its risky trade, see how much your can risk yourself on this trade.
Use proper risk management
Looks like good trade.
Lets monitor.
Use proper risk management.
Disclaimer: only idea, not advice
NZDCAD ShortsNZDCAD will trigger a bearish move the the next coming hours. A bearish flag pattern confirms this move.
Idea on a chartTrump letter 35% tariff on Canada. Trump has hit Canada very nard with a 35% tariff rate.
Trump says will send tariff letters informing EU, Canada of the rates by Friday
Trump's letter to Canada - The Canada dollar has fallen sharply with Trump's 35% tariff rate on the country
The US dollar has jumped higher with 'risk' getting slammed.
The Canadian dollar a notable slide:
NZD/CAD THIEF TRADING ALERT: Bullish Loot Ahead – Are You In?🔥 NZD/CAD Heist: Bullish Loot Ahead! 🏴☠️💰
🌟 Greetings, Market Pirates! 🌟
Hola! Oi! Bonjour! Hallo! Marhaba! 🚀
💸 The Master Plan:
Based on Thief Trading tactics (technical + fundamental analysis), we’re plotting a bullish heist on NZD/CAD ("Kiwi vs Loonie"). The vault is open—time to swipe the loot!
📈 Entry (Long Only):
Buy Limit Orders preferred (15-30min TF for pullbacks).
Aggressive? Enter anytime—just stick to the strategy!
🛑 Stop Loss (Protect Your Loot!):
Nearest swing low (4H TF) → 0.81500 (adjust based on risk & lot size).
Scalpers? Use trailing SL to lock profits!
🎯 Take Profit (Escape Before Cops Arrive!):
Primary Target: 0.83800 (or exit earlier if momentum fades).
⚠️ Warning (High Risk!):
Overbought? Yes. Bear traps? Likely.
Consolidation zone → trend reversal risk!
News releases? Avoid new trades—hedge or trail stops!
📊 Market Context:
Neutral trend (bullish bias forming 🐂).
Check: COT reports, macro trends, sentiment & intermarket signals BEFORE executing! 🔍 (go ahead to read 🔗🌏).
💥 Boost This Idea!
Hit 👍 LIKE & 🔔 FOLLOW to support the Thief Trading crew! More heists coming soon—stay tuned! 🚀
🚨 Reminder: Trade responsibly. This is NOT financial advice—just a risky, high-reward play. Manage your risk or get rekt!

NZDCAD Bullish 15 min ICT 15 minute Entry:
1. Sell - side liquidity swept.
2. BOS up onM15 confirm shift.
3. Entry from bullish OB or FVG after pullback.
4. SL below liquidity sweep.
5. TP internal high/TP2 premium zone.