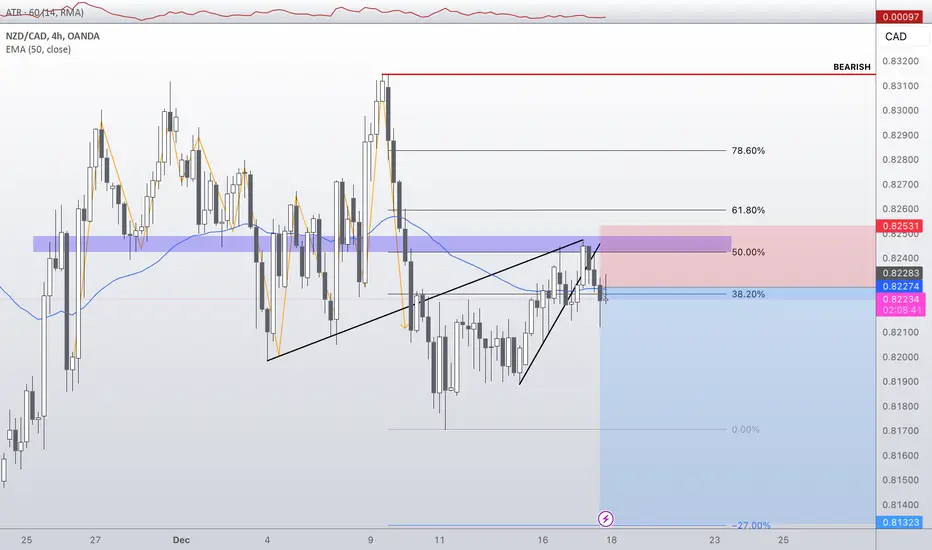
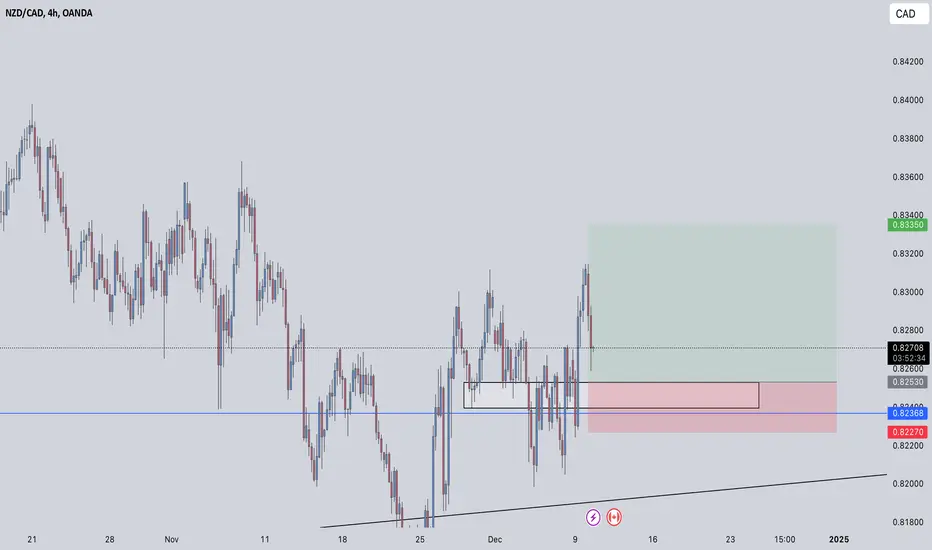
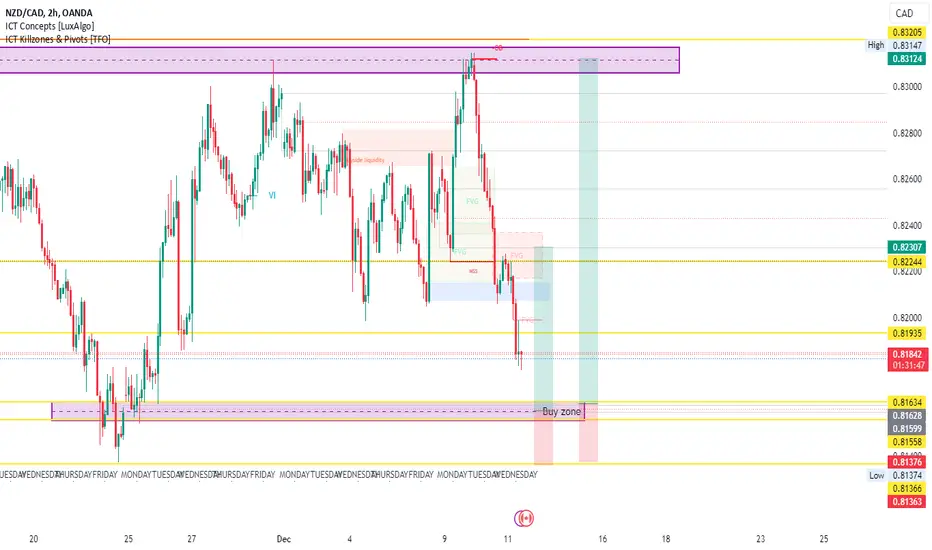
KIWICAD SHORTSLooking to aim lower for NZDCAD.
Confluences:
- 50 fib
- H4 SNR
- Break of H1 Trendline
- H4 Break and Retest of Trendline
- 50 EMA (Price pierced through a little but ultimately looks like it's rejecting)
- H4 Double top
End of Year trade so could be a 50/50 toss up but all signs point downwards, so lets see how this plays out.
CADNZD trade ideas
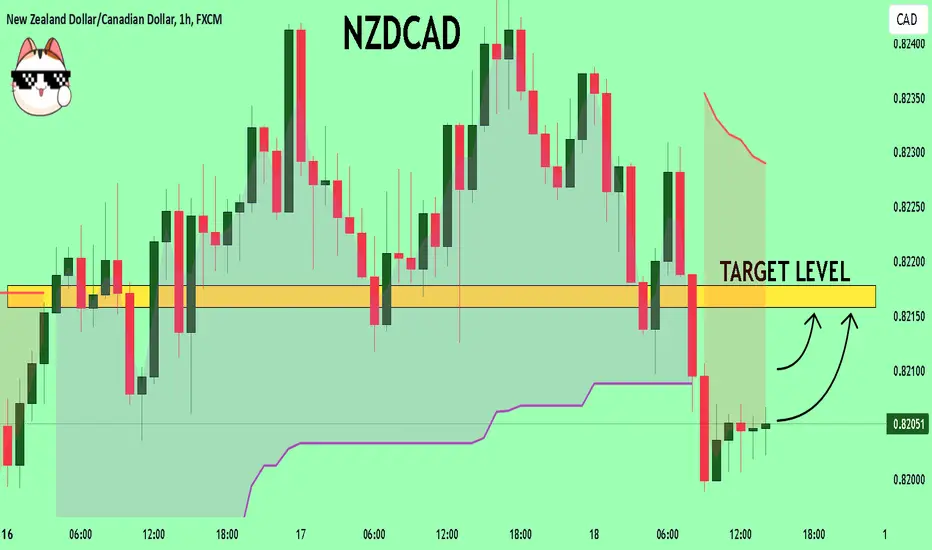
NZDCAD Sellers In Panic! BUY!
My dear friends,
NZDCAD looks like it will make a good move, and here are the details:
The market is trading on 0.8205 pivot level.
Bias - Bullish
Technical Indicators: Supper Trend generates a clear long signal while Pivot Point HL is currently determining the overall Bullish trend of the market.
Goal - 0.8215
About Used Indicators:
Pivot points are a great way to identify areas of support and resistance, but they work best when combined with other kinds of technical analysis
———————————
WISH YOU ALL LUCK
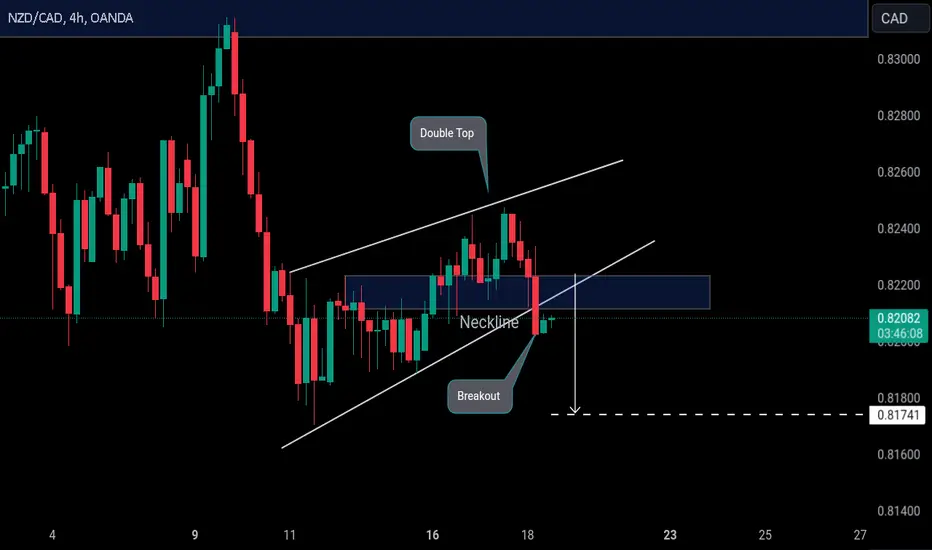
NZDCAD: Bearish Continuation Confirmed? 📉 NZDCAD Update
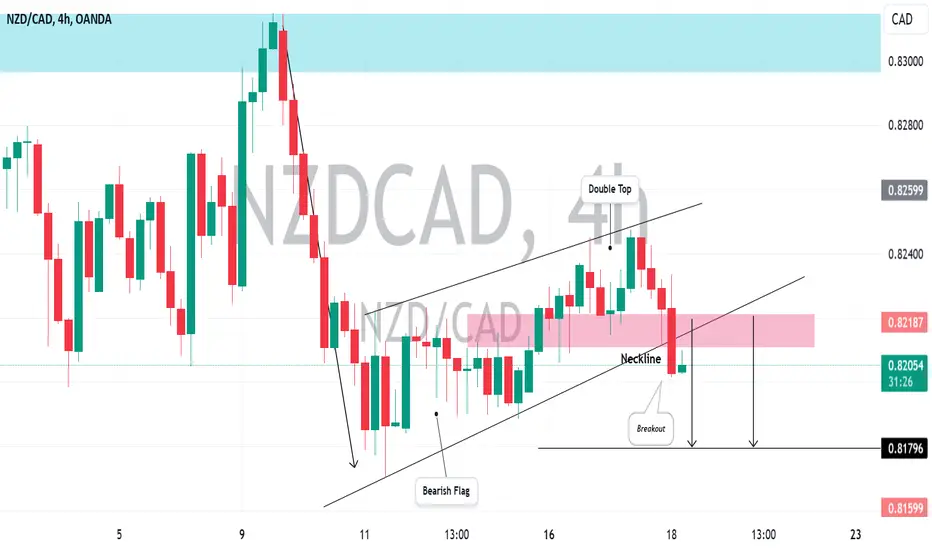
Two major bearish patterns have developed on the 4-hour chart: a bearish flag and a double top formation.
Both the neckline of the double top and the support level of the flag have been broken.
A further decline is likely following a potential retest of these broken levels, with the next support target at 0.8179.
NZDCAD: Bearish Continuation Now Confirmed?!The 📉NZDCAD has formed two significant bearish patterns on the 4-hour chart. I see a bearish flag pattern alongside a double top formation.
The neckline of the double top and the flag's support level have both been violated.
I anticipate that the market could decline further after a retest of these broken levels.
The next support level is at 0.8179.
Bullish Pressure on NZDCADNZDCAD is trending bullish on the 2h timeframe and the 4h timeframe so the fact that they are in sync already provides some confidence in the direction. In addition, we just broke a high on 4H and are retesting demand zones on both the 4H and the 2H.
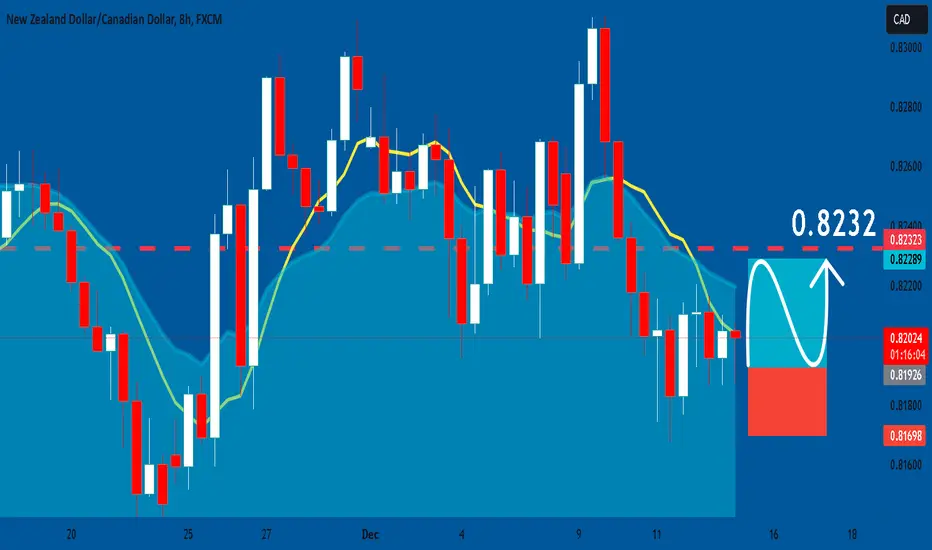
NZDCAD On The Rise! BUY!
My dear friends,
Please, find my technical outlook for NZDCAD below:
The price is coiling around a solid key level - 0.8192
Bias - Bullish
Technical Indicators: Pivot Points Low anticipates a potential price reversal.
Super trend shows a clear buy, giving a perfect indicators' convergence.
Goal - 0.8231
Safe Stop Loss - 0.8171
About Used Indicators:
The pivot point itself is simply the average of the high, low and closing prices from the previous trading day.
———————————
WISH YOU ALL LUCK
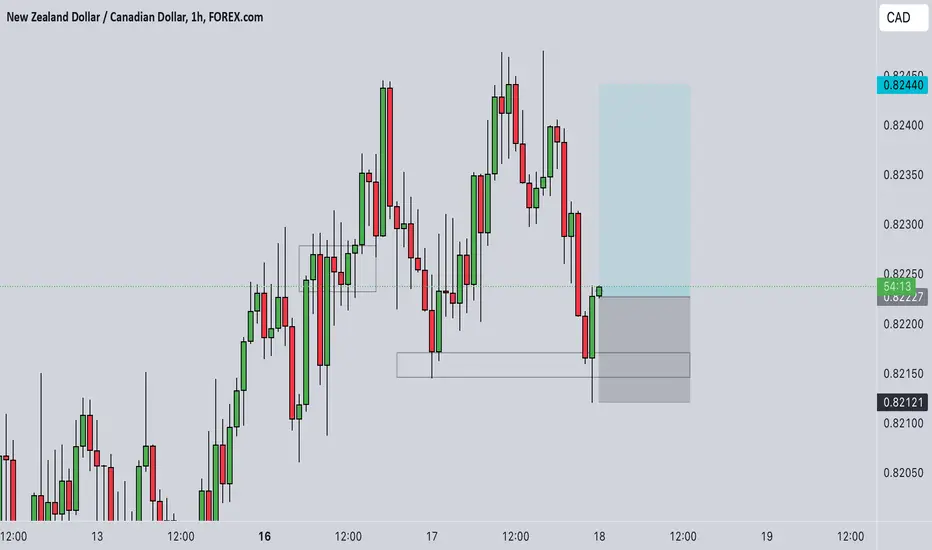
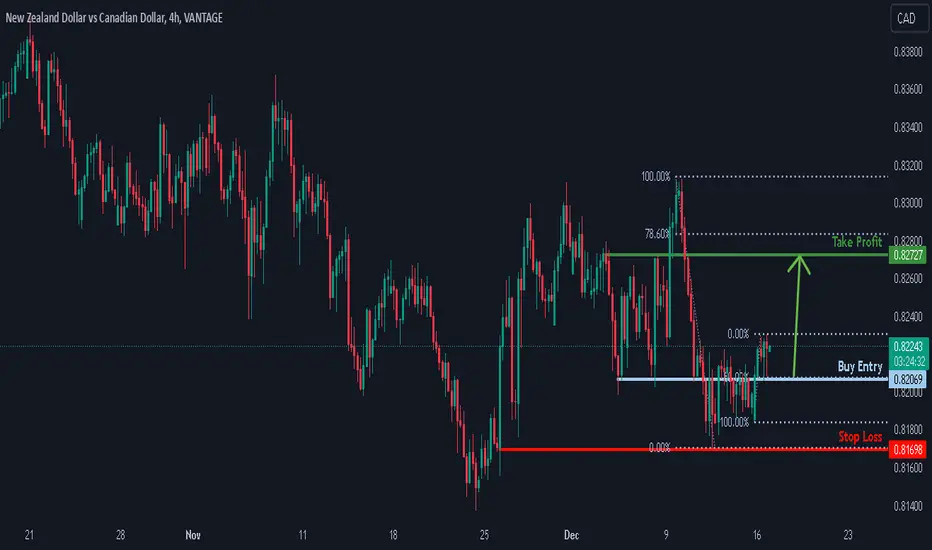
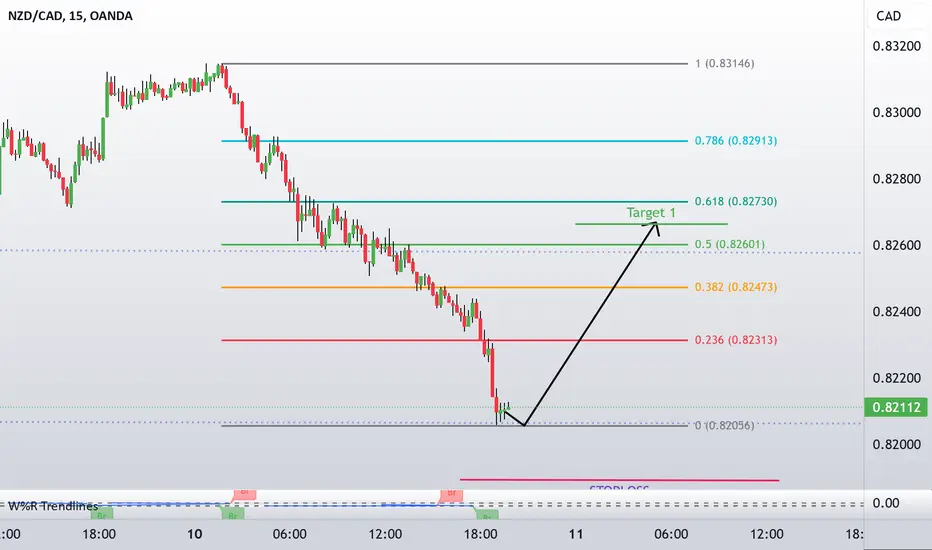
Potential bullish rise?NZD/CAD has reacted off the support level which is an overlap support that lines up with the 50% Fibonacci retracement and could rise from this level to our take profit.
Entry: 0.82069
Why we like it:
There is an overlap support level that lines up with the 50% Fibonacci retracement.
Stop loss: 0.81698
Why we like it:
There is a pullback support level.
Take profit: 0.82727
Why we like it:
There is a pullback resistance level that is slightly below the 78.6% Fibonacci retracement.
Enjoying your TradingView experience? Review us!
Please be advised that the information presented on TradingView is provided to Vantage (‘Vantage Global Limited’, ‘we’) by a third-party provider (‘Everest Fortune Group’). Please be reminded that you are solely responsible for the trading decisions on your account. There is a very high degree of risk involved in trading. Any information and/or content is intended entirely for research, educational and informational purposes only and does not constitute investment or consultation advice or investment strategy. The information is not tailored to the investment needs of any specific person and therefore does not involve a consideration of any of the investment objectives, financial situation or needs of any viewer that may receive it. Kindly also note that past performance is not a reliable indicator of future results. Actual results may differ materially from those anticipated in forward-looking or past performance statements. We assume no liability as to the accuracy or completeness of any of the information and/or content provided herein and the Company cannot be held responsible for any omission, mistake nor for any loss or damage including without limitation to any loss of profit which may arise from reliance on any information supplied by Everest Fortune Group.
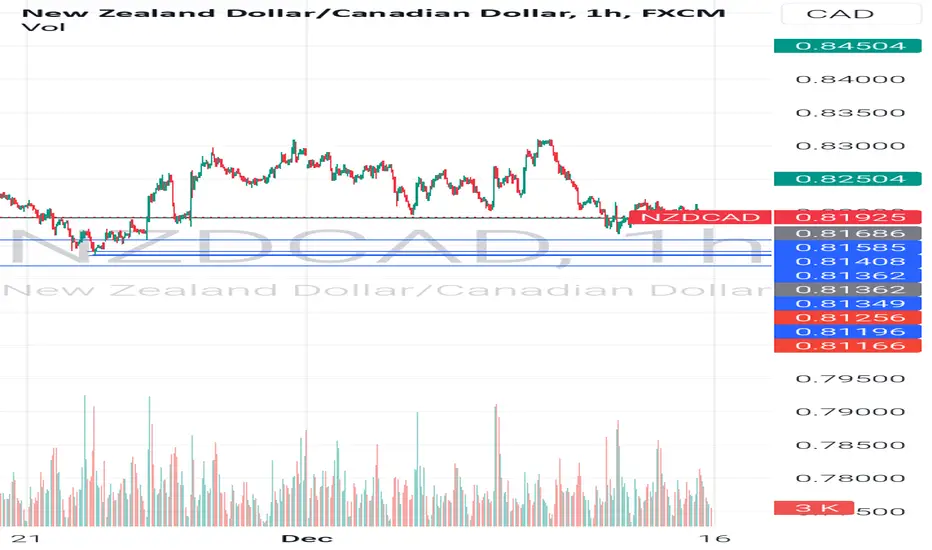
NZD/CAD MARKET SHIFT Hi,from 30min there is a change in market structure happen,so it's great opportunity to long this pair for a long term,don't buy when price is high wait for a pullback then enter.trade safe

NZDCAD FORECASTTraders! We have started this week with a lot of energy guys, the market itself is looking good. In this pair everything is looking good however we are waiting for the price to complete structure. This will be right time for us to position in the market. Have a good start of the week.

My view on NZDUSDNZDCAD still bullish on the long run. A mere retracement to my POI before a massive push to take out the previous high.
NZD/CAD NOW IT'S THE TIME After a long time NZD/CAD was taking downside liquidity,and now it's look like the time for buyers to step up in the market again.just wait for a pullback and start looking for a long entry.

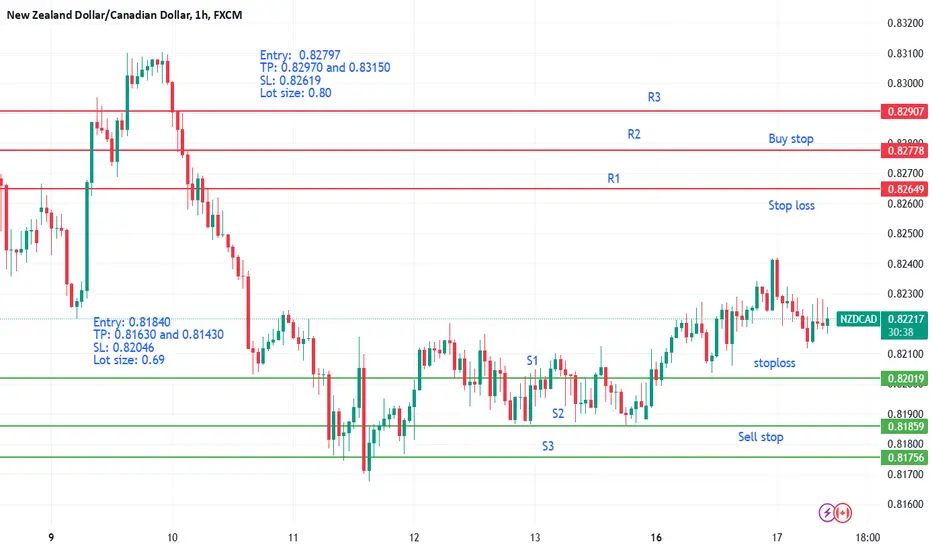
NZDCAD: Bullish Continuation & Long Signal
NZDCAD
- Classic bullish formation
- Our team expects pullback
SUGGESTED TRADE:
Swing Trade
Long NZDCAD
Entry - 0.8192
Sl - 0.8169
Tp - 0.8232
Our Risk - 1%
Start protection of your profits from lower levels
❤️ Please, support our work with like & comment! ❤️
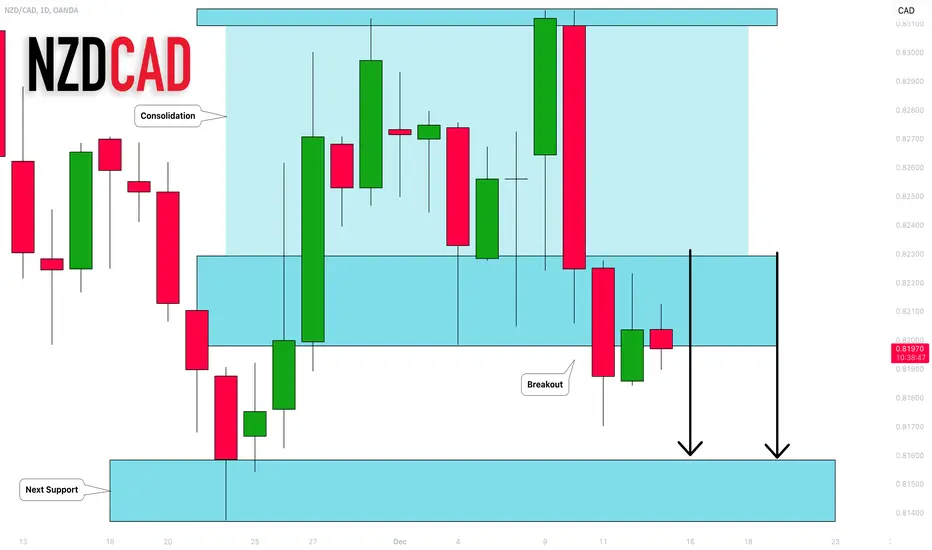
NZDCAD: Bearish Trend Continuation 🇳🇿🇨🇦
NZDCAD broke a support line of a wide consolidation range on a daily.
It opens a potential for a further decline.
Next support - 0.816
❤️Please, support my work with like, thank you!❤️
NZDCAD - LONGWEEKLY
- 4/4
+ Big trend line.
+ Closed above buy zone.
+ Impuls - corretion now possible impulse
- IC could hold the price down.
DAILY
- Pat in pat
+ Market open was very impulsive to the downside, possible impulse back to the upside.
- Buy zone is just underneath my SL
4H
- Limit placed
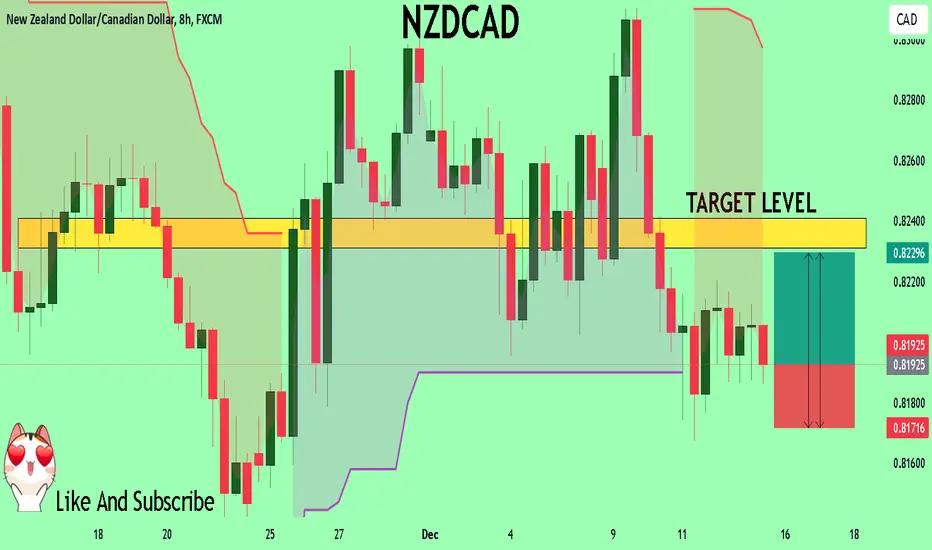
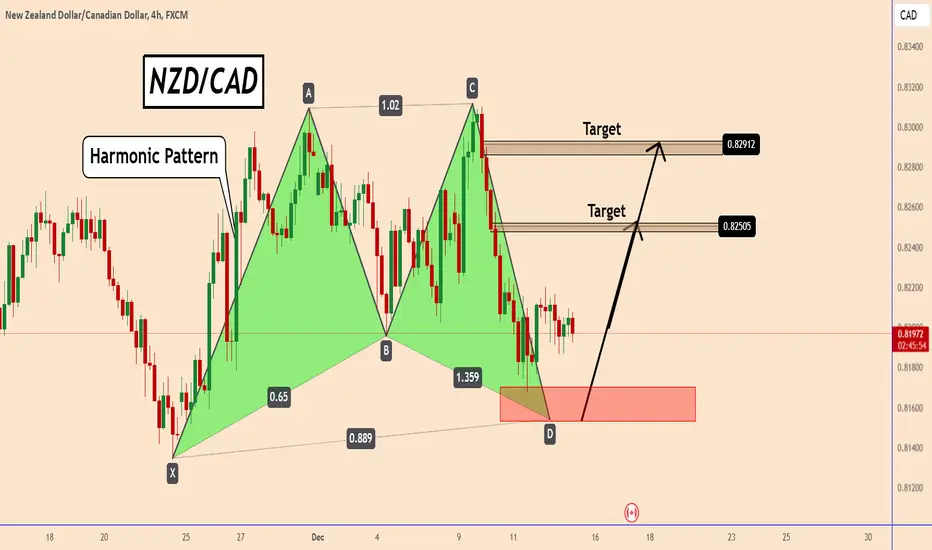
NZD/CAD: Near Completion of Bullish Harmonic PatternNZD/CAD: Near Completion of Bullish Harmonic Pattern
NZD/CAD is nearly completing a bullish harmonic pattern.
The price is expected to spend some time in the current zone due to generally low market volume, but a rise is anticipated.
I'm expecting a normal price recovery for short-term trading, with the first target near 0.8250 and the second target at 0.8290.
You may find more details in the chart!
Thank you and Good Luck!
❤️PS: Please support with a like or comment if you find this analysis useful for your trading day❤️
NZD/CAD BIASthere is a change in market structure from 15 min,also there is liquidity to the upside.pullback and we are looking for longs

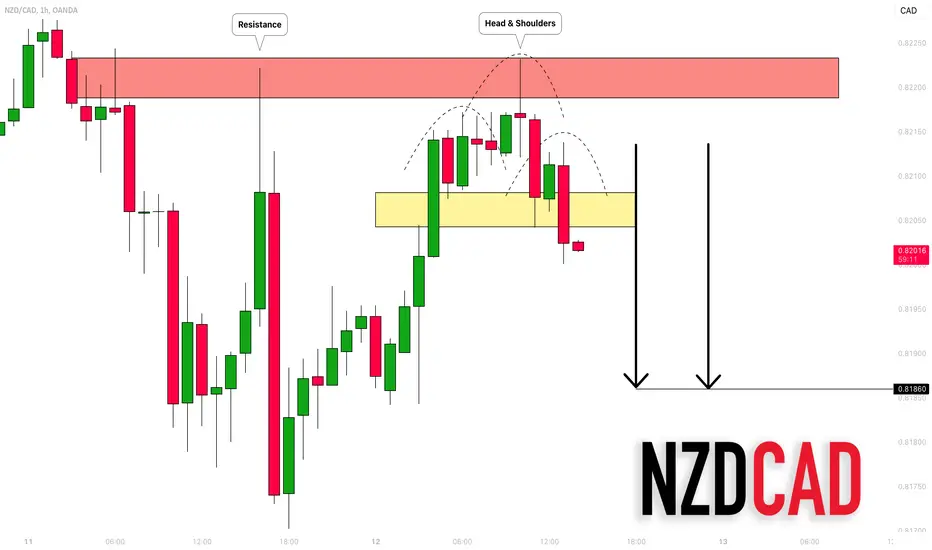
NZDCAD: Time to Sell?! 🇳🇿🇨🇦
NZDCAD looks bearish after a test of the intraday horizontal resistance.
As a confirmation, I see a bearish breakout of a neckline of a head & shoulders pattern.
The price will continue falling at least to 0.8186 support.
❤️Please, support my work with like, thank you!❤️
NZDCAD-LONG - SENTIMENT TRADING - DIVERGENCEBULLISH INDICATION:
1- sentiments are high for the pair NZDCAD currently 92 percent of traders are buying this
2- Bullish Divergence matured on 1H time Frame
3- Market has also formed inverted hammer on 4h time frame near it support level of 0.81662

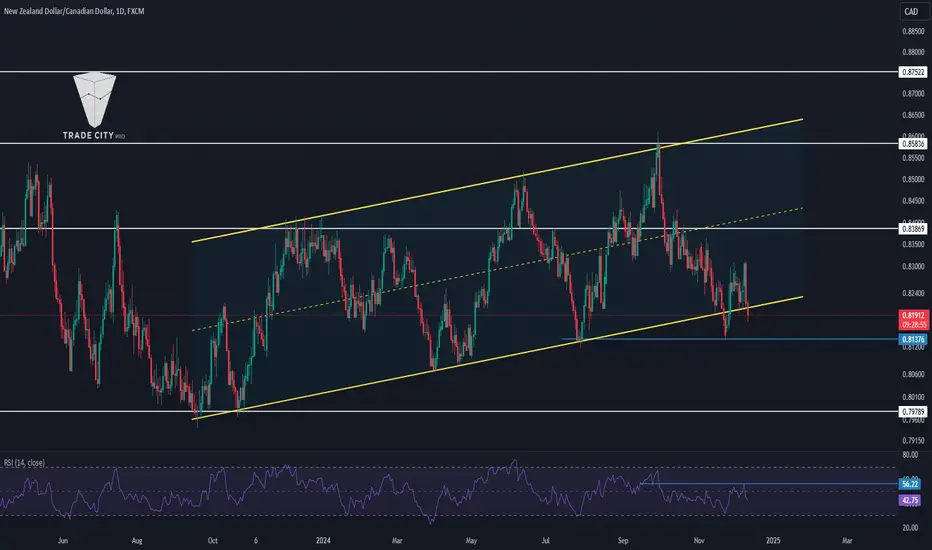
TradeCityPro | NZDCAD : Approaching Key Support Levels👋 Welcome to TradeCityPro!
In this analysis, I will review the NZDCAD forex pair for you. The analysis will be conducted on the daily timeframe.
📅 In this timeframe, a gradually sloping upward channel can be observed, with the price currently positioned near the bottom of the channel. The nearest support level to the current price is at 0.81376.
🧩 If the RSI manages to stabilize above 56.22, upward momentum could enter the market, allowing the price to potentially move towards the 0.83869 level.
📈 If 0.83869 is broken, the next resistance level will be at 0.86836, which approximately overlaps with the upper boundary of the ascending channel.
🔽 In the bearish scenario, as mentioned earlier, the first support level is 0.81376, and if this area is broken, the next support level will be 0.79789, which is one of the strongest support zones on the chart.
🔑 Overall, considering the more bearish momentum and the gentle slope of the ascending channel, I believe the likelihood of the channel breaking downward is quite high.
📝 Final Thoughts
This analysis reflects our opinions and is not financial advice.
Share your thoughts in the comments, and don’t forget to share this analysis with your friends! ❤️
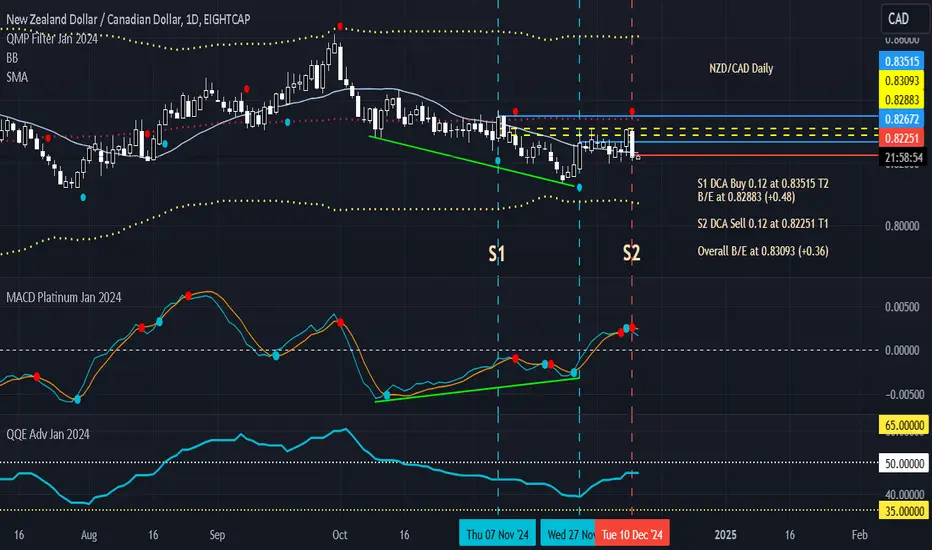
Wed 11th Dec 2024 NZD/CAD Daily Forex Chart Sell SetupGood morning fellow traders. On my Daily Forex charts using the High Probability & Divergence trading methods from my books, I have identified a new trade setup this morning. As usual, you can read my notes on the chart for my thoughts on this setup. The trade being a NZD/CAD Sell. Enjoy the day all. Cheers. Jim