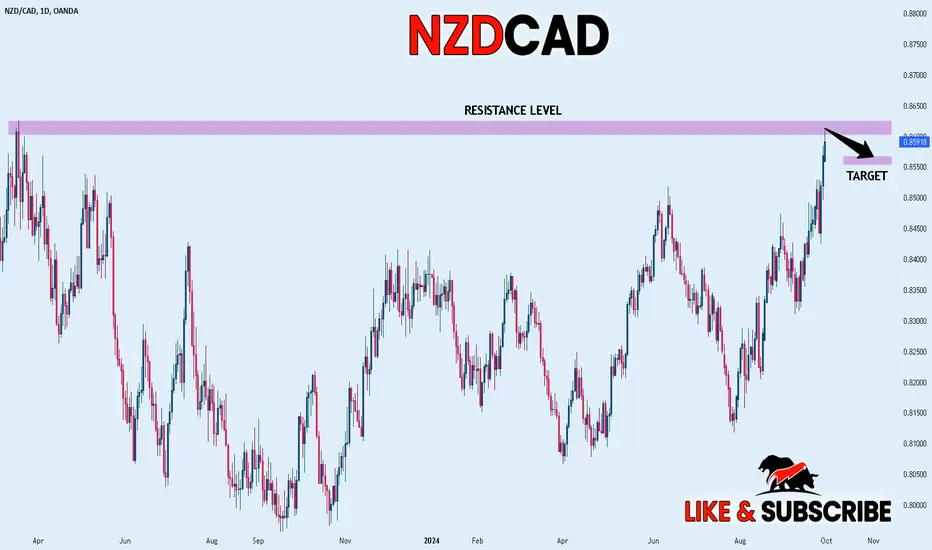
NZD_CAD LOCAL SHORT|
✅NZD_CAD went up just as
I predicted in my previous analysis
But is now approaching a supply level of 0.8624
So according to our strategy
We will be looking for the signs of the reversal in the trend
To jump onto the bearish bandwagon just on time to get the best
Risk reward ratio for us
SHORT🔥
✅Like and subscribe to never miss a new idea!✅
CADNZD trade ideas
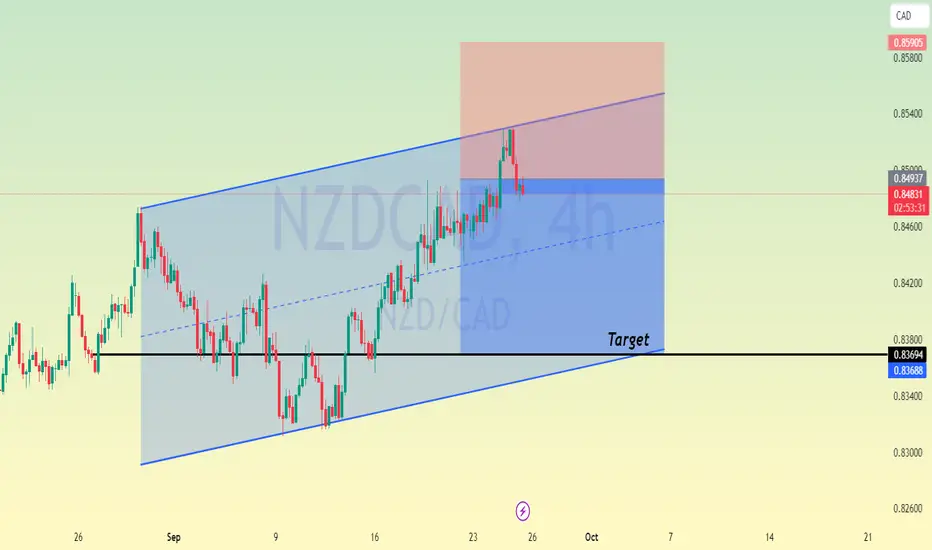
NZD/CADFull analysis of the NZD/CAD pair
1- An ascending price channel on a 4-hour frame
2- Touch the left channel from the top
3- The emergence of strong display areas
4- The appearance of divergence on the RSI and MACD indicators
So we start looking for deals to sell
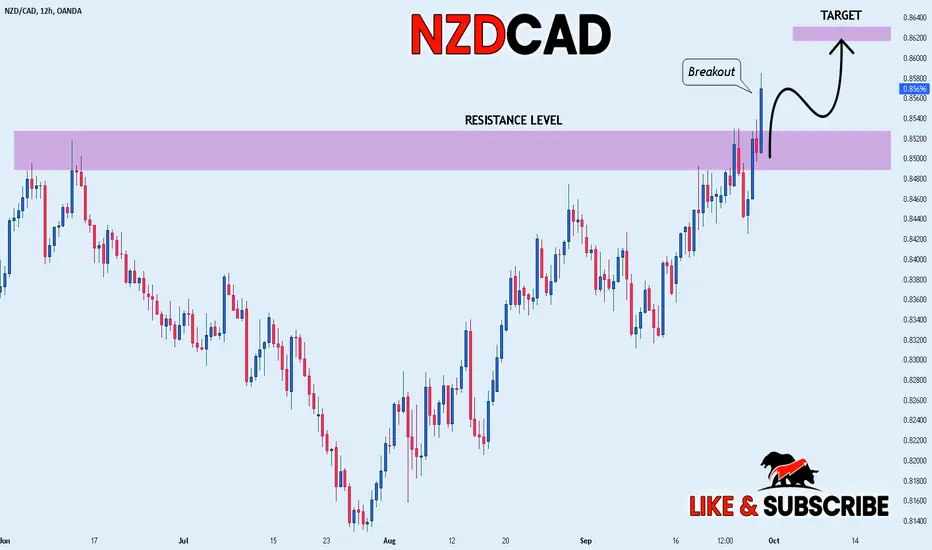
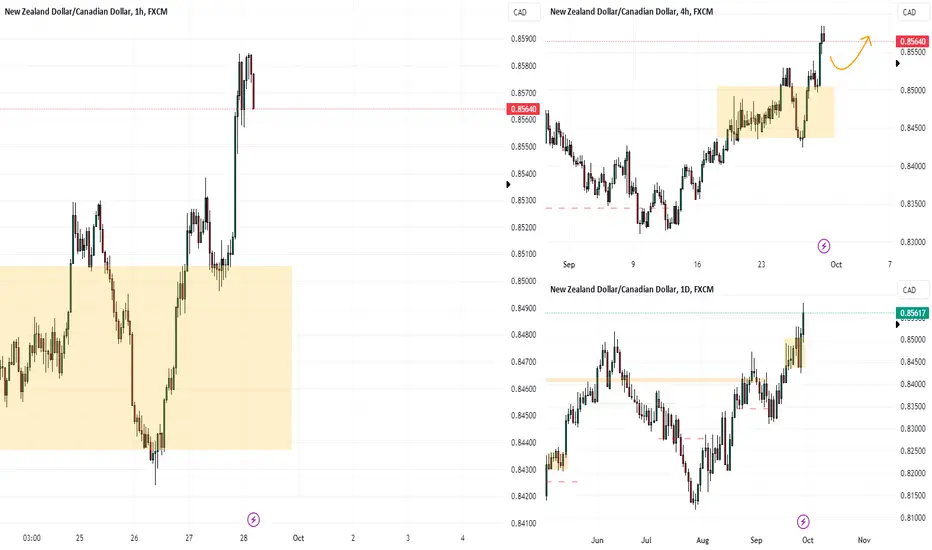
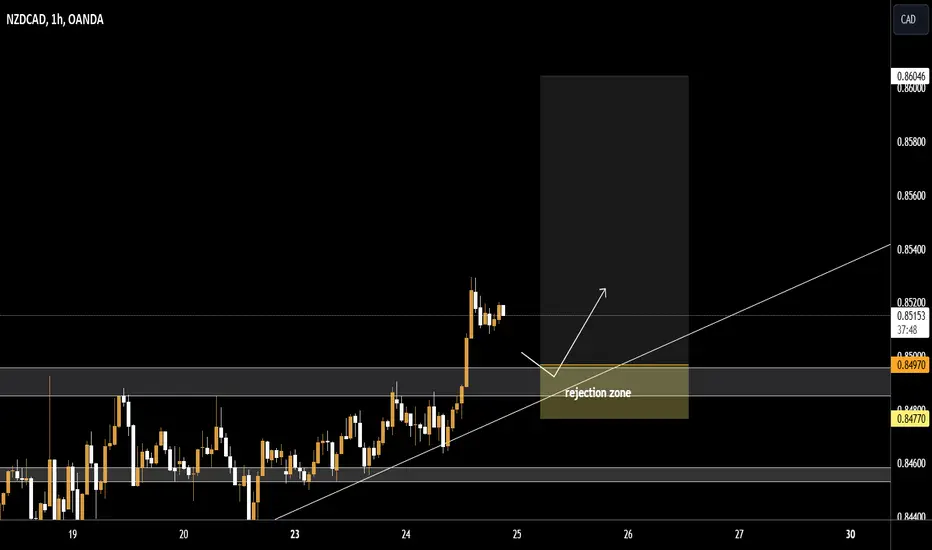
NZD_CAD BULLISH BREAKOUT|LONG|
✅NZD_CAD is trading in an
Uptrend and we are seeing a
Strong bullish breakout of the
Key horizontal level of 0.8520
Which is now a support so
After a potential local pullback
We will be expecting a
Further bullish continuation
LONG🚀
✅Like and subscribe to never miss a new idea!✅
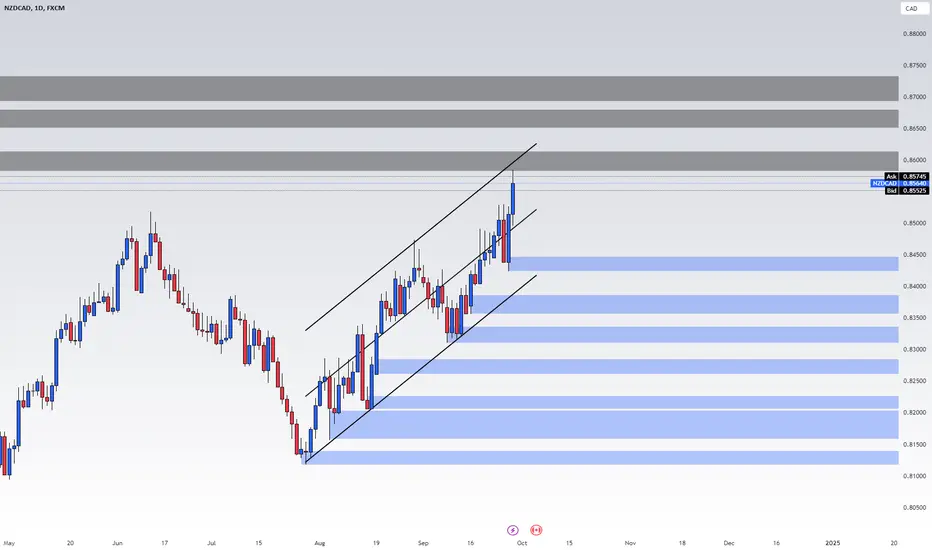
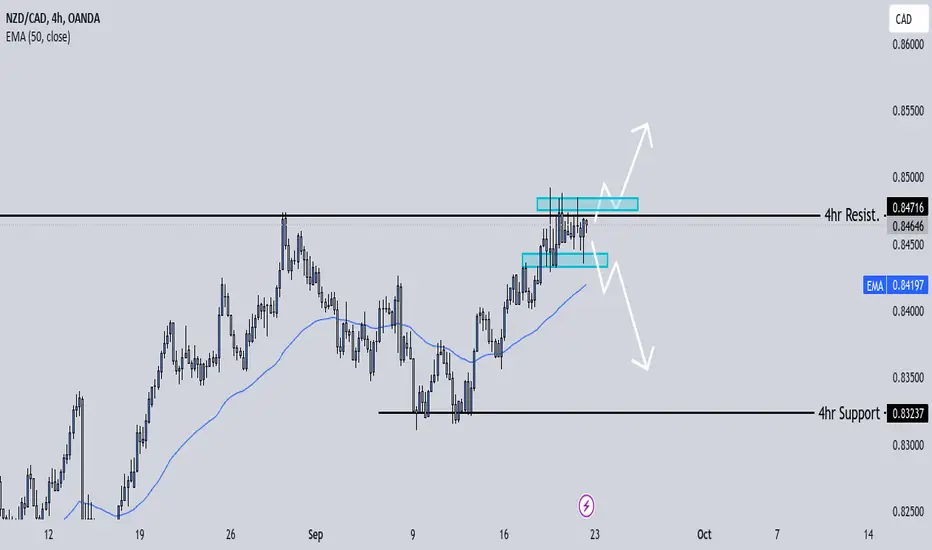
Ncad more upside to come,it seems :)Hello fellow traders , my regular and new friends!
Welcome and thanks for dropping by my post.
Should be getting to see more upside
Do check out my recorded video (in trading ideas) for the week to have more explanation in place.
Do Like and Boost if you have learnt something and enjoyed the content, thank you!
-- Get the right tools and an experienced Guide, you WILL navigate your way out of this "Dangerous Jungle"! --
*********************************************************************
Disclaimers:
The analysis shared through this channel are purely for educational and entertainment purposes only. They are by no means professional advice for individual/s to enter trades for investment or trading purposes.
*********************************************************************
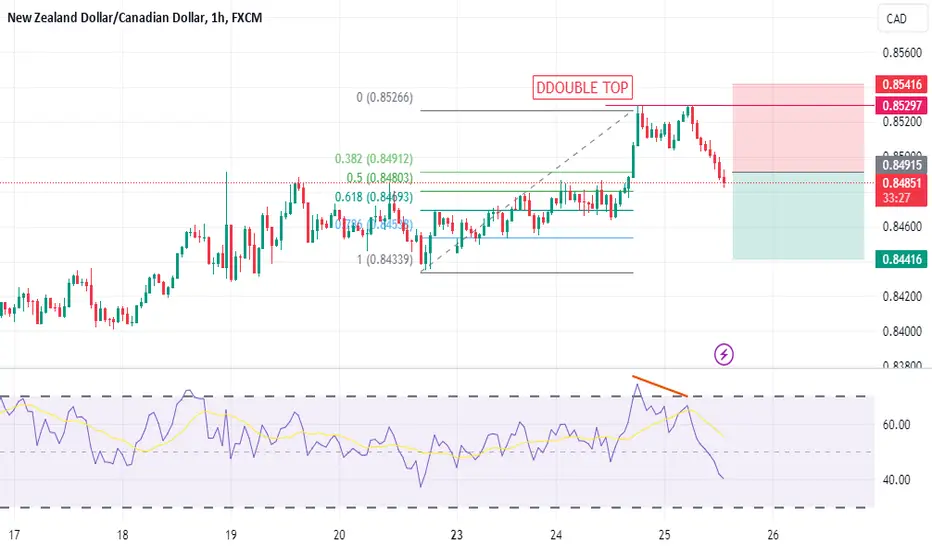
NZDCAD ChartThere is Bullish Trend, But RSI forms Bearish Divergence and also there is Bearish Pattern of Double Top. Will Take Short entry at the Break of last HL. Trade Plan According to this Analysis and my Risk Reward.

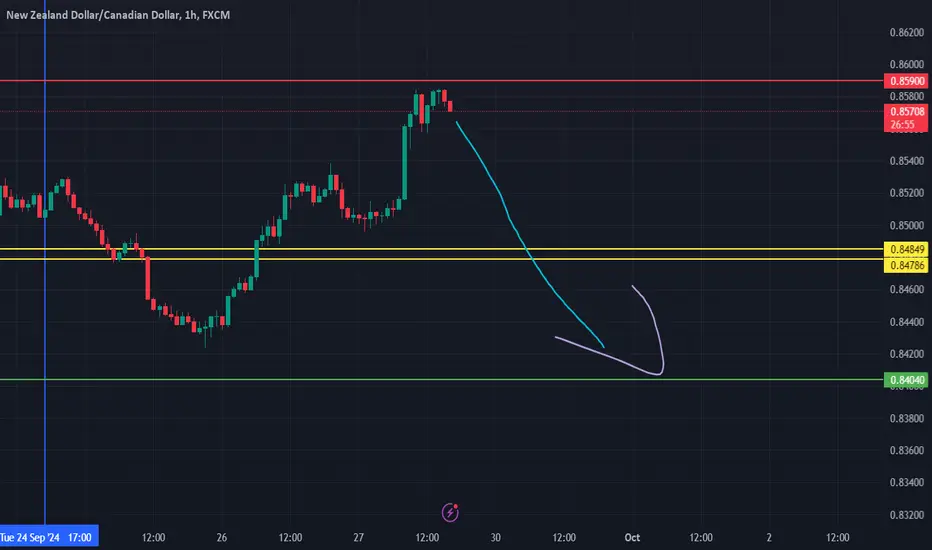
NZDCAD SHORT 0.84040 TP Chinese stimulus & Middle East tensions are making oil rise thus providing support to the canadian dollar. Oil is Canada's #1 export. When oil rises so does CAD. 0.84040 TP
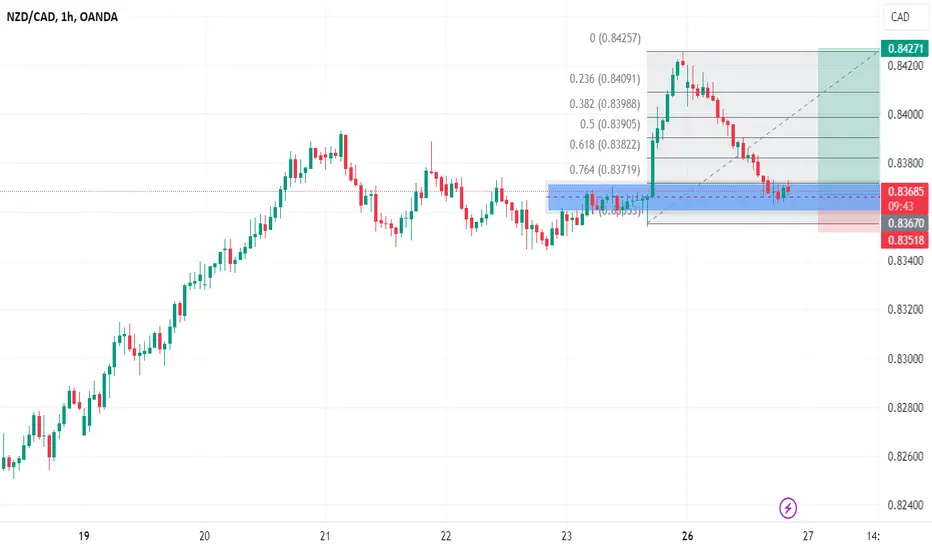
NZDCADWhat are the odds of this pair buying till those Zones. We are in a key fib zone. we have oprder block ast that point. hoping to join tomorrow
NZDCADWe can attempt to short NZDCAD from specified level as it break HL , also bearish divergence occur indicate that it moves downward.
SL , TP mention in chart.
NZDCAD BULLSAt our POI demand zone on the Daily and 4 hour chart. Price will pull back to the demand that caused a BOS. Wait for price to close with a reversal candlestick on the demand zone for buys!
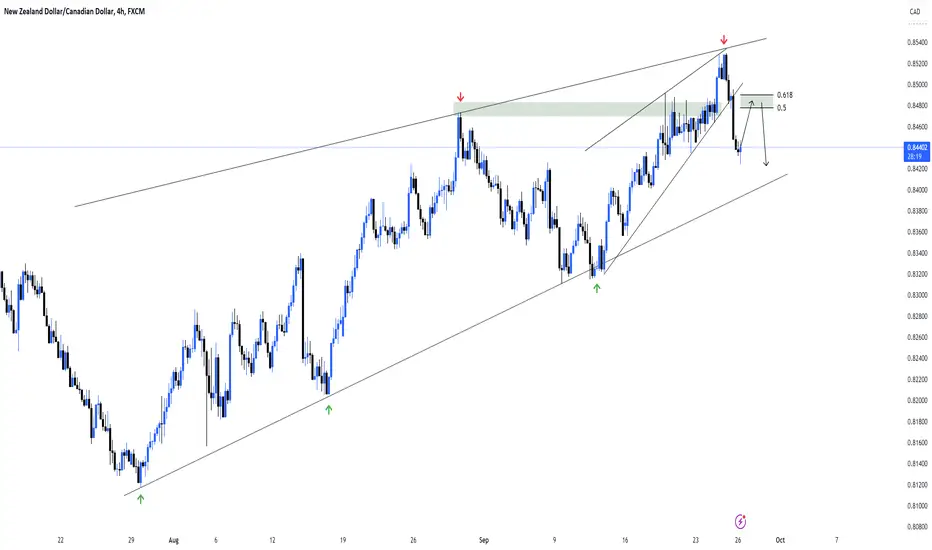
NZDCAD 4HThe price has reacted after reaching the ceiling of the channel. The upward trend line has been broken in the four-hour period. We are waiting for the price retest to 0.5 and 0.618 Fibonacci. If we see the trigger, we will enter the Sell transaction.
Bullish bounce off 50% Fibonacci support?NZD/CAD is reacting off the pivot and could potentially rise to the 1st resistance which acts as a pullback resistance.
Pivot: 0.8368
1st Support: 0.8368
1st Resistance: 0.8488
Risk Warning:
Trading Forex and CFDs carries a high level of risk to your capital and you should only trade with money you can afford to lose. Trading Forex and CFDs may not be suitable for all investors, so please ensure that you fully understand the risks involved and seek independent advice if necessary.
Disclaimer:
The above opinions given constitute general market commentary, and do not constitute the opinion or advice of IC Markets or any form of personal or investment advice.
Any opinions, news, research, analyses, prices, other information, or links to third-party sites contained on this website are provided on an "as-is" basis, are intended only to be informative, is not an advice nor a recommendation, nor research, or a record of our trading prices, or an offer of, or solicitation for a transaction in any financial instrument and thus should not be treated as such. The information provided does not involve any specific investment objectives, financial situation and needs of any specific person who may receive it. Please be aware, that past performance is not a reliable indicator of future performance and/or results. Past Performance or Forward-looking scenarios based upon the reasonable beliefs of the third-party provider are not a guarantee of future performance. Actual results may differ materially from those anticipated in forward-looking or past performance statements. IC Markets makes no representation or warranty and assumes no liability as to the accuracy or completeness of the information provided, nor any loss arising from any investment based on a recommendation, forecast or any information supplied by any third-party.

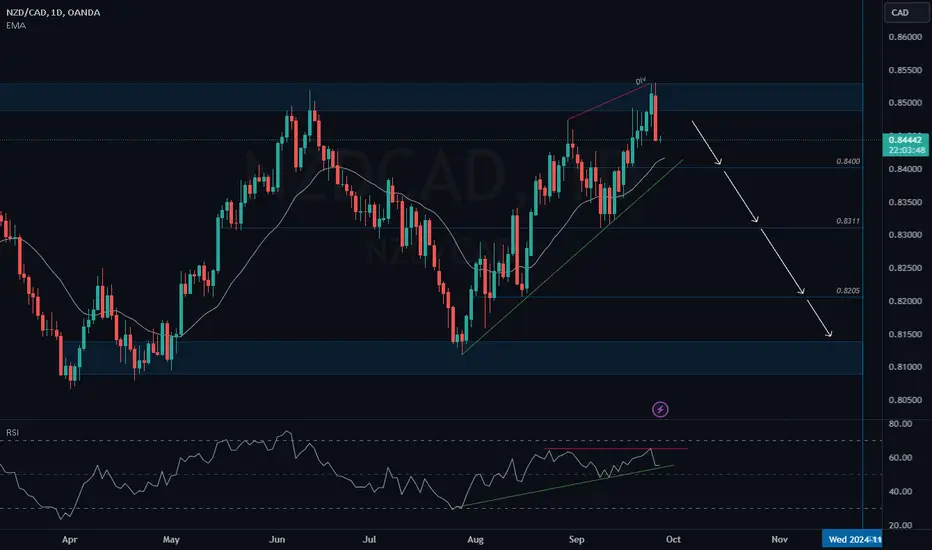
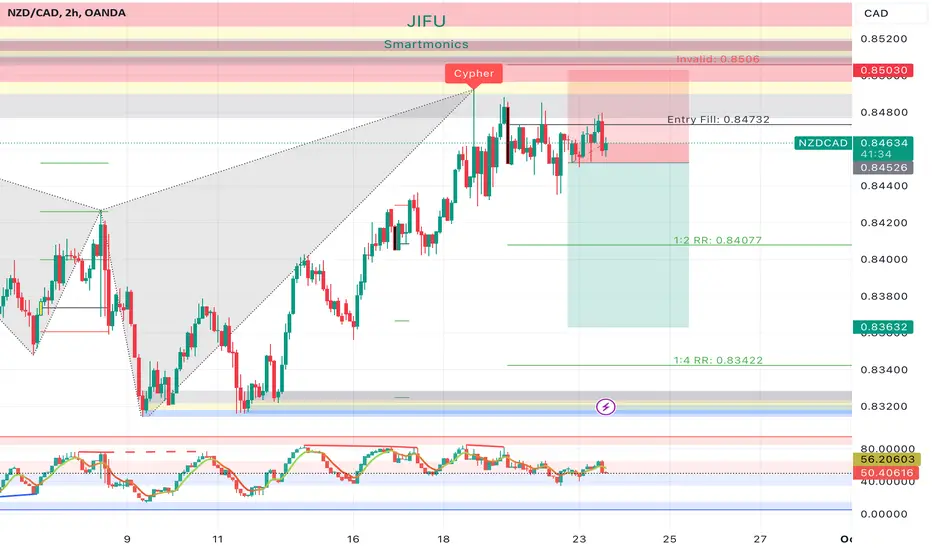
NZD/CAD Sell Trade Idea - Bearish Reversal SetupAnalysis:
NZD/CAD is showing signs of a potential bearish reversal. The price has recently tested a strong resistance zone near 0.8550 and failed to break higher. This rejection, combined with bearish divergence on momentum indicators like RSI , suggests that sellers are regaining control. The formation of a bearish candlestick pattern at resistance reinforces the probability of a downside move.
Reasons for the Trade:
Rejection from a strong resistance level with confirmation from bearish divergence.
The price structure suggests a lower high, pointing towards a continuation of the bearish trend.
Risk Management: Properly set your stop loss and adjust your position size according to your risk tolerance to manage potential drawdowns.
Disclaimer: This is a trade idea, not financial advice. Always conduct your own analysis and consider your risk tolerance before executing any trade.
NZDCAD is in the Bearish direction From Solid ResistanceHello Traders
In This Chart nzdcad HOURLY Forex Forecast By FOREX PLANET
today NZDCAD analysis 👆
🟢This Chart includes_ (NZDCAD market update)
🟢What is The Next Opportunity on NZDCAD Market
🟢how to Enter to the Valid Entry With Assurance Profit
This CHART is For Trader's that Want to Improve Their Technical Analysis Skills and Their Trading By Understanding How To Analyze The Market Using Multiple Timeframes and Understanding The Bigger Picture on the Charts
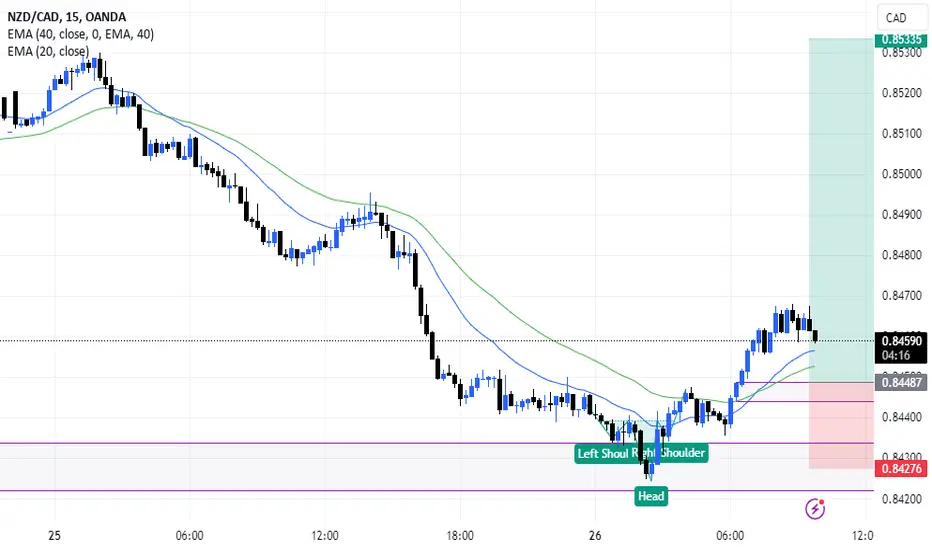
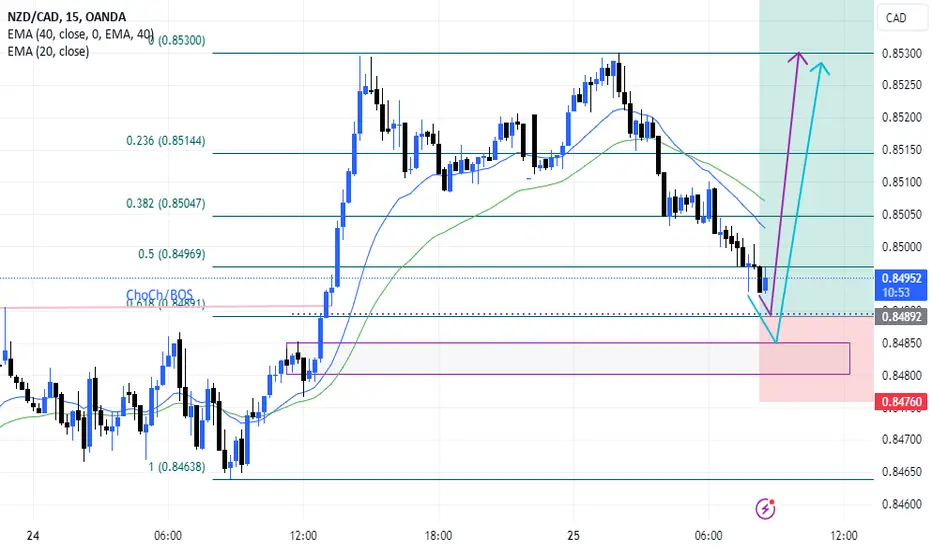
NZDCAD BULLSWeekly created a HH and Daily chart retracing to the demand zone for upward momentum, tested the demand still continuing upward. 4 hour and M15 chart pulling toward the demand zone which is the 61.8% Fibonacci level. Wait for a reversal candlestick purple dotted line in the M1 chart and/or 20EMA cross above 40EMA on the M15 demand zone for buys!
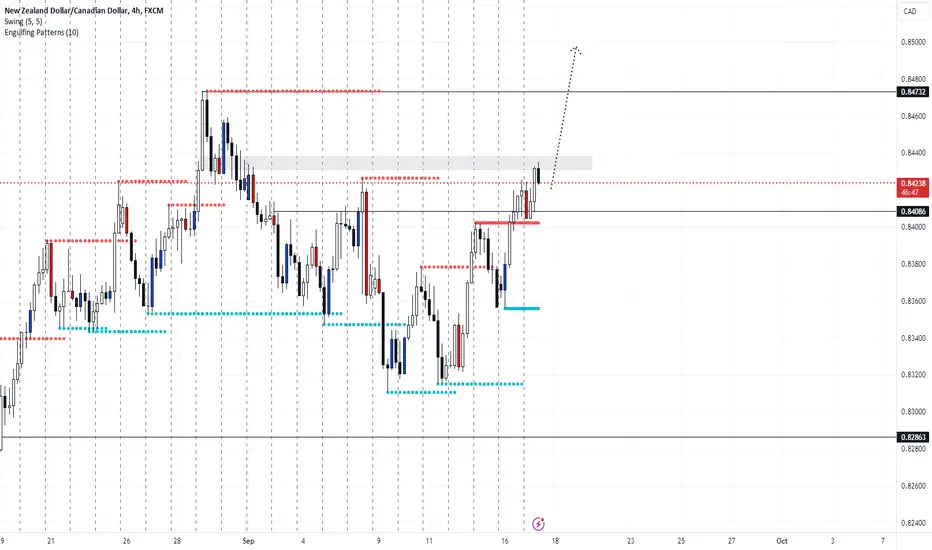
NZDCAD LONGMarket structure Bullish on HTFs 30
Entry at Weekly and Daily AOi
Strong Weekly Engulfing
Strong Weekly Resistance Level broken
Daily Rejection at AOi
Previous Structure point on the Daily
Touching EMA Y
H4 Candlestick rejection
Levels 5.79
Entry 95%
Trading is a Game Of Probability
: Manage Your Risk
: Be Patient
: Every Moment Is Unique
: Rinse, Wash, Repeat!
: Christ is King

IDEA NZDCAD LONG POSITION Hi Trdaers
Pair : NZDCAD
Position : LONG( BUY )
Entry Price : 0.84970
STOP LOSS @ 0.84770
TP 1 @ 0.85180
TP 2 @ 0.85380
TP 3 @ 0.86000 ( Trailing SL )
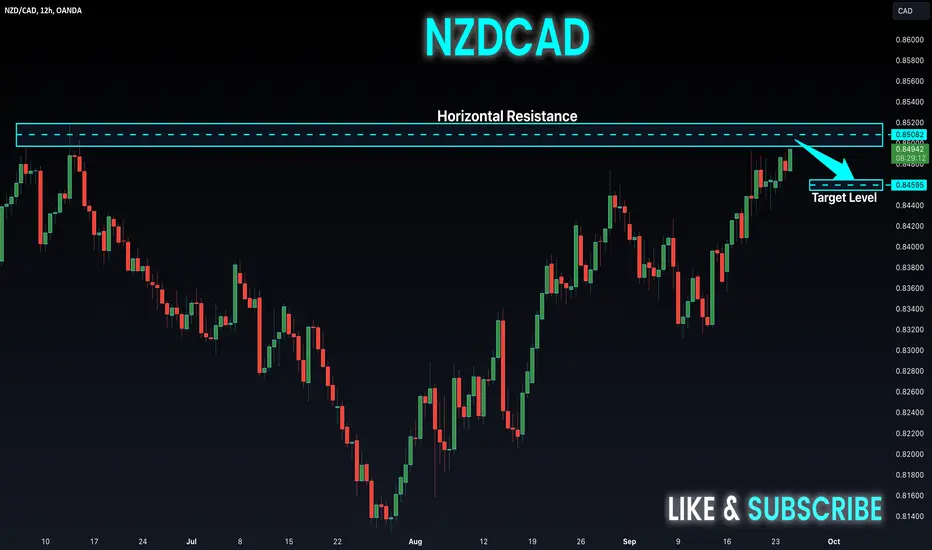
NZD-CAD Risky Short! Sell!
Hello,Traders!
NZD-CAD is going up
And will soon retest
A horizontal resistance
Of 0.8520 and after the
Retest we will be expecting
A local bearish reaction
Sell!
Like, comment and subscribe to help us grow!
Check out other forecasts below too!
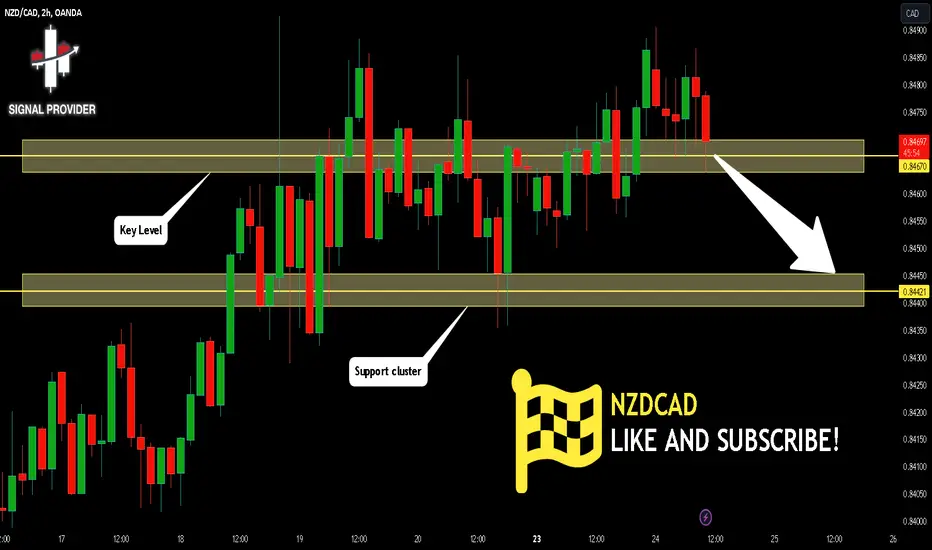
NZDCAD Will Go Lower From Resistance! Short!
Here is our detailed technical review for NZDCAD.
Time Frame: 2h
Current Trend: Bearish
Sentiment: Overbought (based on 7-period RSI)
Forecast: Bearish
The price is testing a key resistance 0.846.
Taking into consideration the current market trend & overbought RSI, chances will be high to see a bearish movement to the downside at least to 0.844 level.
P.S
Please, note that an oversold/overbought condition can last for a long time, and therefore being oversold/overbought doesn't mean a price rally will come soon, or at all.
Like and subscribe and comment my ideas if you enjoy them!
NZD_CAD RESISTANCE AHEAD|SHORT|
✅NZD_CAD is set to retest a
Strong resistance level above at 0.8520
After trading in a local uptrend for some time
Which makes a bearish pullback a likely scenario
With the target being a local support below at 0.8440
SHORT🔥
✅Like and subscribe to never miss a new idea!✅

suply level and harmonic patter shownsuply level and harmonic patter shown. Price clearly at a supply level with signs of rejection. failing to make new high and harmonic pattern displayed. entry candle also given
NzdCadNC giving us 2 possible plays that could play out beautifully. Again with patience being our best friend. Price can either break back down below to respect the range we've had going on for some time or we can continue last weeks bullish structures. There's a monthly range between 0.88000 and 0.77300. Once price tapped 0.88000 we went bearish. I was honestly expecting price to continue bearish until we hit that monthly support which is why I'm personally looking for shorts on this set up but we'll see what happens.
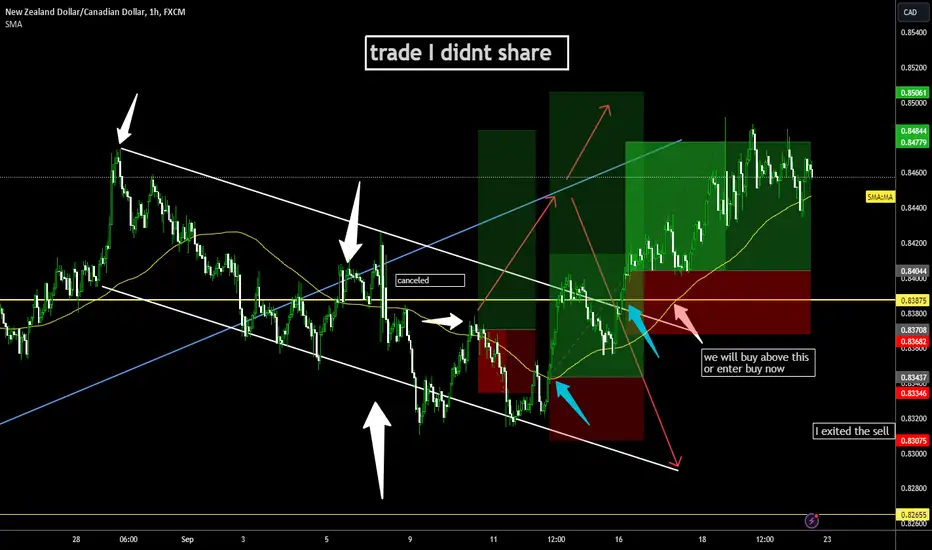
NZDCADEVERYTHING ON CHART
please check my pre idea so you can understand better
signals and analsys are free... and always will be