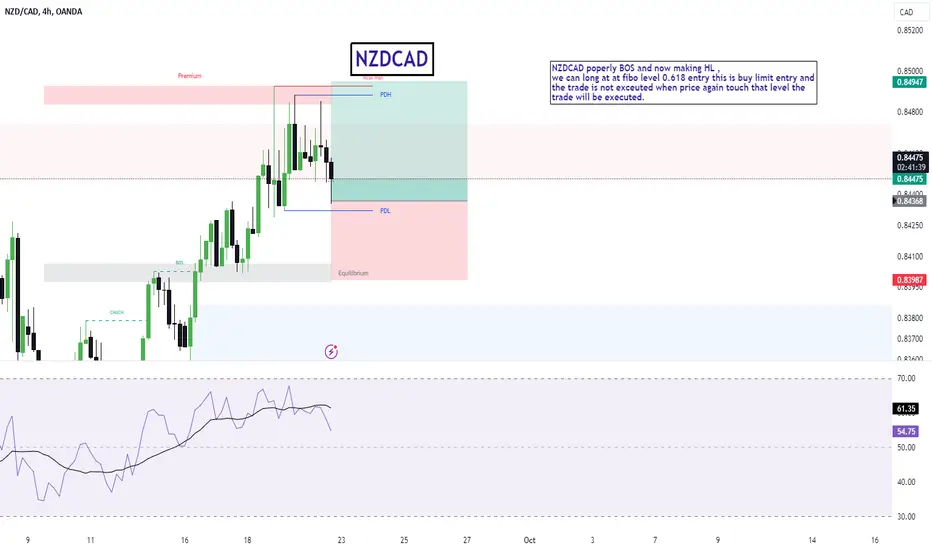
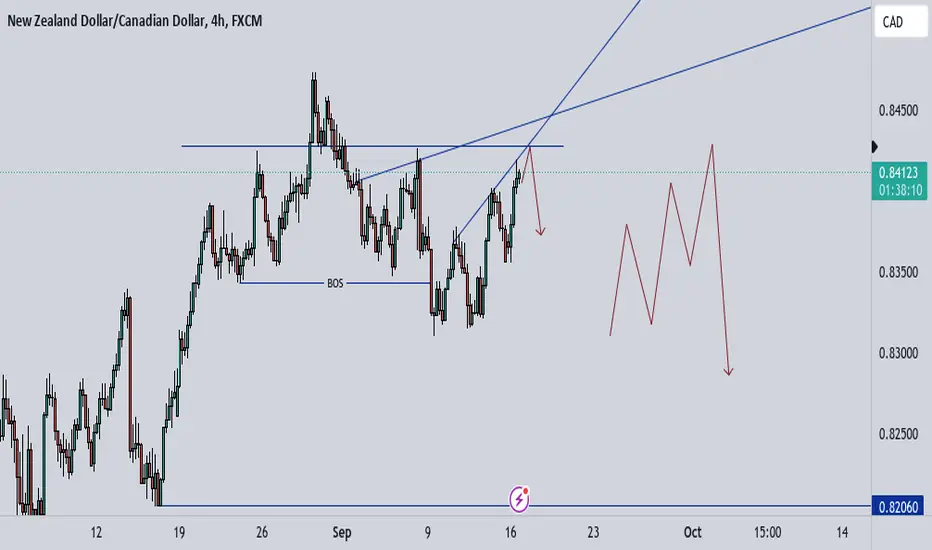
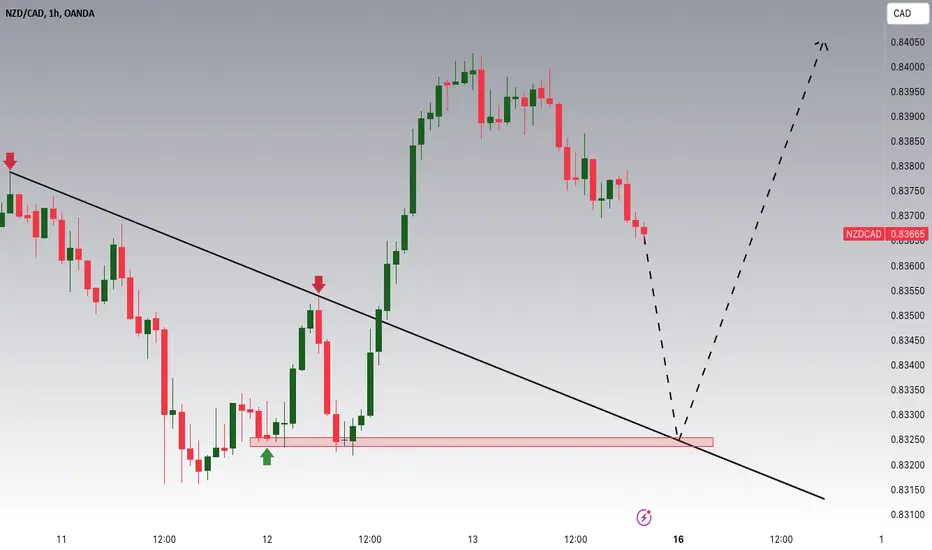
NZDCADNZDCAD poperly BOS and now making HL ,
we can long at at fibo level 0.618 entry this is buy limit entry and
the trade is not exceuted when price again touch that level the
trade will be executed.
CADNZD trade ideas
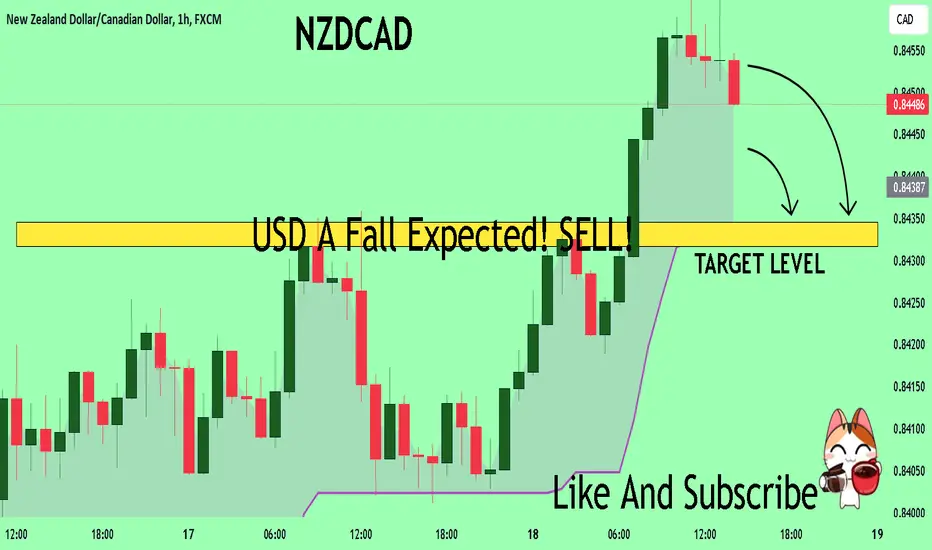
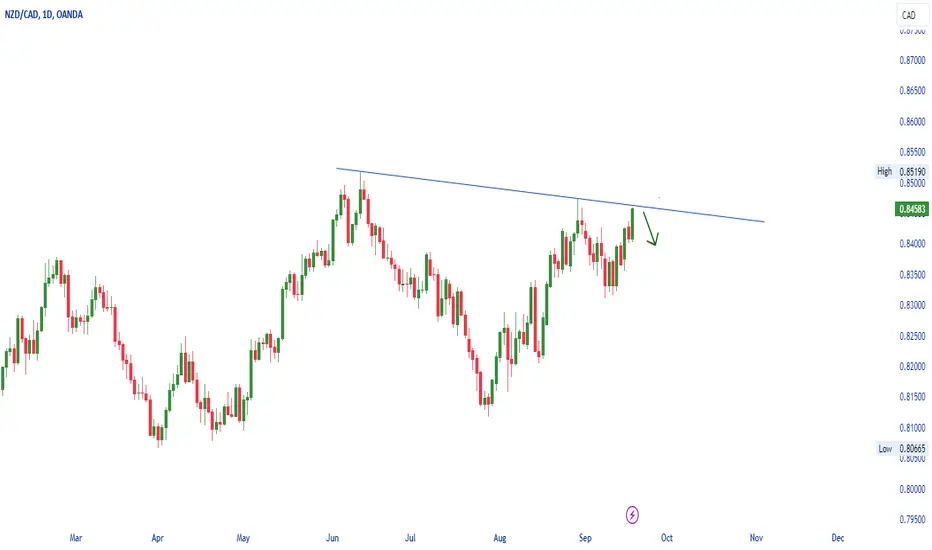
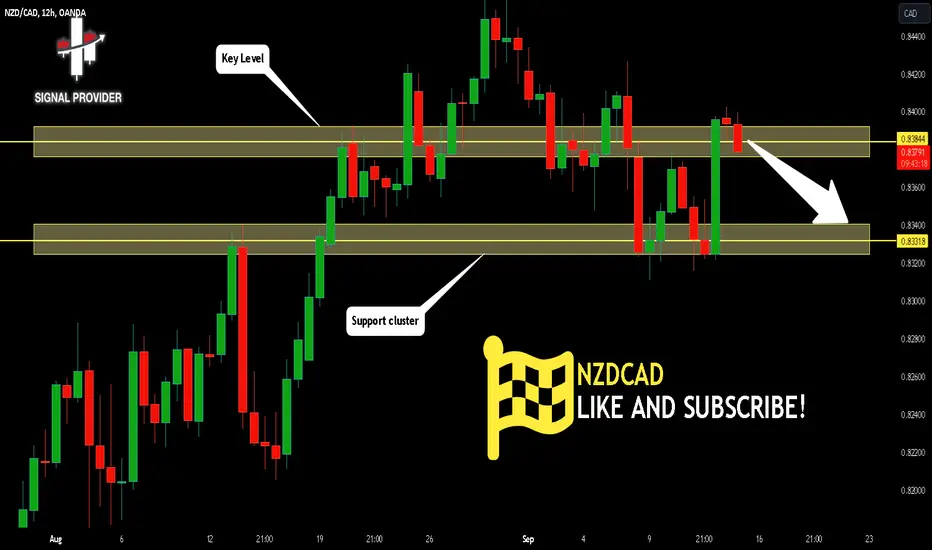
NZDCAD A Fall Expected! SELL!
My dear subscribers,
My technical analysis for NZDCAD is below:
The price is coiling around a solid key level - 0.8452
Bias - Bearish
Technical Indicators: Pivot Points Low anticipates a potential price reversal.
Super trend shows a clear sell, giving a perfect indicators' convergence.
Goal - 0.8434
About Used Indicators:
By the very nature of the supertrend indicator, it offers firm support and resistance levels for traders to enter and exit trades. Additionally, it also provides signals for setting stop losses
———————————
WISH YOU ALL LUCK
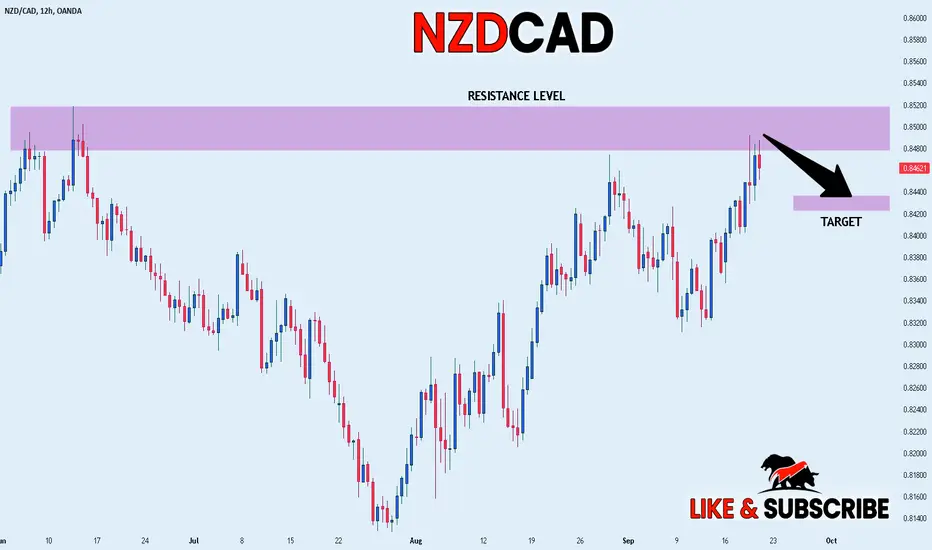
NZD_CAD BEARISH BIAS|SHORT|
✅NZD_CAD is set to retest a
Strong resistance level above at 0.8520
After trading in a local uptrend for some time
Which makes a bearish pullback a likely scenario
With the target being a local support below at 0.8437
SHORT🔥
✅Like and subscribe to never miss a new idea!✅
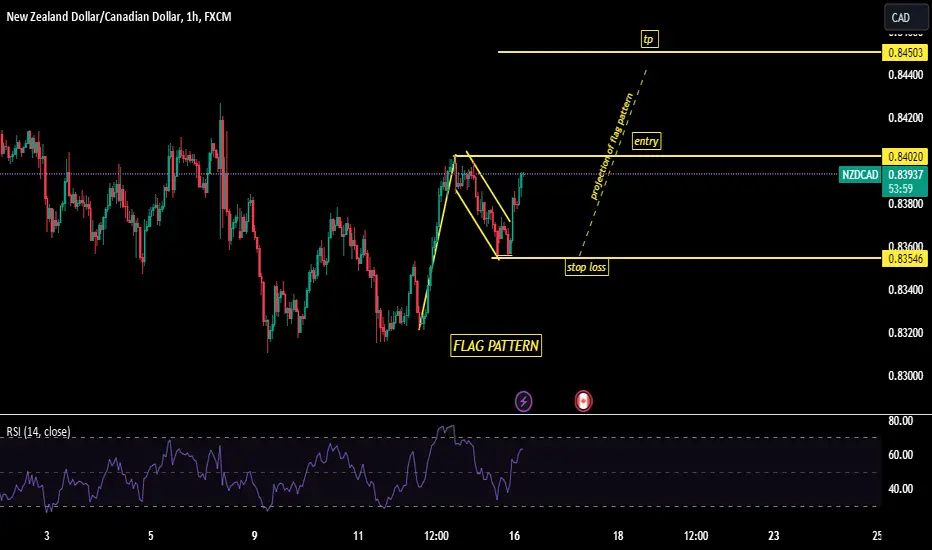
Bullish bounce?NZD/CAD is falling towards the support level which is an overlap support that aligns with the 38.2% Fibonacci retracement and could bounce from this level to our take profit.
Entry: 0.84007
Why we like it:
There is an overlap support level that aligns with the 38.2% Fibonacci retracement.
Stop loss: 0.83568
Why we like it:
There is a pullback support level which lines u with the 61.8% Fibonacci retracement.
Take profit: 0.84696
Why we like it:
There is a pullback resistance level.
Enjoying your TradingView experience? Review us!
Please be advised that the information presented on TradingView is provided to Vantage (‘Vantage Global Limited’, ‘we’) by a third-party provider (‘Everest Fortune Group’). Please be reminded that you are solely responsible for the trading decisions on your account. There is a very high degree of risk involved in trading. Any information and/or content is intended entirely for research, educational and informational purposes only and does not constitute investment or consultation advice or investment strategy. The information is not tailored to the investment needs of any specific person and therefore does not involve a consideration of any of the investment objectives, financial situation or needs of any viewer that may receive it. Kindly also note that past performance is not a reliable indicator of future results. Actual results may differ materially from those anticipated in forward-looking or past performance statements. We assume no liability as to the accuracy or completeness of any of the information and/or content provided herein and the Company cannot be held responsible for any omission, mistake nor for any loss or damage including without limitation to any loss of profit which may arise from reliance on any information supplied by Everest Fortune Group.

NZDCAD Bearish Move for at least this monthNZDCAD has touched a strong bearish trendline that has been created since the start of the year, not only that but now it is about to create a double top at the higher timeframe which makes it a good play to short it for the forcible weeks.
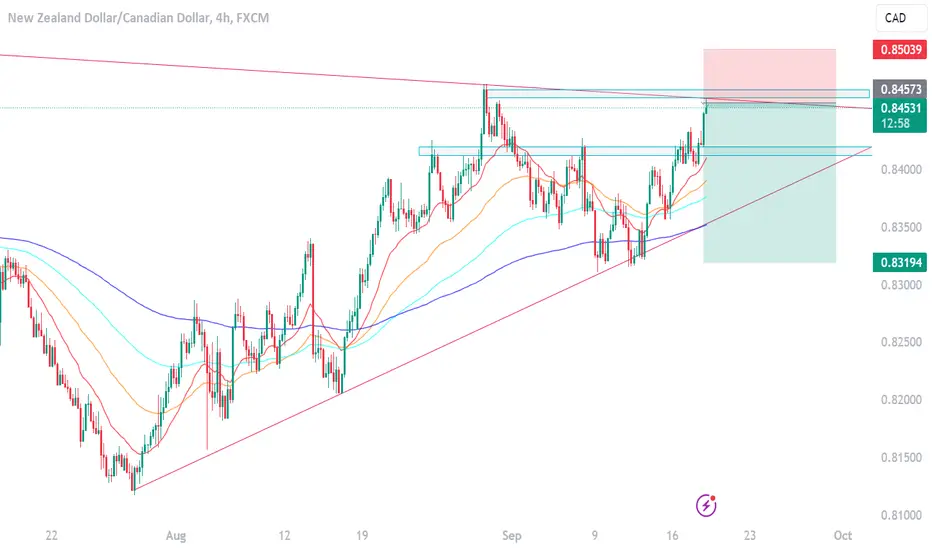
NZD/CAD Simple Trade PlansNZDCAD has been uptrending for a considerable amount of time.
Risk inflows as a results of weaker USD may be apparent post FOMC later, coupled with a weaker CAD.
Would not be surprised if higher prices reached (Upper TL).
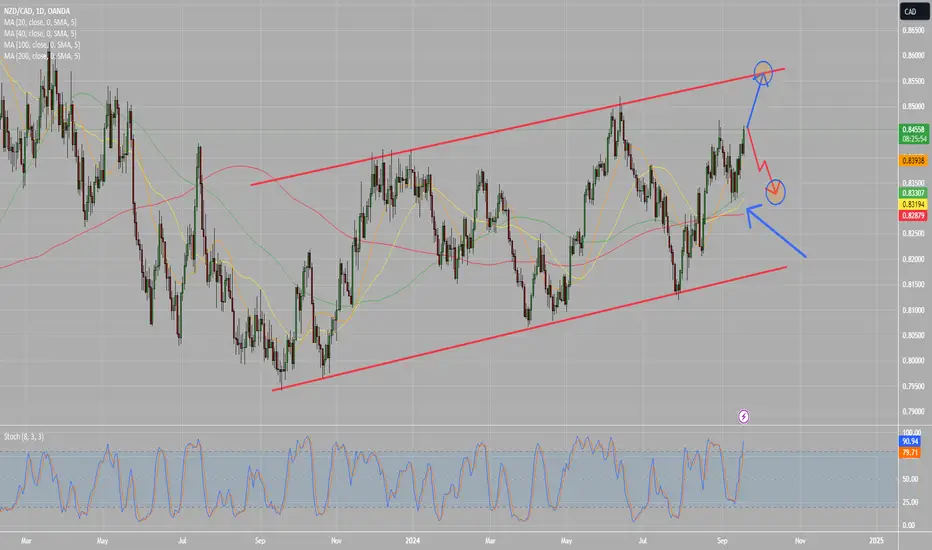
A potential sell opportunityTrend lines have amazing magical powers to them.
This could be a good sell on nzdcad as soon as the price kisses the trend line from below and reverses.
We must first see the signs of reversal on the lower time frames, though. For example, on the 1h & 15m charts.
On the 4h, daily, and weekly, this trend line holding its ground. That's what makes it looks like a place to sell from.
Yes, the price can break out of it and test the higher highs further up, but then again, you can't ignore the magical power of trend lines.
NzdCad Trade IdeaNC is in a solid range with clean structures within the level. Price at the moment is bullish in the range. NC just made a higher high just above resistance but if price can break the bullish structure and come back inside the range shorts may be possible here. Since it's on the range the retest may not happen so I won't be too focused on the pair. Risk:reward would still be solid so we'll see how price moves.
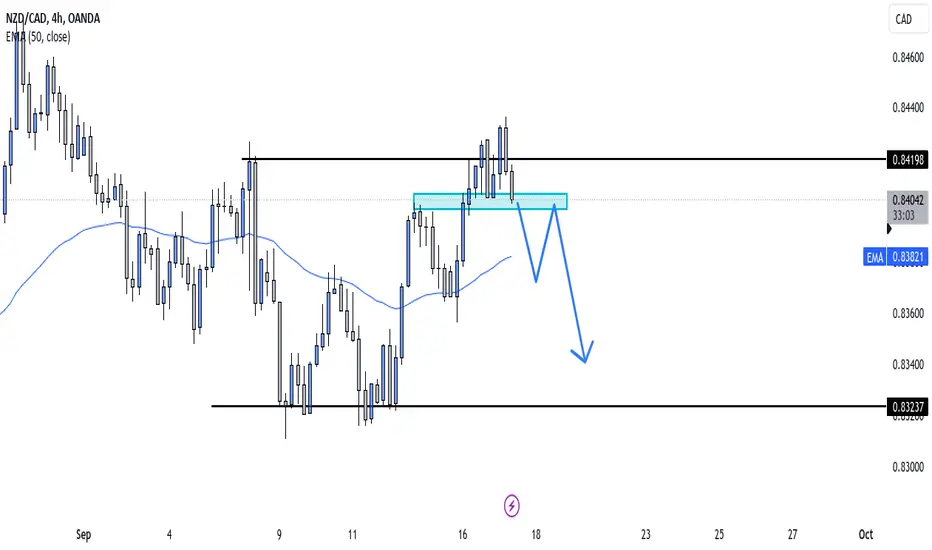
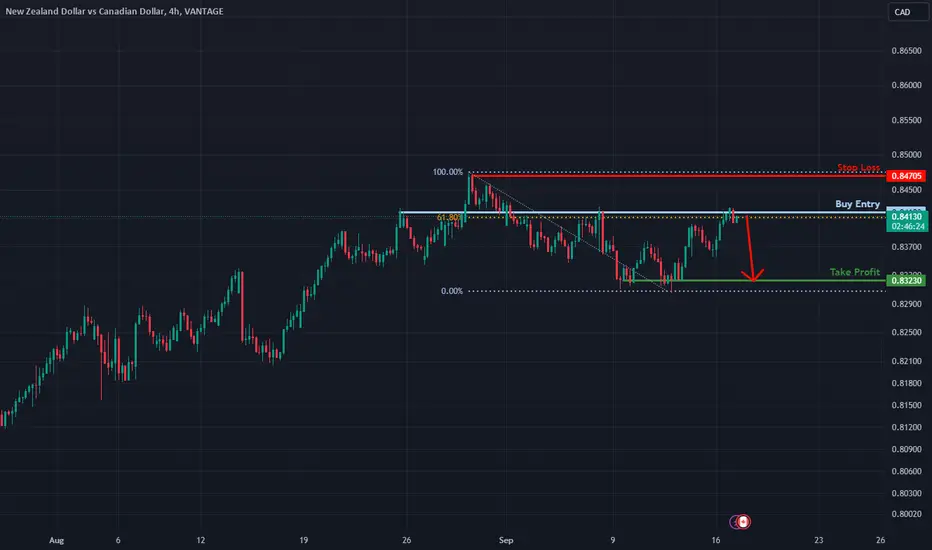
Bearish drop?NZD/CAD is reacting off the resistance level which is an overlap resistance that aligns with the 61.8% Fibonacci retracement and could drop from this level to our take profit.
Entry: 0.84183
Why we like it:
There is an overlap resistance level that lines up with the 61.8% Fibonacci retracement.
Stop loss: 0.84705
Why we like it:
There is a pullback resistance level.
Take profit: 0.83230
Why we like it:
There is a pullback support level.
Enjoying your TradingView experience? Review us!
Please be advised that the information presented on TradingView is provided to Vantage (‘Vantage Global Limited’, ‘we’) by a third-party provider (‘Everest Fortune Group’). Please be reminded that you are solely responsible for the trading decisions on your account. There is a very high degree of risk involved in trading. Any information and/or content is intended entirely for research, educational and informational purposes only and does not constitute investment or consultation advice or investment strategy. The information is not tailored to the investment needs of any specific person and therefore does not involve a consideration of any of the investment objectives, financial situation or needs of any viewer that may receive it. Kindly also note that past performance is not a reliable indicator of future results. Actual results may differ materially from those anticipated in forward-looking or past performance statements. We assume no liability as to the accuracy or completeness of any of the information and/or content provided herein and the Company cannot be held responsible for any omission, mistake nor for any loss or damage including without limitation to any loss of profit which may arise from reliance on any information supplied by Everest Fortune Group.
5 wave correction setupthe correction is on it's 5th wave, we waiting for the price level 0.84267 to be tapped, if we get a sell setup confirmation, we'll take it!!!
NZDCAD BEARISH TRENDAccording to the RSI indicator trend is going to be reversal so i did,t use FIB tool bcz i want to enter the market early and also ignore the candles
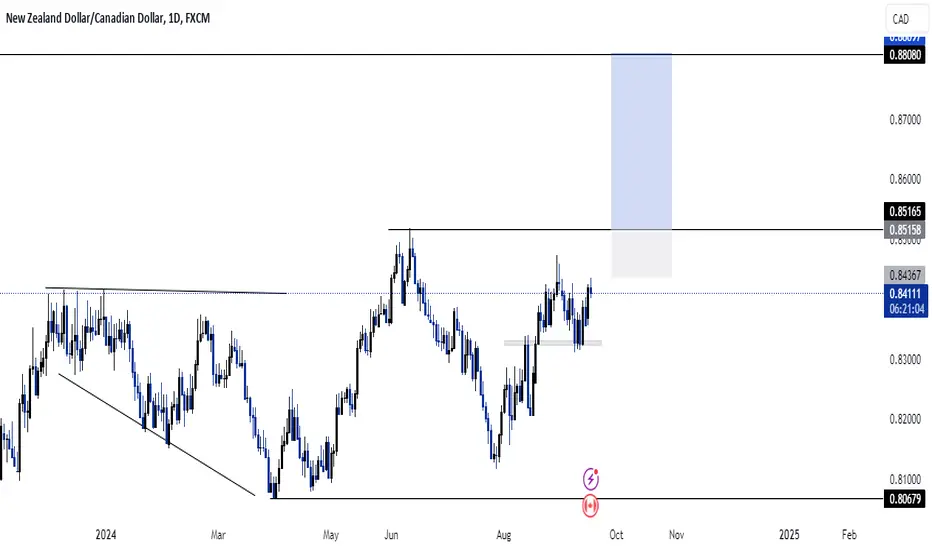
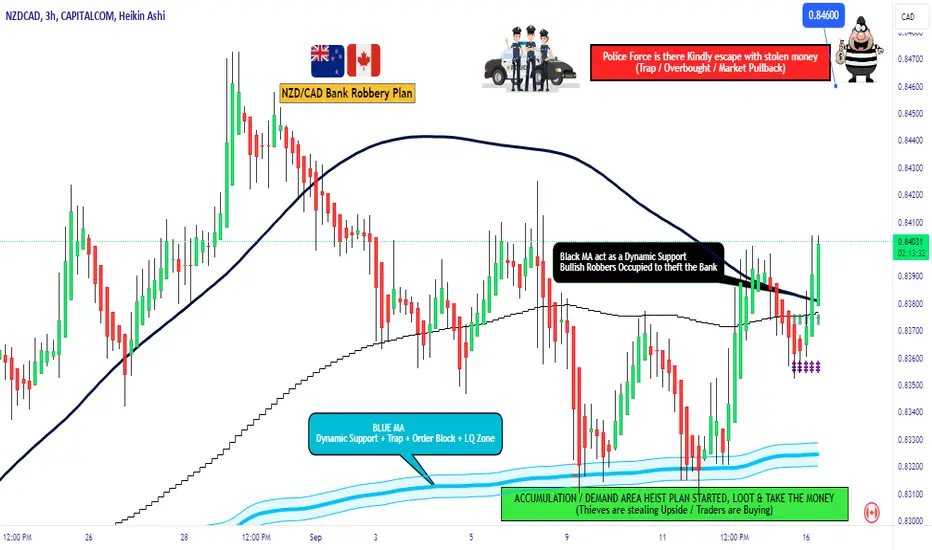
NZDCAD Bank Money Heist Plan on Bullish DirectionHola ola My Dear,
Robbers / Money Makers & Losers,
This is our master plan to Heist NZD/CAD Bank based on Thief Trading style Technical Analysis.. kindly please follow the plan I have mentioned in the chart focus on Long entry. Our target is Red Zone that is High risk Dangerous level, market is overbought / Consolidation / Trend Reversal at the level Bearish Robbers / Traders gain the strength. Be safe and be careful and Be rich.
Attention for Scalpers : If you've got a lot of money you can get out right away otherwise you can join with a swing trade robbers and continue the heist plan, Use Trailing SL to protect our money.
Note: If you've got a lot of money you can get out right away otherwise you can join with a swing trade robbers and continue the heist plan, Use Trailing SL to protect our money.
Entry : Can be taken Anywhere, What I suggest you to Place Buy Limit Orders in 15mins Timeframe Recent / Nearest Swing Low
Stop Loss : Recent Swing Low using 2h timeframe
Warning : Fundamental Analysis comes against our robbery plan. our plan will be ruined smash the Stop Loss. Don't Enter the market at the news update.
Loot and escape on the target 🎯 Swing Traders Plz Book the partial sum of money and wait for next breakout of dynamic level / Order block, Once it is cleared we can continue our heist plan to next new target.
Support our Robbery plan we can easily make money & take money 💰💵 Follow, Like & Share with your friends and Lovers. Make our Robbery Team Very Strong Join Ur hands with US. Loot Everything in this market everyday make money easily with Thief Trading Style.
Stay tuned with me and see you again with another Heist Plan.....
NZDCAD making BULLISH FLAg PATTERNNZDCAD is making FLAG bullish pattern ,but wait for break its pole and take ride,put the stop loss below its last Higher low.and risk according to your capital.
Trade idea - NZDCAD Long4H
Corrective approach towards entry zone.
-68 Fibonacci completion aligning with entry zone.
= Buy limit set.
0.75% risk.

NZDCAD ;Bearish narrativethe train took off . join at any reasonable pull back . much room to the downside still
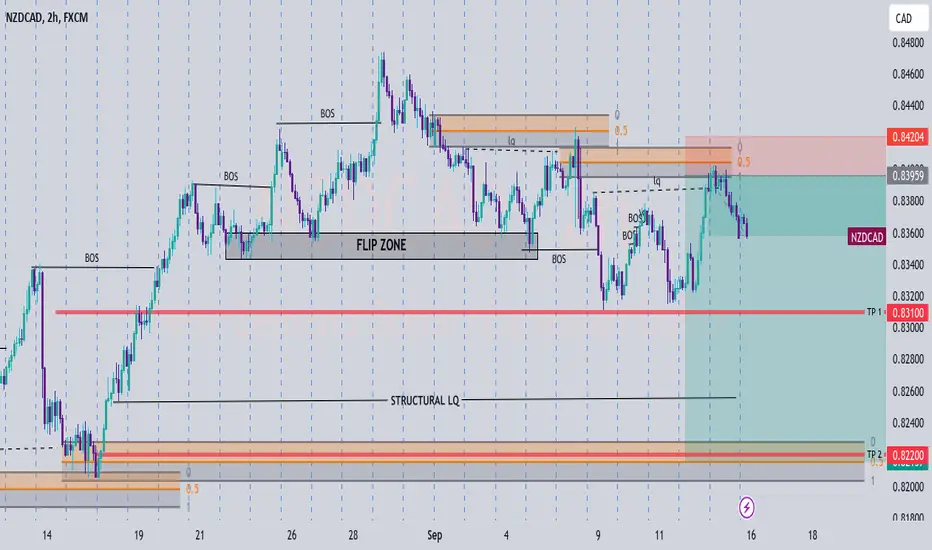
NzdCadI'm personally not a fan of trading tight ranges but the risk:reward still looks solid. I only look for 1:3rr set ups. NzdCad is still bearish so shorts here are definitely possible if we can see a retest on the 1hr. Depending on how the market opens a gain of 45ish pips is possible. At that point I would risk around 15-16 pips for a 1:3rr. I'll definitely be looking for price to break below 0.83200 to continue that bearish run. Daily time frame shows price shifting to the downside so if price does break below 0.83200 we could expect a crash to form a new lower low. The last lower high is on the daily around 0.84100-84000. Weekly candle shows a solid closure below the weekly resistance around 0.83000 as well.
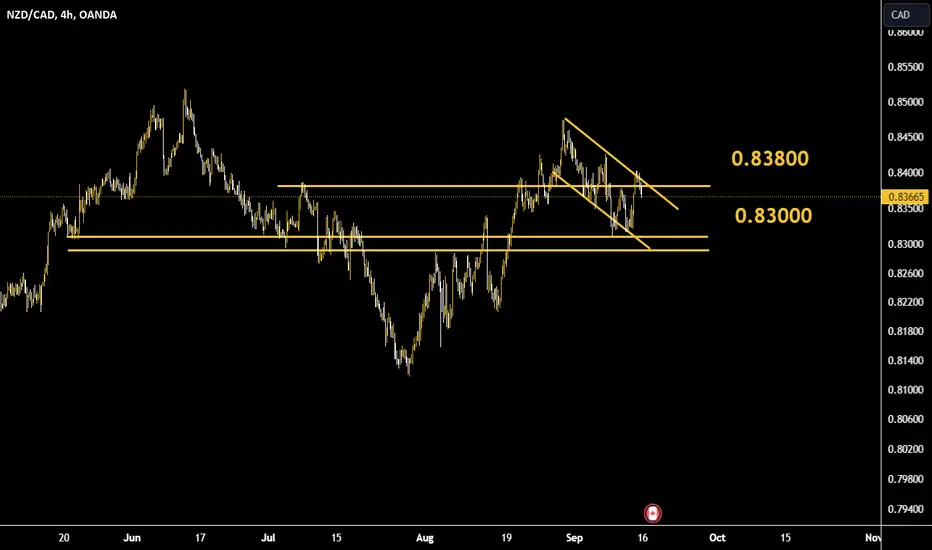
nzd cad trend#nzdcad
downward trend
Price movement in a descending channel
Very important resistance range of 0.8380
We can expect a correction to the support range of 0.83 for the price.
NZDCAD Breakout And Potential RetraceHey Traders, in the coming week we are monitoring NZDCAD for a buying opportunity around 0.83300 zone, NZDCAD was trading in a downtrend and successfully managed to break it out. Currently is in a correction phase in which it is approaching the retrace area at 0.83300 support and resistance area.
Trade safe, Joe.
NZDCAD Will Move Lower! Sell!
Take a look at our analysis for NZDCAD.
Time Frame: 12h
Current Trend: Bearish
Sentiment: Overbought (based on 7-period RSI)
Forecast: Bearish
The market is approaching a significant resistance area 0.838.
Due to the fact that we see a positive bearish reaction from the underlined area, I strongly believe that sellers will manage to push the price all the way down to 0.833 level.
P.S
The term oversold refers to a condition where an asset has traded lower in price and has the potential for a price bounce.
Overbought refers to market scenarios where the instrument is traded considerably higher than its fair value. Overvaluation is caused by market sentiments when there is positive news.
Like and subscribe and comment my ideas if you enjoy them!
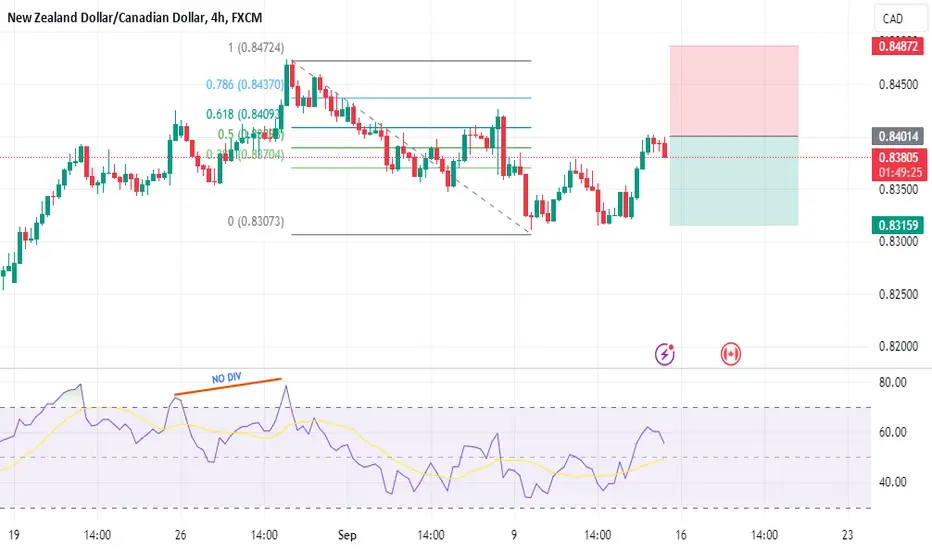
NZDCADWe can attempt to short NZDCAD from specified level as it make LH , also 0.5 FIB level intact , also there is no bullish divergence occur indicate that it moves downward.
SL , TP mention in chart.
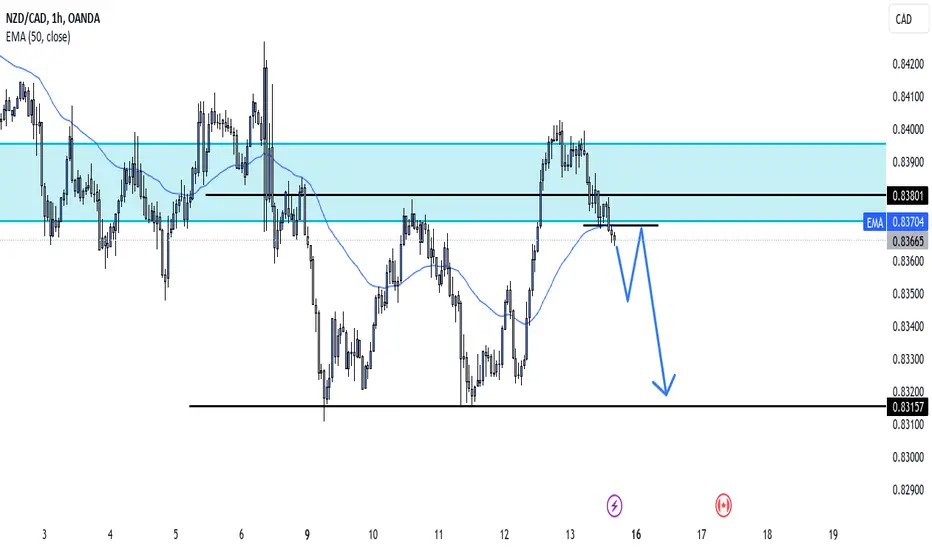
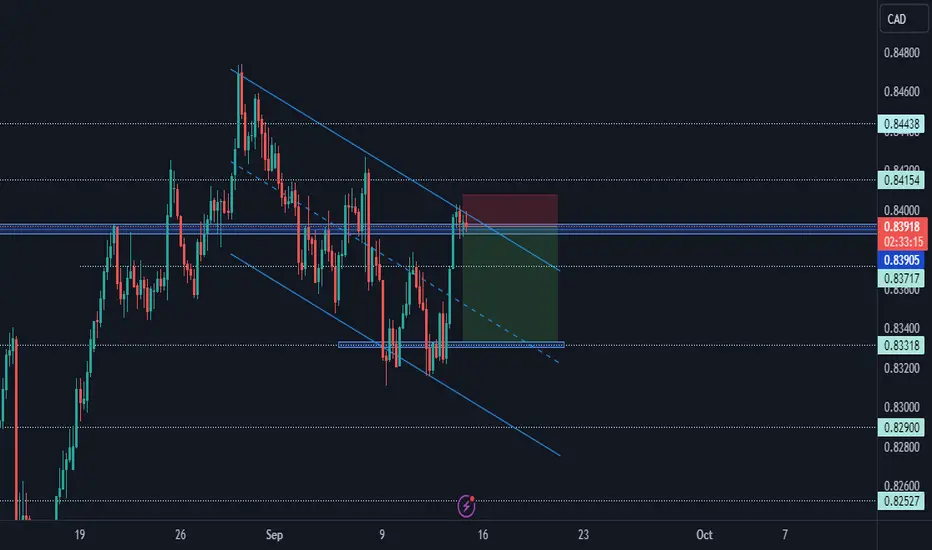
NZDCAD Rejects Resistance: Downtrend Set to Continue?Hey Traders,
OANDA:NZDCAD is showing signs of rejecting a key resistance level at 0.84100, with the price currently pulling back within a descending channel. This setup could indicate the continuation of the downtrend.
Current Market Conditions:
Descending Channel: The pair is moving within a well-defined descending channel, suggesting a continuation of the bearish trend.
Resistance Rejection: NZDCAD has tested and rejected the resistance level at 0.84100, which aligns with the upper boundary of the channel.
Bearish Setup: The rejection at this resistance and the downward momentum within the channel point to further downside potential.
Fundamental Analysis/Outlook:
The New Zealand dollar faces headwinds from weaker domestic economic data and global risk aversion, while the Canadian dollar remains supported by stable oil prices. This divergence could continue to pressure NZDCAD lower.
Targets:
TP1: 0.83717
TP2: 0.83318
TP3: 0.82900
Risk Management:
Stop-Loss: Place a stop-loss above the resistance at 0.84100 to protect against a breakout above the channel.
Conclusion:
NZDCAD appears poised for further downside as it continues to respect the descending channel. Watch for a break below the support levels to confirm the continuation of the bearish trend.
I would love to hear your thoughts in the comment section, and please hit boost and follow for more ideas. Thank you, and profitable trading to you all!
Trading Insight: "In trading, it's not about predicting the future but about reacting to the present."
Heading into 61.8% Fibonacci resistance?NZD/CAD is rising towards the resistance level which is an overlap resistance that aligns with the 61.8% Fibonacci retracement and could reverse from this level to our take profit.
Entry: 0.84183
Why we like it:
There is an overlap resistance level that lines up with the 61.8% Fibonacci retracement.
Stop loss: 0.84705
Why we like it:
There is a pullback resistance level.
Take profit: 0.83230
Why we like it:
There is a pullback support level.
Enjoying your TradingView experience? Review us!
Please be advised that the information presented on TradingView is provided to Vantage (‘Vantage Global Limited’, ‘we’) by a third-party provider (‘Everest Fortune Group’). Please be reminded that you are solely responsible for the trading decisions on your account. There is a very high degree of risk involved in trading. Any information and/or content is intended entirely for research, educational and informational purposes only and does not constitute investment or consultation advice or investment strategy. The information is not tailored to the investment needs of any specific person and therefore does not involve a consideration of any of the investment objectives, financial situation or needs of any viewer that may receive it. Kindly also note that past performance is not a reliable indicator of future results. Actual results may differ materially from those anticipated in forward-looking or past performance statements. We assume no liability as to the accuracy or completeness of any of the information and/or content provided herein and the Company cannot be held responsible for any omission, mistake nor for any loss or damage including without limitation to any loss of profit which may arise from reliance on any information supplied by Everest Fortune Group.
