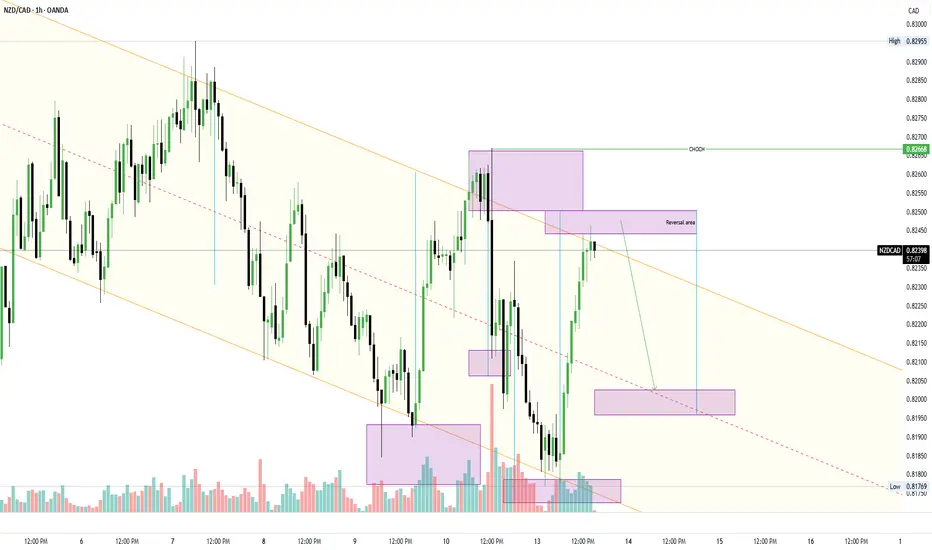
Price action Price has left liquidity above and swiped it currently looking for liquidity to push above
CADNZD trade ideas
NZDCAD buy setup H1Hello! Friends,
Greetings. Please leave a Like if you like the idea.
Before start talking about technical Let's share your LOVE by giving me LIKES to support this work. Thanks in advance.
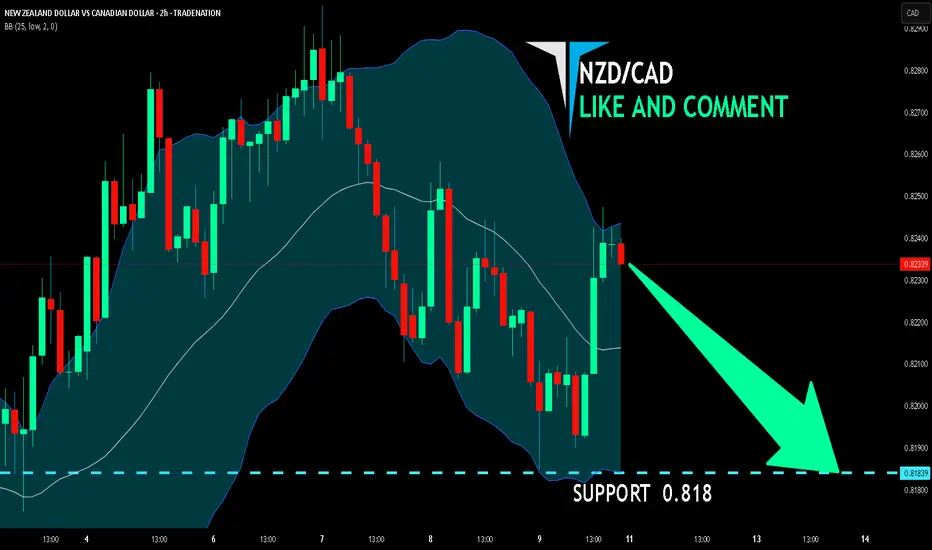
NZD/CAD SHORT FROM RESISTANCE
Hello, Friends!
We are going short on the NZD/CAD with the target of 0.818 level, because the pair is overbought and will soon hit the resistance line above. We deduced the overbought condition from the price being near to the upper BB band. However, we should use low risk here because the 1W TF is green and gives us a counter-signal.
Disclosure: I am part of Trade Nation's Influencer program and receive a monthly fee for using their TradingView charts in my analysis.
✅LIKE AND COMMENT MY IDEAS✅
NZD/CAD For Bullishyou can go long now
or
wait for pull-back near by entry point and then go long
general trend is up trend
have fun :)
NZDCAD sell setup H1Hello! Friends,
Greetings. Please leave a Like if you like the idea.
Before start talking about technical Let's share your LOVE by giving me LIKES to support this work. Thanks in advance.
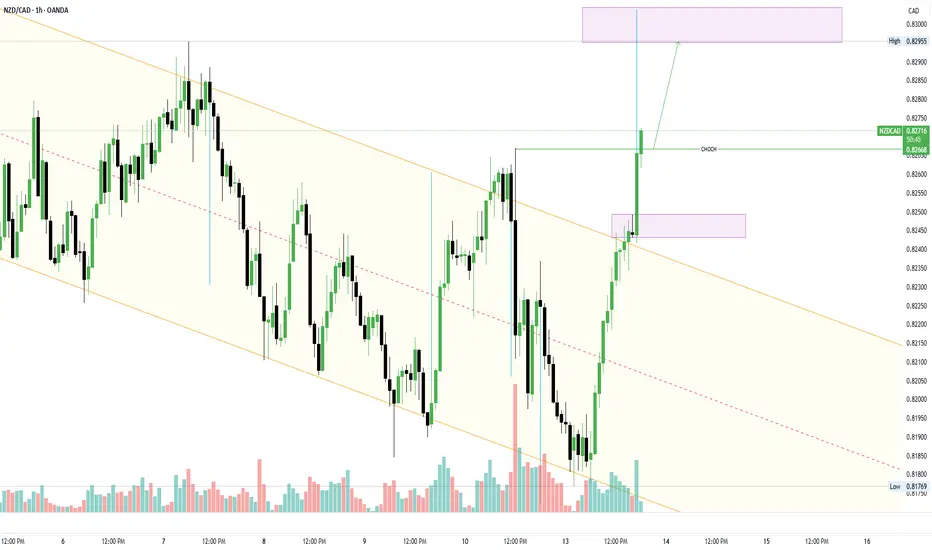
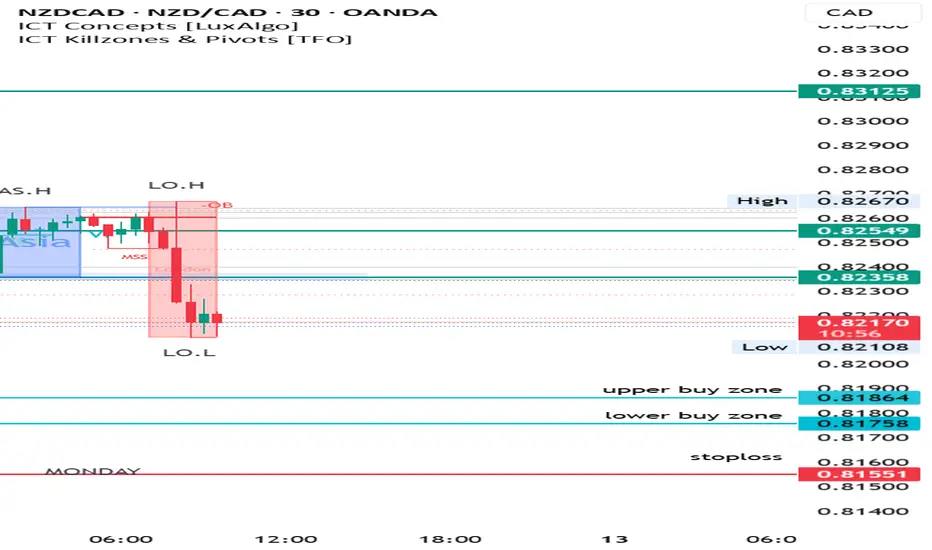
NZD CAD buy zone📊 Trade Breakdown: NZD/CAD Buy Setup 📊
📍 Buy Limit Orders placed at:
🔹 Top of the buy zone
🔹 Mid-zone
🔹 Bottom edge near previous ASL (Asian Session Low)
🎯 Target: Looking for a clean pullback into the London High — watching for that reaction zone to deliver.
🔍 Setup based on classic Supply & Demand + Order Block structure — no noise, just precision trading.
⚖️ Risk Management on point:
Split entries across levels
Defined TP & tight SL
Strong Risk-to-Reward potential
Now it’s all about discipline and execution — let price come to us. 🧘♂️
This is how real traders operate. Stay sharp. 🎯
💬 Got questions? Drop them below. Let’s level up together.
#NZDCAD #ForexSetup #SmartMoneyConcepts #OrderBlocks #SupplyDemand #TradingCommunity #FundedTrader #RiskReward #LearnAndEarn
NZDCAD BUYNZDCAD will go up judging from this inverted head and shoulders pattern. I am eyeing 0,82666 as a final target.

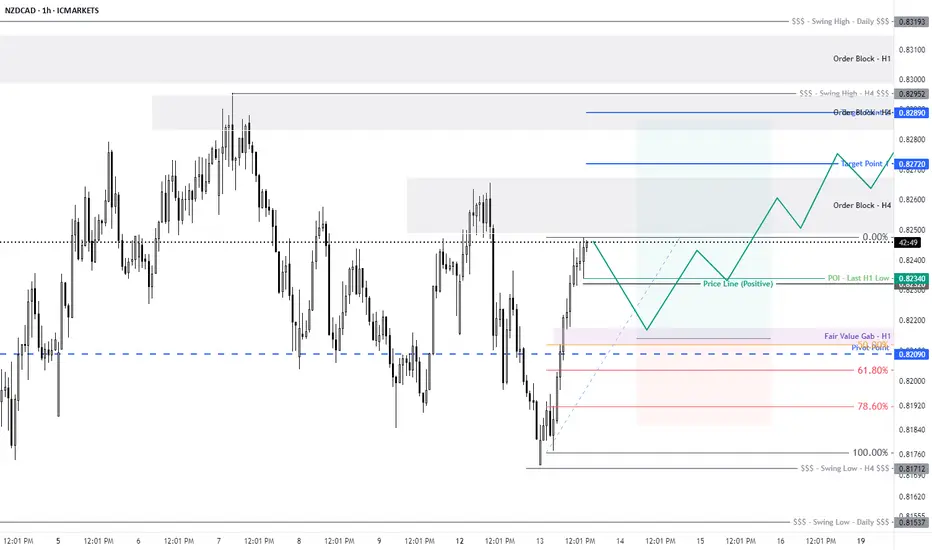
NZDCAD buy setup Following Price Order flow and structural pattern, we can deduce that price is in a demand.
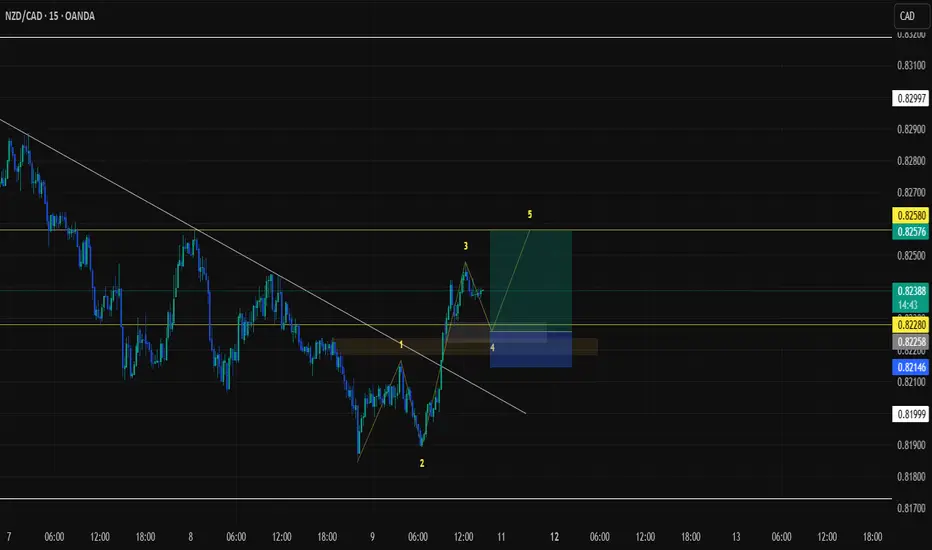
OK????I'm currently monitoring a potential Wave 5 setup, but Wave 4 is still unfolding. The market has completed Waves 1 through 3 with clear impulsive behavior, and now it's in a corrective phase, forming Wave 4 — likely a complex correction or a running flat.
What's interesting here is that price is retracing into a zone filled with clean, well-structured bullish order blocks on the H1 and H4 timeframes. These OBs are aligned with premium Fibonacci retracement levels (61.8%-78.6%) and are showing early signs of absorption and rejection, suggesting institutional interest.
Once Wave 4 completes and we get a valid BOS or CHoCH to the upside, I’ll be looking for a high-probability long entry from within the refined OB zone. The goal is to catch the beginning of Wave 5, ideally aiming for a new high or an extended fifth.
This setup blends Elliott Wave theory with smart money concepts, offering a confluence-rich, high R:R opportunity if confirmed.
NZD/CAD For Bullishyou can go long now
or
wait for pull-back near by entry point and then go long
general trend is up trend
have fun :)

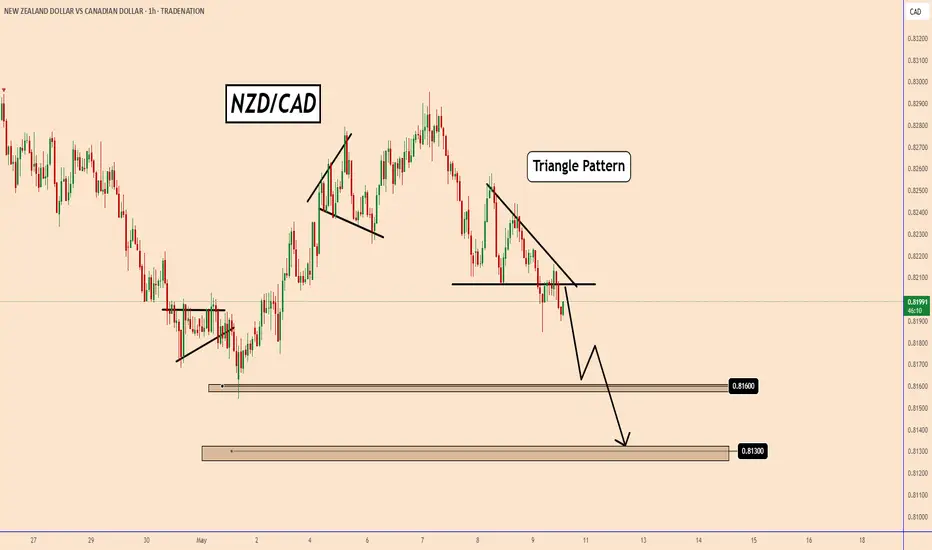
NZDCAD: Short-Term Bearish OutlookNZDCAD: Short-Term Bearish Outlook
Today, Canada will release its employment data. Analysts expect job numbers to rise by 2.5k, compared to last month’s sharp decline of -32.6k. The unemployment rate is also expected to edge up slightly to 6.8% from 6.7%.
If the job report shows improvement, it could strengthen the bearish momentum for NZDCAD.
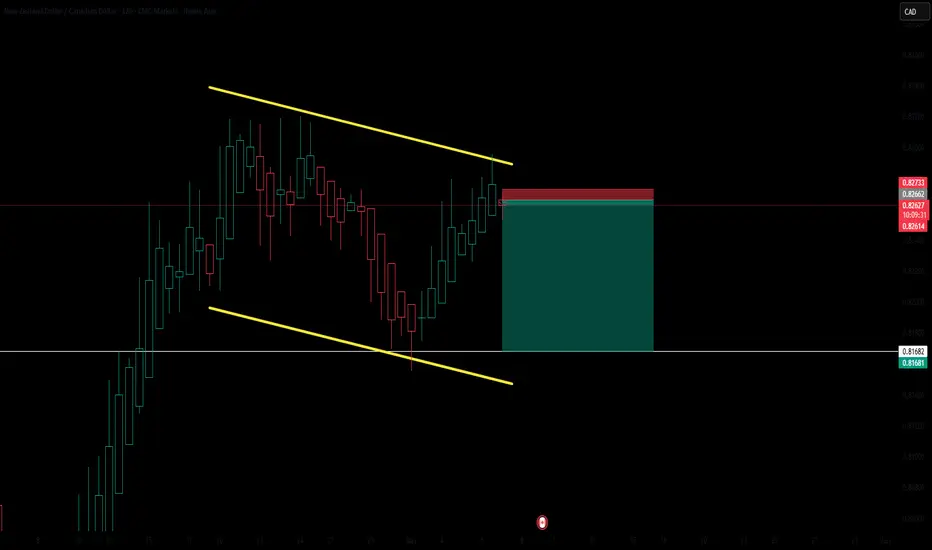
From a technical perspective, NZDCAD has broken out of a triangle pattern, signaling increased downside pressure. The employment data could act as a catalyst for further movement.
Key levels to watch:
0.8160 – A strong zone where price might find support
0.8130 – The next target if the bearish trend continues
You may find more details in the chart!
Thank you and Good Luck!
❤️PS: Please support with a like or comment if you find this analysis useful for your trading day❤️
Disclosure: I am part of Trade Nation's Influencer program and receive a monthly fee for using their TradingView charts in my analysis.
NZD/CAD For Bullishyou can long now
or
wait for pull-back near by entry point and then go long
general trend is up trend
have fun :)
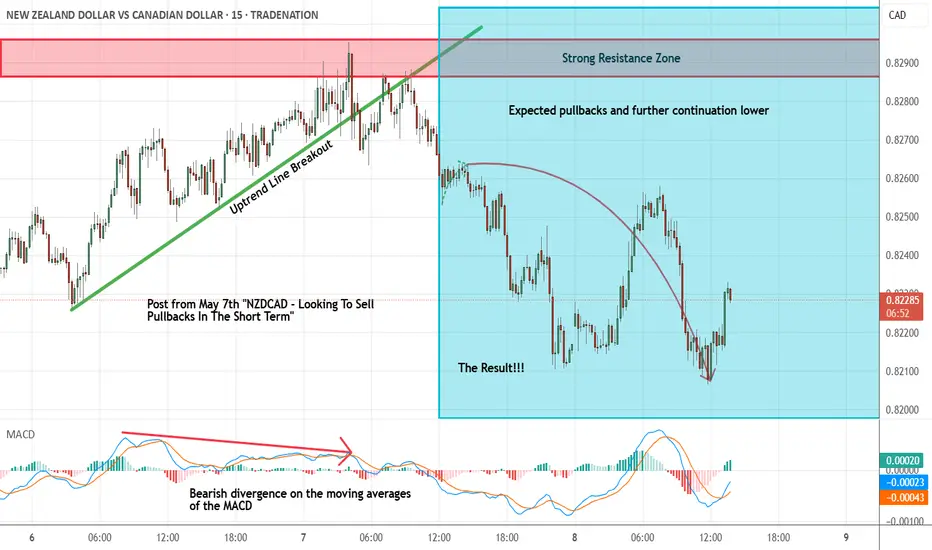
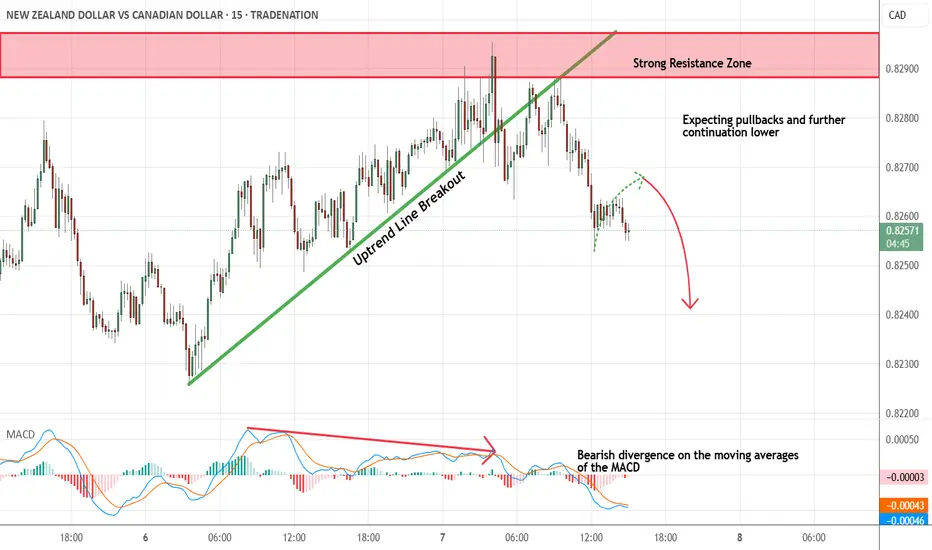
NZDCAD - Short Term Sell Trade Update!!!Hi Traders, on May 7th I shared this idea "NZDCAD - Looking To Sell Pullbacks In The Short Term"
I expected to see retraces and further continuation lower. You can read the full post using the link above.
Retrace and push lower happened as per the plan!!!
If you enjoy this idea, don’t forget to LIKE 👍, FOLLOW ✅, SHARE 🙌, and COMMENT ✍! Drop your thoughts and charts below to keep the discussion going. Your support helps keep this content free and reach more people! 🚀
-------------------------------------------------------------------------------------------------------------------
Disclosure: I am part of Trade Nation's Influencer program and receive a monthly fee for using their TradingView charts in my analysis.
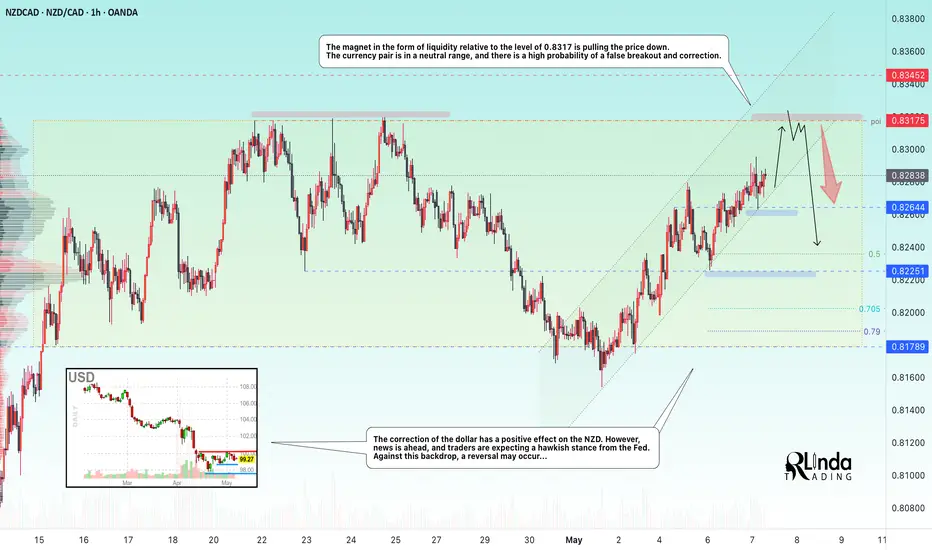
NZDCAD → Intra-range trading. Retest of resistanceFX:NZDCAD is strengthening within a neutral trading range. The currency pair is supported by the dollar's correction, but how long will this last? Ahead of us are the FOMC meeting and Powell's speech...
The focus is on the trading range within which the currency pair continues its local trend. Liquidity around the 0.8317 level is attracting the price. The correction of the dollar is having a positive effect on the NZD. However, news is ahead, and traders are expecting a hawkish stance from the Fed. Against this backdrop, a reversal may occur...
Since the currency pair is in a neutral range, there is a high probability of a false breakout and correction.
Resistance levels: 0.83175
Support levels: 0.82644, 0.8235, 0.8225
The liquidity zone is likely to stop the price (temporarily or reverse it). Further movement depends on fundamental sentiment, but based on rumors about the Fed's position, it is worth carefully analyzing what data the market will receive this evening. A tougher Fed policy or hints of one could strengthen the dollar and weaken currencies...
Best regards, R. Linda!
NZDCAD - Looking To Sell Pullbacks In The Short TermM15 - Bearish divergence followed by the most recent uptrend line breakout.
No opposite signs.
Currently it looks like a pullback is happening.
Expecting bearish continuation until the strong resistance zone holds.
If you enjoy this idea, don’t forget to LIKE 👍, FOLLOW ✅, SHARE 🙌, and COMMENT ✍! Drop your thoughts and charts below to keep the discussion going. Your support helps keep this content free and reach more people! 🚀
--------------------------------------------------------------------------------------------------------------------
Disclosure: I am part of Trade Nation's Influencer program and receive a monthly fee for using their TradingView charts in my analysis.
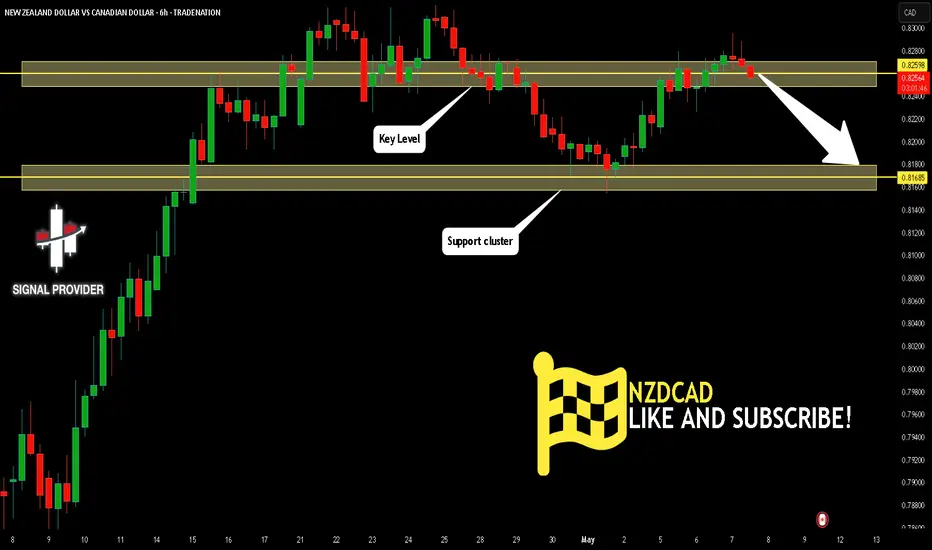
NZDCAD Will Go Lower! Short!
Here is our detailed technical review for NZDCAD.
Time Frame: 6h
Current Trend: Bearish
Sentiment: Overbought (based on 7-period RSI)
Forecast: Bearish
The market is trading around a solid horizontal structure 0.825.
The above observations make me that the market will inevitably achieve 0.816 level.
P.S
Please, note that an oversold/overbought condition can last for a long time, and therefore being oversold/overbought doesn't mean a price rally will come soon, or at all.
Disclosure: I am part of Trade Nation's Influencer program and receive a monthly fee for using their TradingView charts in my analysis.
Like and subscribe and comment my ideas if you enjoy them!
NZDCAD: Bearish Continuation is Expected! Here is Why:
The recent price action on the NZDCAD pair was keeping me on the fence, however, my bias is slowly but surely changing into the bearish one and I think we will see the price go down.
Disclosure: I am part of Trade Nation's Influencer program and receive a monthly fee for using their TradingView charts in my analysis.
❤️ Please, support our work with like & comment! ❤️
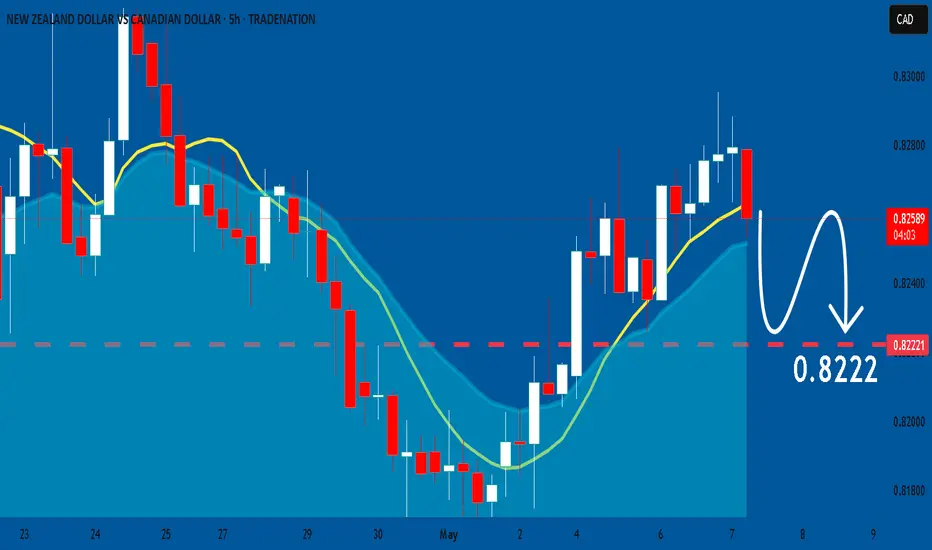
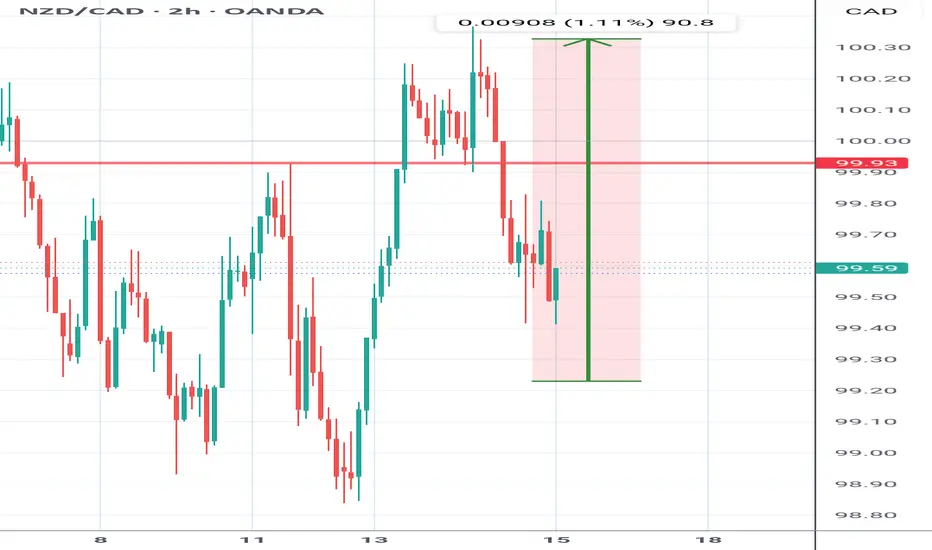
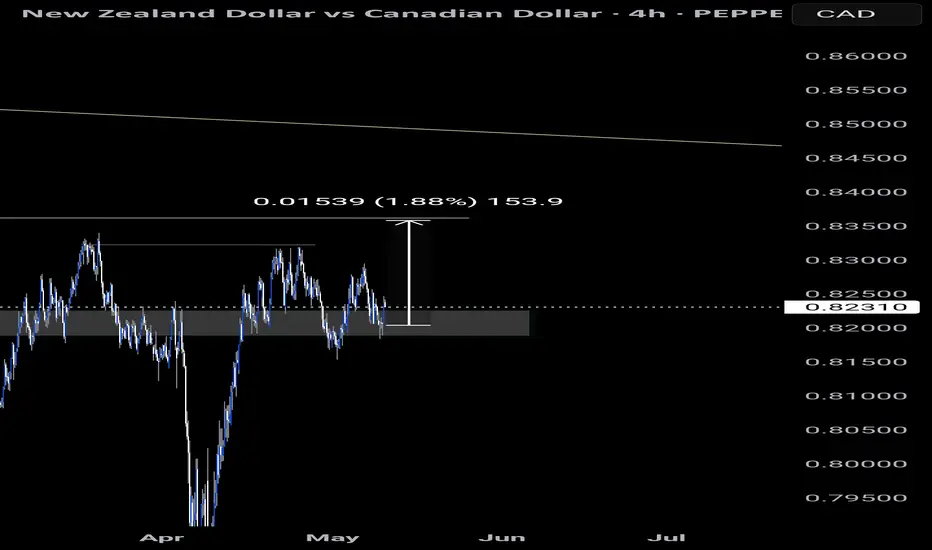
NZDCAD Sell to 0.816?There is a potential sell on the 4 hour chart.
I expect NZD CAD to start declining to at least 0.817
Stop loss: 0.8273
TP : Around 0.817
NZDCAD – Range Play, Resistance RetestNZDCAD – Consolidation Within Neutral Range as Market Eyes Fed Developments
The NZDCAD currency pair is currently exhibiting strength within the confines of a well-defined neutral trading range. This stabilization is largely underpinned by the recent corrective pullback in the U.S. dollar, which has provided short-term support for the New Zealand dollar. However, questions remain about the sustainability of this momentum, especially with significant macroeconomic events looming on the horizon — most notably, the Federal Open Market Committee (FOMC) meeting and the subsequent speech by Federal Reserve Chair Jerome Powell.
At present, NZDCAD is trading within a localized range, and price action is gravitating toward the key liquidity zone around the 0.8317 level. This area has become a focal point for market participants, as it represents a notable level of interest where prior price reactions have occurred. The pullback in the U.S. dollar has temporarily shifted sentiment in favor of the NZD, but this may prove short-lived depending on upcoming policy signals from the Federal Reserve.
From a technical standpoint, the currency pair is constrained between strong resistance at 0.83175 and a cluster of support levels located at 0.82644, 0.8235, and 0.8225. The proximity of these levels reinforces the neutral bias and increases the likelihood of short-term whipsaws or potential false breakouts. Traders should exercise caution in positioning aggressively within this zone, particularly ahead of fundamental catalysts that could swiftly reshape market dynamics.
Market sentiment is increasingly focused on the tone and direction of Fed policy. Should the FOMC or Chair Powell deliver signals that point toward a more hawkish policy trajectory — whether through immediate action or forward guidance — the U.S. dollar could regain strength rapidly. This would likely exert downward pressure on NZDCAD, potentially driving the pair back toward the lower bounds of its trading range or beyond.
Conversely, any dovish surprises or indications of policy patience could extend the current reprieve for the NZD, enabling a continued challenge of the upper resistance area. However, given prevailing expectations for a firm stance by the Fed amid ongoing inflationary concerns, the market is pricing in a scenario where dollar strength could reassert itself — possibly leading to a reversal in NZDCAD’s recent strength.
In conclusion, while NZDCAD remains technically range-bound for now, the landscape is ripe for volatility. The confluence of resistance near 0.8317 and heightened anticipation around Fed-related news points to a critical juncture for this pair. Traders should monitor price action closely, remain aware of potential false breakouts, and align short-term strategies with the broader macro narrative that will emerge following the FOMC decision and Powell’s speech.
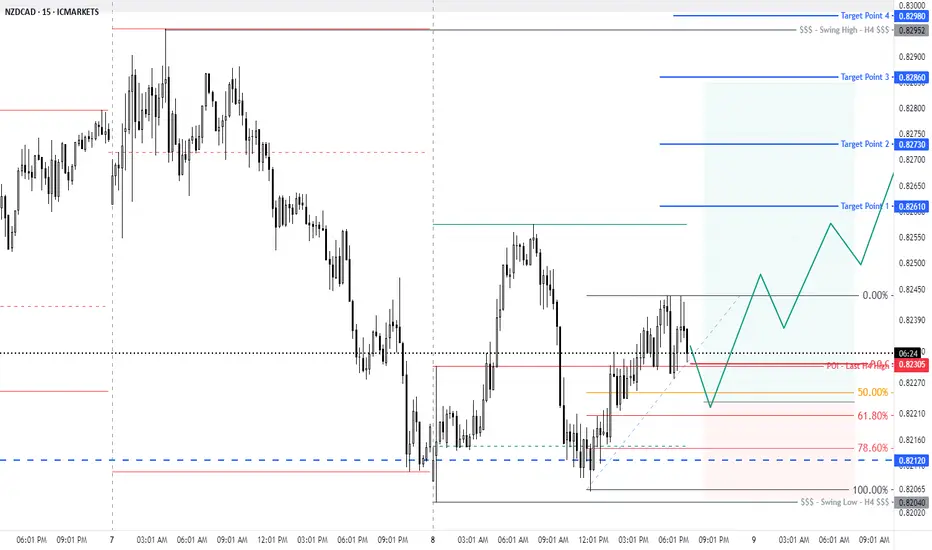
NZDCAD – 15M Technical & Fundamental AnalysisNZDCAD – 15M Technical & Fundamental Analysis
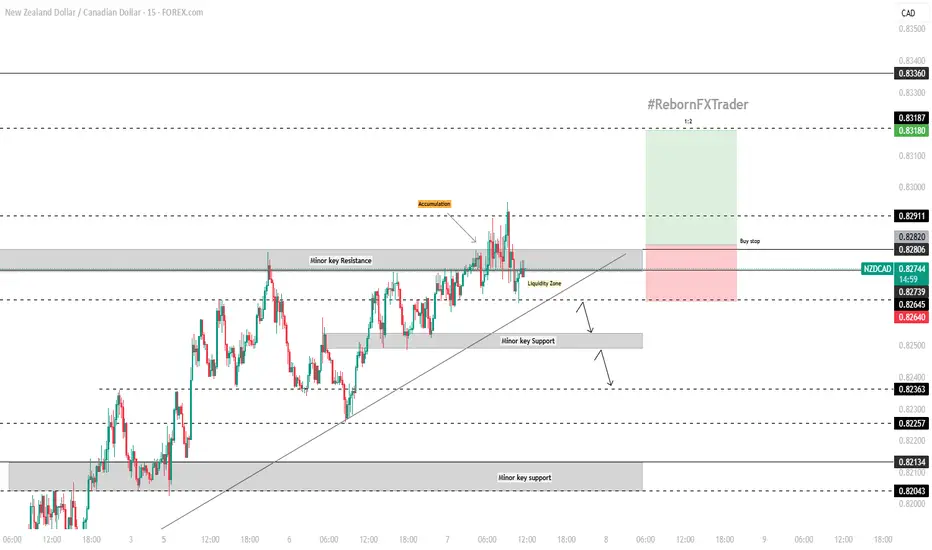
On the 15-minute chart, NZDCAD has been consistently forming higher highs and higher lows, showing bullish momentum until price reached and broke through the minor key resistance at 0.82800.
Following the breakout, price accumulated buy orders above this level, forming a liquidity trap. After the accumulation phase, the market moved downward into the liquidity zone to hunt for stop orders. Now, price is showing signs of recovery and is preparing for a potential breakout move.
Our area of interest lies at 0.82820 for a buy stop entry, joining the bullish momentum.
Our risk management is placed at 0.82640 (below the liquidity zone), and the target is a potential move toward 0.90650.
Fundamental Analysis:
Positive NZD News:
New Zealand’s Unemployment Rate came in stronger than expected at 5.1% (forecast: 5.3%), indicating a healthier labor market. This supports NZD strength and investor sentiment.
Weak CAD Outlook:
The Canadian Dollar remains pressured due to disappointing economic indicators, including sluggish growth and weakening oil prices—both of which tend to weigh heavily on the CAD.
Moreover, the Bank of Canada’s dovish stance has reduced expectations for any immediate tightening, further dampening the CAD's appeal.
Summary:
With bullish technical structure and positive fundamentals supporting the NZD, alongside a softening CAD outlook, NZDCAD is well-positioned for a continued upward move. Traders may monitor price action closely near 0.82820 for a potential breakout opportunity.
📌 Disclaimer:
This is not financial advice. As always, wait for proper confirmation before executing trades. Manage your risk wisely and trade what you see, not what you feel.
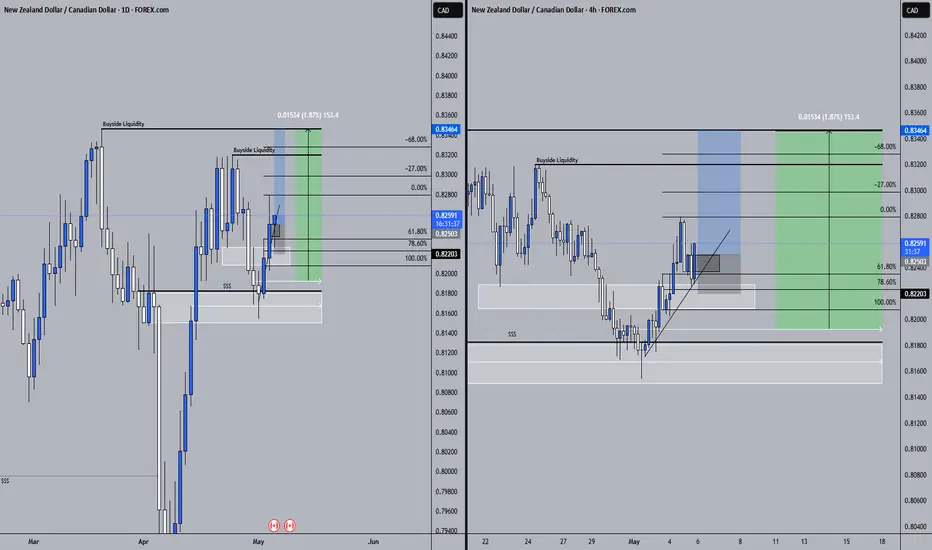
NZDCAD 05/05/2025Weekly:
-Liquidity sweep.
-FGV.
-OB.
Daily:
-Inverse H&S pattern.
-IC.
-Bullish daily candle.
4H:
-Bullish M pattern.
-Inverse H&S pattern.
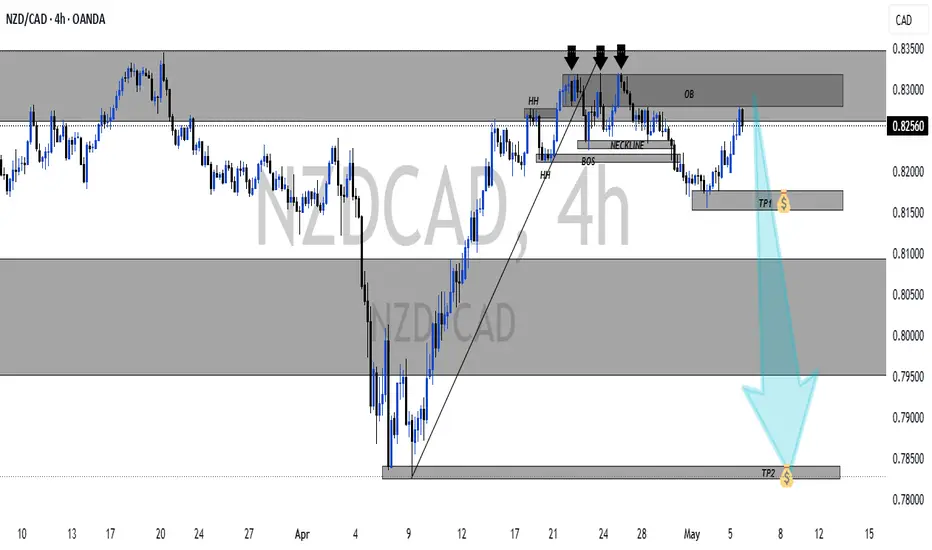
WE MIGHT HAVE A BEARISH TRENDNZDCAD has created a reversal pattern: triple top and broke the neckline and also the prev. HL which all confirm an end of a bullish trend/change.
NB:NO REVERSAL PATTERNS NO ENTRY
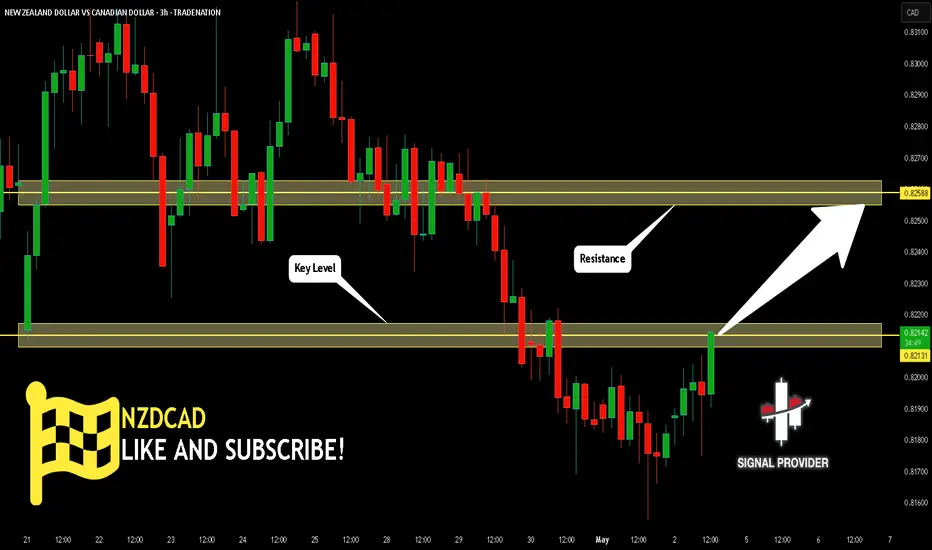
NZDCAD Will Go Higher! Buy!
Please, check our technical outlook for NZDCAD.
Time Frame: 3h
Current Trend: Bullish
Sentiment: Oversold (based on 7-period RSI)
Forecast: Bullish
The price is testing a key support 0.821.
Current market trend & oversold RSI makes me think that buyers will push the price. I will anticipate a bullish movement at least to 0.825 level.
P.S
The term oversold refers to a condition where an asset has traded lower in price and has the potential for a price bounce.
Overbought refers to market scenarios where the instrument is traded considerably higher than its fair value. Overvaluation is caused by market sentiments when there is positive news.
Disclosure: I am part of Trade Nation's Influencer program and receive a monthly fee for using their TradingView charts in my analysis.
Like and subscribe and comment my ideas if you enjoy them!