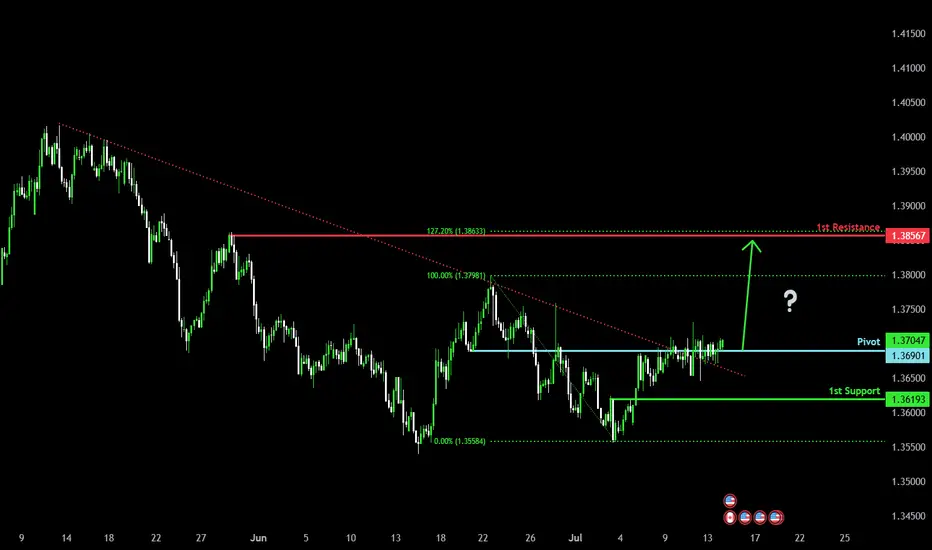
Potential bullish rise?The Loonie (USD/CAD) is reacting off the pivot and could rise to the 1st resistance which is a pullback resistance that aligns with the 127.2% Fibonacci extension.
Pivot: 1.3690
1st Support: 1.3619
1st Resistance: 1.3856
Risk Warning:
Trading Forex and CFDs carries a high level of risk to your capital and you should only trade with money you can afford to lose. Trading Forex and CFDs may not be suitable for all investors, so please ensure that you fully understand the risks involved and seek independent advice if necessary.
Disclaimer:
The above opinions given constitute general market commentary, and do not constitute the opinion or advice of IC Markets or any form of personal or investment advice.
Any opinions, news, research, analyses, prices, other information, or links to third-party sites contained on this website are provided on an "as-is" basis, are intended only to be informative, is not an advice nor a recommendation, nor research, or a record of our trading prices, or an offer of, or solicitation for a transaction in any financial instrument and thus should not be treated as such. The information provided does not involve any specific investment objectives, financial situation and needs of any specific person who may receive it. Please be aware, that past performance is not a reliable indicator of future performance and/or results. Past Performance or Forward-looking scenarios based upon the reasonable beliefs of the third-party provider are not a guarantee of future performance. Actual results may differ materially from those anticipated in forward-looking or past performance statements. IC Markets makes no representation or warranty and assumes no liability as to the accuracy or completeness of the information provided, nor any loss arising from any investment based on a recommendation, forecast or any information supplied by any third-party.
CADUSD trade ideas
USDCAD Analysis (4H TF)USDCAD Analysis (4H TF)
The market has been in a strong downtrend, clearly marked by multiple Break of Structure (BOS). However, we’re now seeing signs of accumulation at the lower levels, with multiple CHoCH (Change of Character) signaling a possible trend shift.
Price is currently consolidating around 1.3700, tapping into previous supply and demand zones. If the bullish structure holds, we could see a continuation upward toward the next resistance.
What I’m watching:
- A clear breakout and retest above the 1.3730 zone
- Bullish confirmation before entering
- Tight risk management, as we’re still inside a larger descending channel
Trade idea: Wait for a clean breakout or a reaction from the supply zone. Let the market confirm your bias.

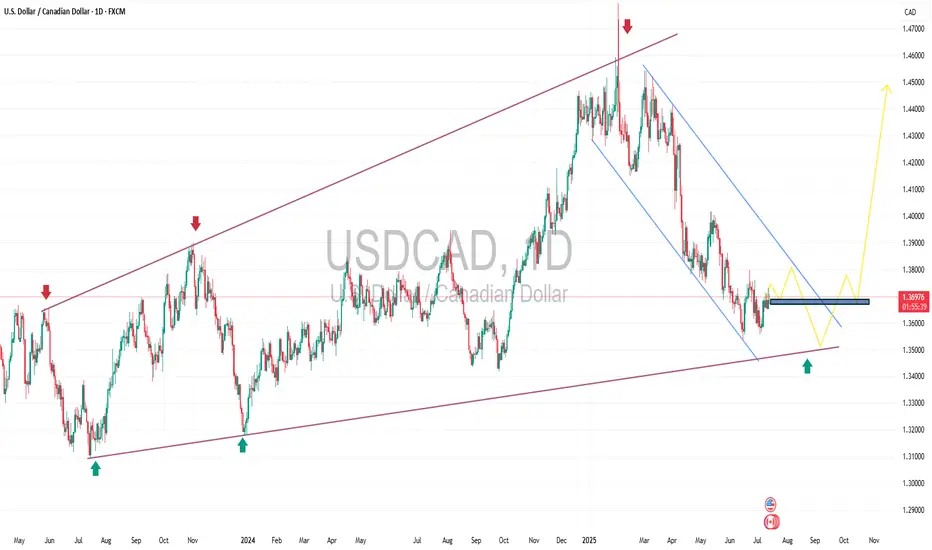
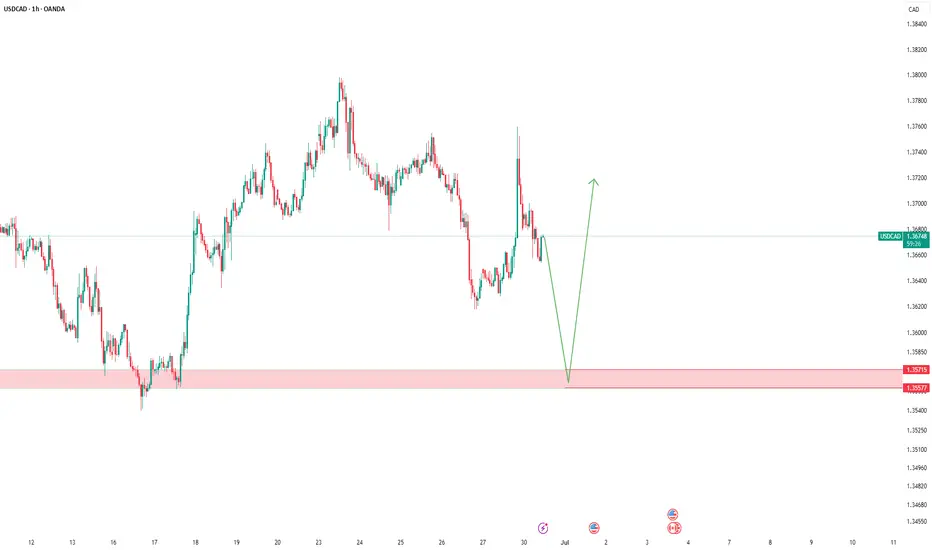
USDCADwe see price trading inside a channel , and we have downtrend inside channel were expecting breakout and retest and long term BUY
USDCAD still bullish?
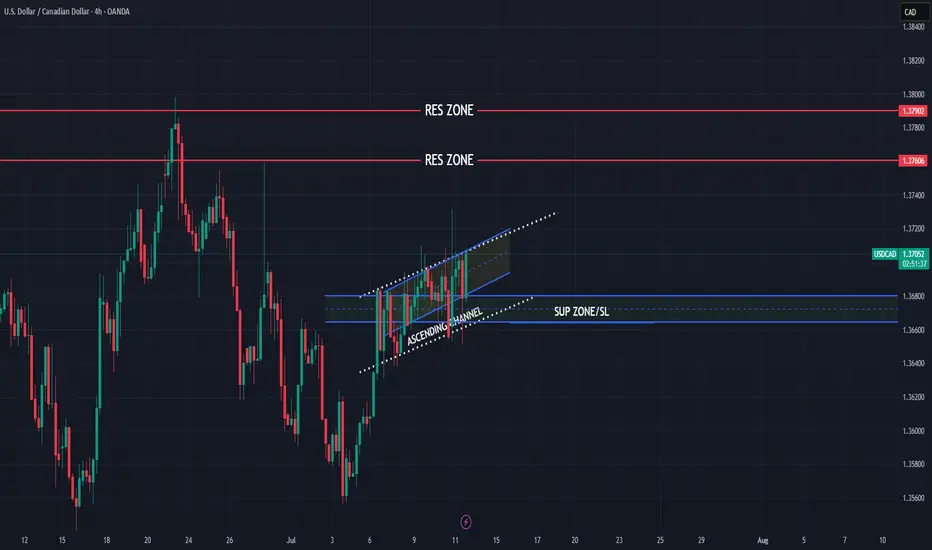
OANDA:USDCAD what's next, we are have bullish push, currently price in ASCENDING CHANNEL and in ascending channel is visible and one more ASCENDING CHANNEL (marked yelow), interesting chart,- can we see higher bullish push?
SUP zone: 1.36800
RES zone: 1.37600, 1.37900
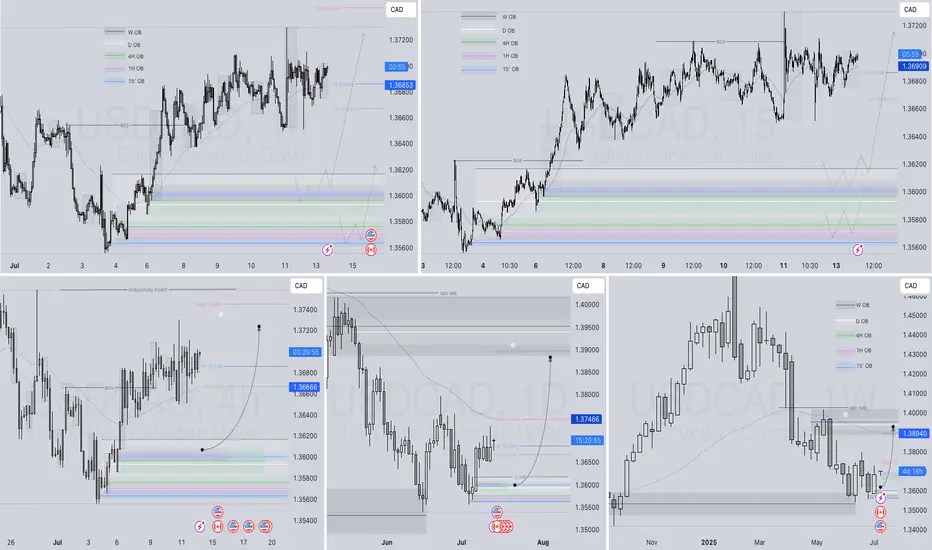
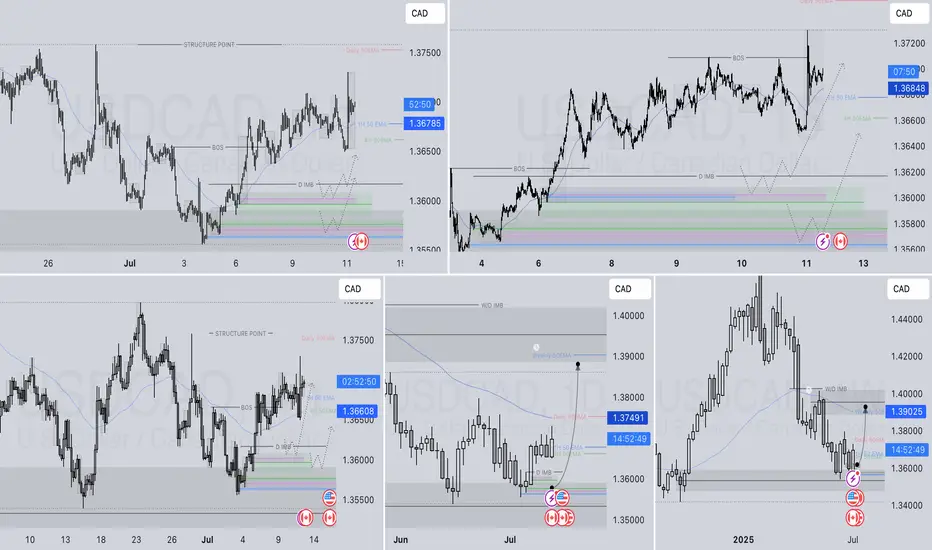
USDCAD LONG DAILY FORECAST Q3 D14 W29 Y25USDCAD LONG DAILY FORECAST Q3 D14 W29 Y25
Professional Risk Managers👋
Welcome back to another FRGNT chart update📈
Diving into some Forex setups using predominantly higher time frame order blocks alongside confirmation breaks of structure.
Let’s see what price action is telling us today! 👀
💡Here are some trade confluences📝
✅Daily Order block identified
✅4H Order Block identified
✅1H Order Block identified
📈 Risk Management Principles
🔑 Core Execution Rules
Max 1% risk per trade — protect your capital, preserve your edge
Set alerts — let price come to your levels, not the other way around
Minimum 1:2 RR — if the reward doesn’t justify the risk, it’s not worth it
Focus on process, not outcomes — the outcome is random, your process is not
🧠 Remember: The edge lies in execution, not prediction. Your strategy is only as good as your discipline to follow it.
🧠 FRGNT Insight of the Day
"The market rewards structure and patience — not emotion or urgency."
Execute like a robot. Manage risk like a pro. Let the chart do the talking.
🏁 Final Words from FRGNT
📌 USDCAD is offering textbook alignment — structure, order flow, and confirmation are all in place.
📌 The opportunity is there — now it’s about how you show up to execute.
🎯 Trade with clarity. Act with conviction. Manage with precision.
🔑 Remember, to participate in trading comes always with a degree of risk, therefore as professional risk managers it remains vital that we stick to our risk management plan as well as our trading strategies.
📈The rest, we leave to the balance of probabilities.
💡Fail to plan. Plan to fail.
🏆It has always been that simple.
❤️Good luck with your trading journey, I shall see you at the very top.
🎯Trade consistent, FRGNT X
USDCAD BEARISH Likely Slow drift downward, unless oil spikes.
Caution:
U.S. data later in the week (like CPI) could reverse the move.
For now, the path of least resistance is lower for USD/CAD, possibly toward

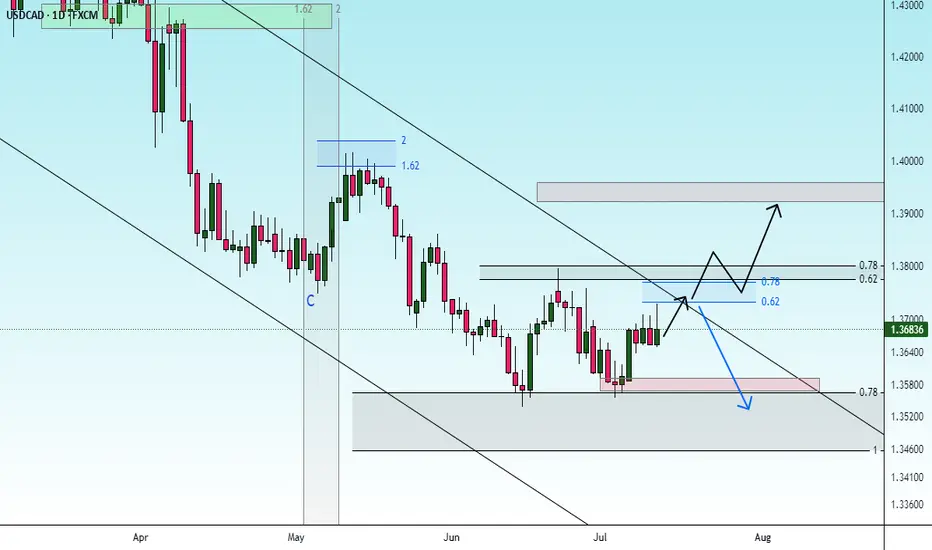
possibility of uptrendConsidering the price behavior in the current resistance range, possible scenarios have been identified. With the resistance range broken and stabilized above, a continuation of the upward trend is likely.
SDCAD 4H – Compression at Resistance📉📈 USDCAD 4H – Compression at Resistance | Breakout or Rejection?
Price is consolidating near a major supply zone inside a wedge structure.
We're at a key decision point: a clean breakout above 1.3750 = bullish continuation; a rejection and break of minor trendline support = bearish drop back to demand.
🧠 TCB Strategy in play: waiting for breakout confirmation or reversal candle.
Long above 1.3750 → Target 1.3840
Short below 1.3660 → Target 1.3560
🎯 High RRR in both directions.

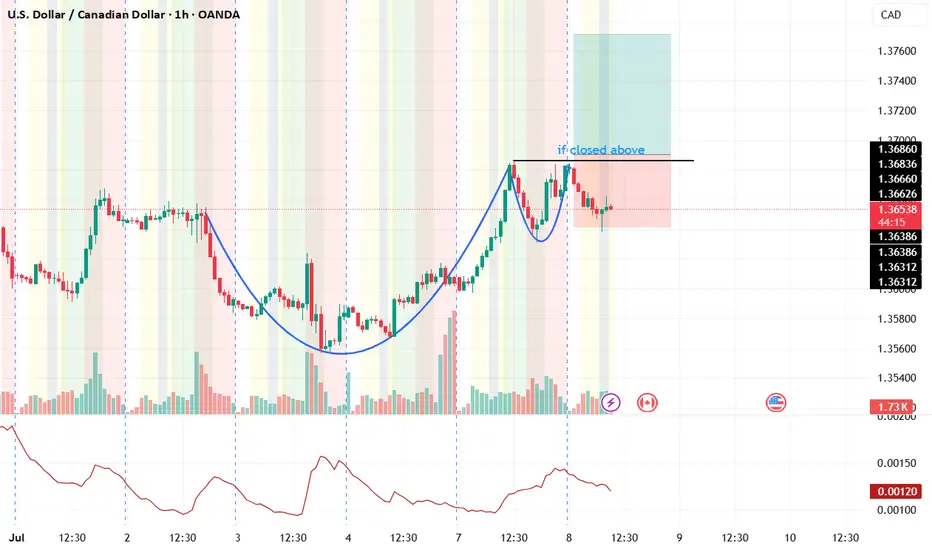
usd cad cup and handleit seems the handle is broken and if you touch the body you may burn your hand, for archiving the matter im doing this idea feel free to comment and share your ideas
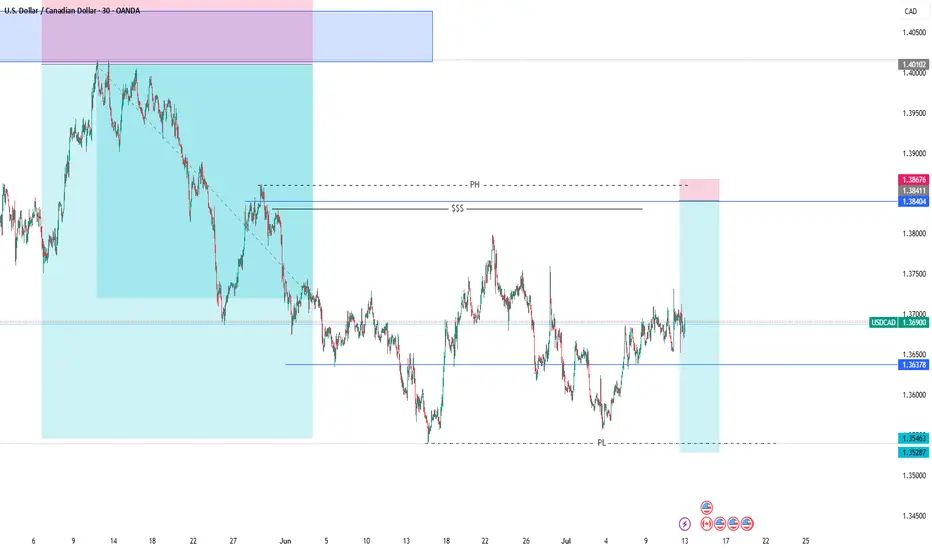
USD Dollar Canadian Dollar AnalysisThe US dollar is gaining strength due to Trump tarrif polices but the strength will be short live. The downward movement might continue around 1.38404 with a stop loss of 1.38676 and take profit of 1.35287
USD/CAD - Potential TargetsDear Friends in Trading,
How I see it,
PIVOT AREA @ 1.37000 - 1.37208
1) Pair is under fundamental pressure at this time.
2) We need a strong breach above PIVOT area to signal any
chance for broader bullish price action.
Keynote:
1.35775 = Key Demand
I sincerely hope my point of view offers a valued insight.
Thank you for taking the time to study my analysis.
Beautiful Long USDCAD is getting ready next weekI love this pair once I will see a break and retest of the level I will place my order long.
In the moment it is on the POC level so it will be soon go long. I am looking for the engulfing pattern to sit on my level and I am going to teke the trade.
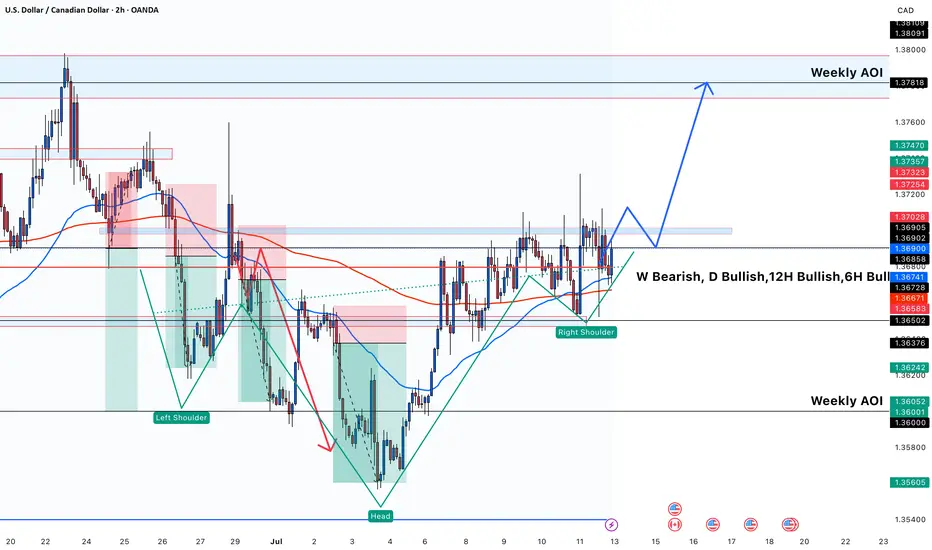
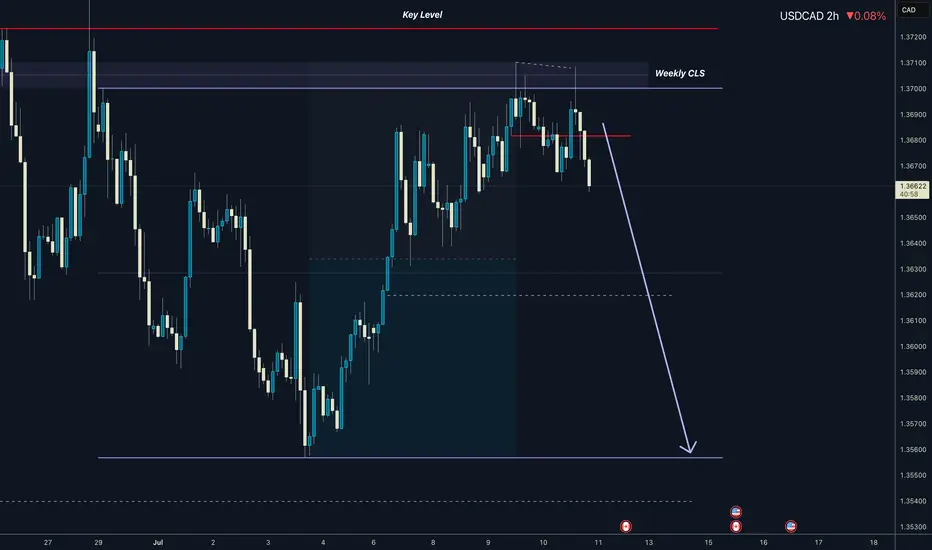
USDCAD MARKET OUTLOOK📊 USDCAD Institutional Market Outlook
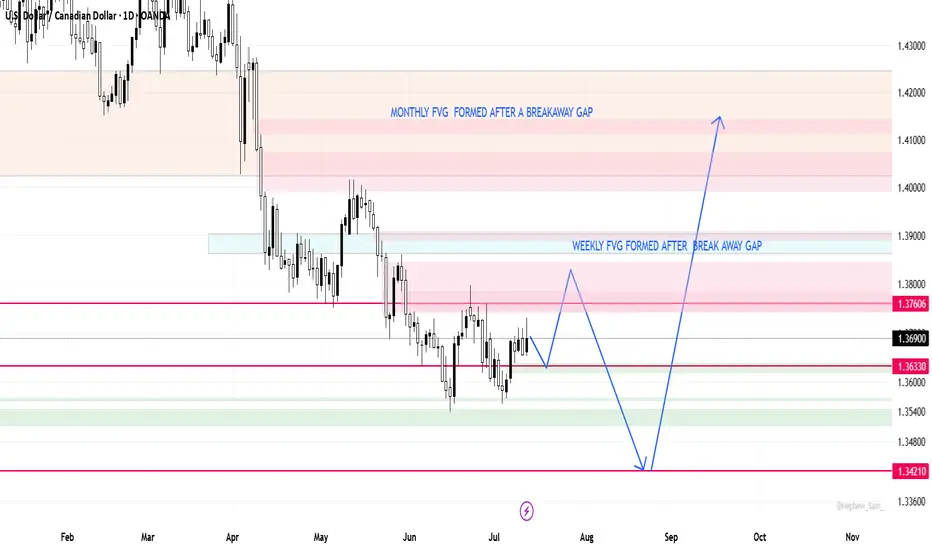
🔷 Monthly & Weekly Structure – Bearish Bias
A Monthly Fair Value Gap (FVG) was formed after a breakaway gap, closing all prior bullish FVGs. This signals strong bearish intent from institutions, with a likely draw toward the next key liquidity level at 1.34210.
Similarly, a Weekly FVG, also formed from a breakaway imbalance, is currently acting as an unmitigated supply zone. Historically, FVGs formed from breakaway moves are not revisited until the market completes its delivery to a main liquidity pool — in this case, the 1.34210 level.
Price is now consolidating below this weekly FVG, reinforcing a continuation bias rather than reversal.
🔹 Daily Structure – Short-Term Countertrend Rally
A bullish Daily FVG has recently formed, suggesting a possible short-term countertrend rally.
However, due to the breakaway nature of the weekly FVG, price is unlikely to reach back up to 1.3760 before continuing its bearish path.
A probable scenario: price may react from daily demand zones, push into a short-term premium area, then resume its decline toward 1.34210.
🌐 Fundamental Confluence
🟥 CAD Weakness:
U.S. tariff policy is placing heavy pressure on the Canadian economy, especially in autos, steel, and oil sectors.
Recent SECO reports and tariff-related projections expect a long-term GDP drag of ~2.1%.
Although oil prices have slightly rebounded, it's not enough to counterbalance the trade and policy headwinds.
🟩 USD Strength:
The U.S. dollar remains supported by global safe haven flows and a resilient macro backdrop.
No significant shift in Fed policy tone has emerged, and the USD continues to benefit from relative strength across multiple pairs.
| Timeframe | Bias | Reason |
| ------------ | ------------------------ | ------------------------------------------------------------------------- |
| Monthly | Bearish | Breakaway FVG + closed bullish zones → draw toward 1.34210 |
| Weekly | Bearish | Consolidation below breakaway supply zone |
| Daily | Short-term bullish | Countertrend move expected into local premium, likely to fail near 1.3760 |
| Fundamentals | Bearish CAD, Bullish USD | Tariff risks + economic divergence
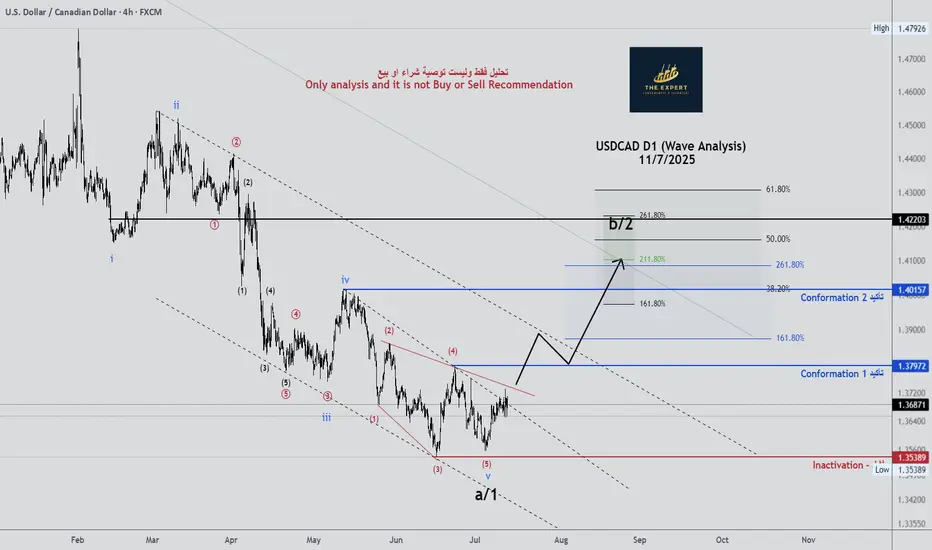
USDCAD D1 (Wave Analysis) - 11/7/2025USDCAD D1 (Wave Analysis) - 11/7/2025
As shown in chart, impulse Wave a or 1 is almost finished and we will go to corrective = wave b or 2.
as shown
regards,
USDCADThe US tariffs have had a mixed but generally weakening effect on the Canadian dollar (CAD) , influencing the USD/CAD exchange rate
Current Exchange Rate Context
As of July 11, 2025, the USD/CAD rate is around 1.37-1.3698 , with the US dollar strengthening and the Canadian dollar weakening about 0.7% over the past month.
Impact of US Tariffs on CAD Strength
Trade Exposure:
Canada is highly integrated with the US economy, with over 70% of Canadian exports going to the US. Tariffs on Canadian goods or retaliatory tariffs can reduce trade volumes and economic growth in Canada, weakening the CAD.
Market Sentiment and Risk:
Tariff uncertainties create volatility and risk aversion, often benefiting the safe-haven USD at the expense of commodity-linked currencies like CAD.
Commodity Prices:
Tariffs can disrupt global supply chains and commodity demand. Since Canada is a major oil exporter, any negative impact on oil prices due to trade tensions tends to weaken the CAD.
Interest Rate and Economic Outlook:
Trade tensions may lead to cautious monetary policy by the Bank of Canada, limiting rate hikes or prompting cuts, which can reduce the interest rate differential versus the US and weigh on CAD
2. Interest Rates
Bank of Canada (BoC) Overnight Target Rate: 2.75% (held steady as of July 9, 2025).
Canadian government 10 year bond yield is 3.419%
US Federal Reserve Rate: Around 4.5% (market consensus for mid-2025).
United states government 10 year bond yield is 4.38%-4.4%
The interest rate differential between the US and Canada remains significant, favoring USD, which supports USD strength against CAD.
US 10-Year Treasury Yield: Generally higher than Canadian yields, around 4.38%–4.4% (market consensus), maintaining a yield advantage for USD assets.
4. Impact on USD/CAD
The higher US interest rates and bond yields relative to Canada make USD-denominated assets more attractive, contributing to the USD’s strength against CAD.
Conclusion
The US tariff policies in 2025 have contributed to a weaker Canadian dollar by increasing economic uncertainty, disrupting trade, and pressuring commodity prices. This has supported the US dollar’s recent strength against CAD, pushing the USD/CAD rate toward the higher .
#usdcad #cad #usd

US Dollar Strengthens Following Trump’s Tariff DecisionUS Dollar Strengthens Following Trump’s Tariff Decision
US President Donald Trump has announced his decision to impose new tariffs:
→ For Canada, tariffs are set at 35%. They are scheduled to take effect on 1 August, although negotiations may take place before this date, potentially influencing Trump’s final stance.
→ For many other countries, tariffs may be set at 15% or 20%;
→ For the European Union, the exact tariff levels have not yet been disclosed.
Overall, Trump’s latest comments have added to the uncertainty surrounding the specific tariffs to be applied to each country. The financial markets reacted as follows:
→ The US dollar strengthened against other currencies (including the Canadian dollar);
→ Equity markets saw a modest decline.
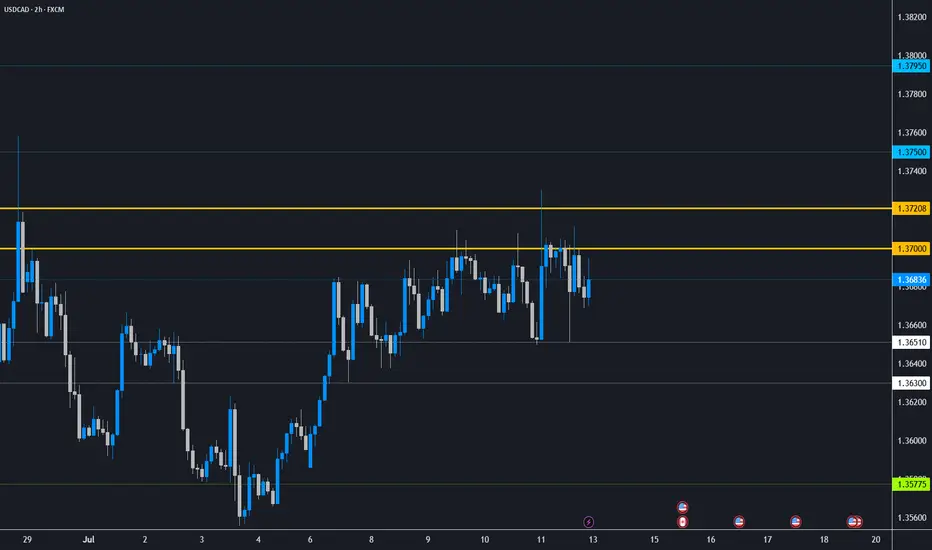
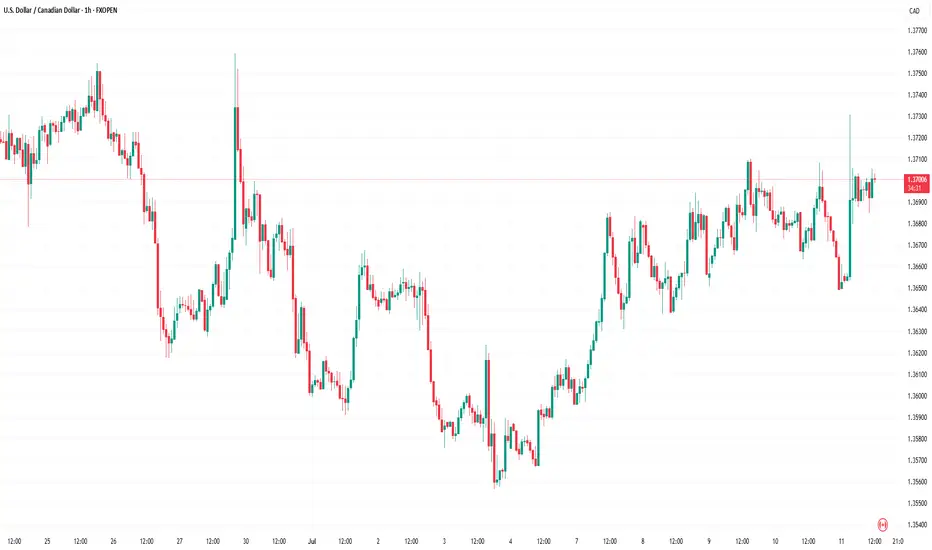
Technical Analysis of the USD/CAD Chart
As soon as the announcement of a 35% tariff on Canadian imports to the US was made public, the USD/CAD rate spiked sharply (as indicated by the arrow), reaching levels last seen at the end of June. In the hours that followed, the pair stabilised.
Taking a broader view, the chart appears to show a triangular formation, which consists of:
→ A descending resistance line (R);
→ A key support level (S) around 1.3570.
From this perspective, it is worth noting that the bulls’ attempt to break above the resistance line amid the 35% tariff news did not succeed, indicating strong selling pressure.
At the same time, the price action of USD/CAD in early July allows us to identify a local support level (marked by the blue line). This suggests that, for now, the pair is consolidating within a formation bounded by the blue support line and resistance line R.
However, how long this consolidation will last, and which direction the breakout will take, will most likely depend on the next round of news regarding US–Canada trade negotiations.
This article represents the opinion of the Companies operating under the FXOpen brand only. It is not to be construed as an offer, solicitation, or recommendation with respect to products and services provided by the Companies operating under the FXOpen brand, nor is it to be considered financial advice.
USDCAD I Weekly CLS I Model 1 I KL - OB I Target CLS LowYo Market Warriors ⚔️
BIG SHORT — if you’ve been riding with me, you already know:
🎯My system is 100% mechanical. No emotions. No trend lines. No subjective guessing. Just precision, structure, and sniper entries.
🧠 What’s CLS?
It’s the real smart money. The invisible hand behind $7T/day — banks, algos, central players.
📍Model 1:
HTF bias based on the daily and weekly candles closes,
Wait for CLS candle to be created and manipulated. Switch to correct LTF and spot CIOD. Enter and target 50% of the CLS candle.
For high probability include Dealing Ranges, Weekly Profiles and CLS Timing.
Trading is like a sport. If you consistently practice you can learn it.
“Adapt what is useful. Reject whats useless and add whats is specifically yours.”
David Perk aka Dave FX Hunter
💬 Don't hesitate to ask any questions or share your opinions
USDCADThis is a technical scenario, not a guaranteed prediction. The zone is becoming a key area of interest. No confirmation, no trade.
If confirmed breakout and retest occur, I’ll look to trade in alignment with the new structure.
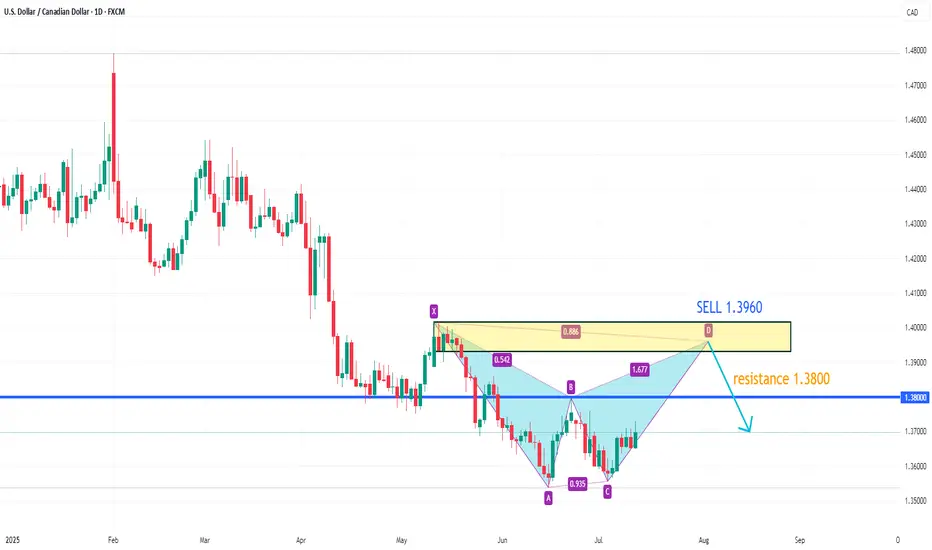
USDCAD upside target 1.3960On the 4-hour chart, USDCAD stabilized and moved upward, with bulls taking the upper hand. The current market has formed a potential double bottom pattern. In the short term, attention can be paid to the resistance near 1.380. A breakthrough will hopefully continue to move higher, with the upward target around 1.3960. When the price reaches 1.3960, attention can be paid to the bearish bat pattern.
USDCAD LONG DAILY FORECAST Q3 D11 W28 Y25USDCAD LONG DAILY FORECAST Q3 D11 W28 Y25
It’s Fun Coupon Friday! 💸🔥
Professional Risk Managers👋
Welcome back to another FRGNT chart update📈
Diving into some Forex setups using predominantly higher time frame order blocks alongside confirmation breaks of structure.
Let’s see what price action is telling us today! 👀
💡Here are some trade confluences📝
✅Daily Order block identified
✅4H Order Block identified
✅1H Order Block identified
🔑 Remember, to participate in trading comes always with a degree of risk, therefore as professional risk managers it remains vital that we stick to our risk management plan as well as our trading strategies.
📈The rest, we leave to the balance of probabilities.
💡Fail to plan. Plan to fail.
🏆It has always been that simple.
❤️Good luck with your trading journey, I shall see you at the very top.
🎯Trade consistent, FRGNT X
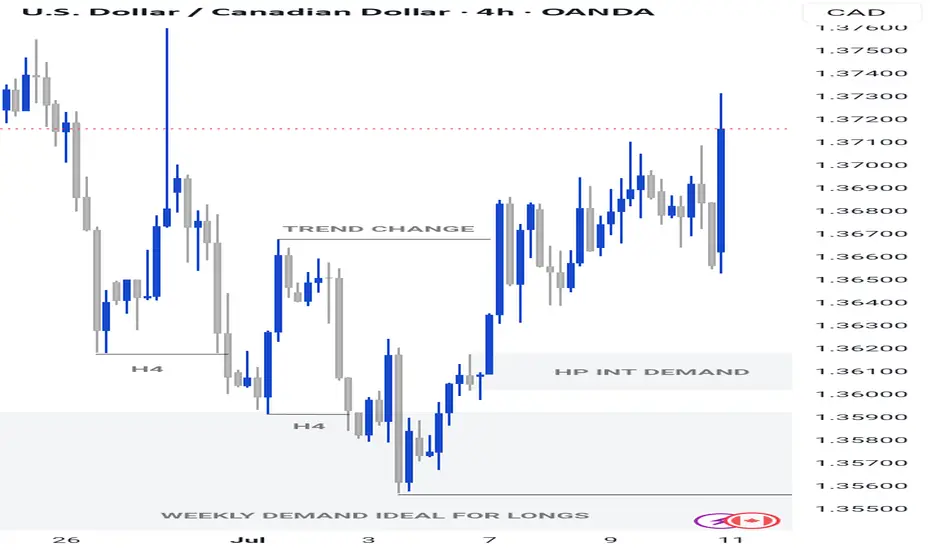
4 HOUR CONFIRMATION- USDCAD ENTRY UPDATEPrice tapped in our Weekly Demand ideal 👌 for long buys.
Previously i anticipated a trend shift H4 as guide , cmp price just break our int previous high meaning change a in trend as we anticipated
Now waiting for price to drop to our int demand then we rise or the breaker block can hold - major reactions
USDCAD IS BULLISHAll i see is a change to the upside that will act as an exhaustion phase then when it mitigitates the supply zone the bearish signals might be formed.
I will see how it goes ...
HappY TrAdINg

Bearish drop off pullback resistance?USD/CAD has rejected off the resistance level which is a pullback resistance and could drop from this level to our take profit.
Entry: 1.3695
Why we like it:
There is a pullback resistance.
Stop loss: 1.3740
Why we like it:
There is a pullback resistance that lines up with the 78.6% Fibonacci retracement.
Take profit: 1.3618
Why we like it:
There is a pullback support that lines up with the 61.8% Fibonacci retracement.
Enjoying your TradingView experience? Review us!
Please be advised that the information presented on TradingView is provided to Vantage (‘Vantage Global Limited’, ‘we’) by a third-party provider (‘Everest Fortune Group’). Please be reminded that you are solely responsible for the trading decisions on your account. There is a very high degree of risk involved in trading. Any information and/or content is intended entirely for research, educational and informational purposes only and does not constitute investment or consultation advice or investment strategy. The information is not tailored to the investment needs of any specific person and therefore does not involve a consideration of any of the investment objectives, financial situation or needs of any viewer that may receive it. Kindly also note that past performance is not a reliable indicator of future results. Actual results may differ materially from those anticipated in forward-looking or past performance statements. We assume no liability as to the accuracy or completeness of any of the information and/or content provided herein and the Company cannot be held responsible for any omission, mistake nor for any loss or damage including without limitation to any loss of profit which may arise from reliance on any information supplied by Everest Fortune Group.
