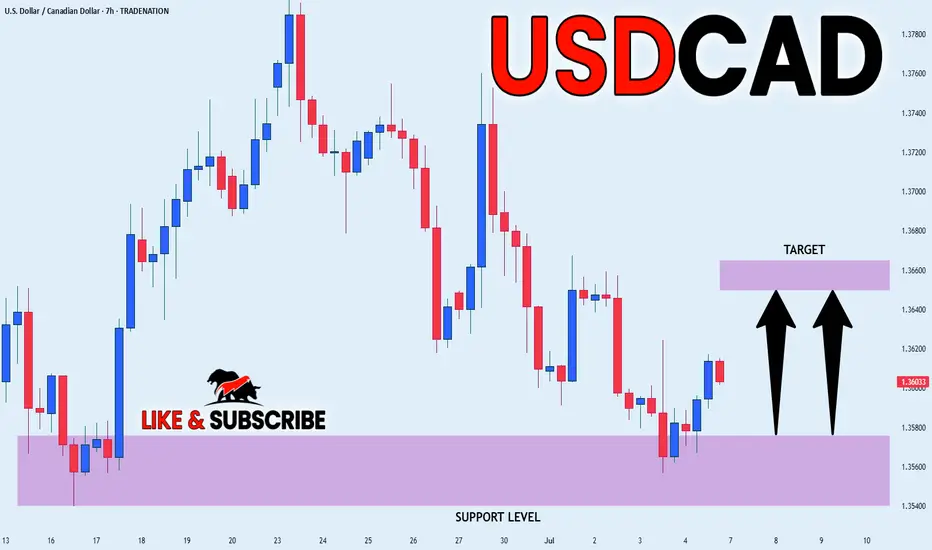
Market Update - USDCAD 07/07/2025Well be looking at our market on the M15 Timeframe.
Market Updates At:
1. 7:00 am
2. 11:00 am
3. 03:00 pm
4. 07:00 pm
CADUSD trade ideas

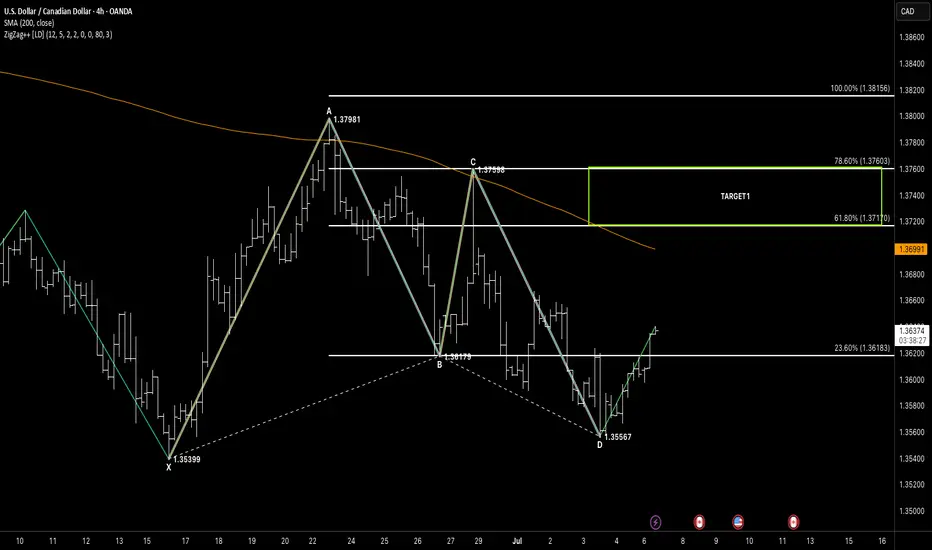
HARMONICS XABCDHello awesome traders! 👑✨
Let’s kick off the week with a USD/CAD 4-Hour chart — spotting a high-probability Harmonic XABCD Bullish reversal to ride higher.
🧠 Setup Breakdown
Pattern Type: Harmonic XABCD Bullish
X → A: Uptrend from 1.35399 → 1.37981
A → B: Correction down to 1.36179
B → C: Bounce up to 1.37598
C → D: Final leg down into 1.35567 completes the pattern
PCZ: Exact D-point at 1.3555–1.3565 (XABCD harmonic PRZ)
✅ Why This Works
Classic XABCD symmetry with precise Fibonacci ratios
PRZ confluence at D gives us a tight entry zone
4-hour price action shows clear rejection off D
⚔️ Entry & Risk Management
Entry Zone: Long within 1.3555–1.3565 (PRZ/PCZ)
Stop-Loss: Below X at 1.3535, ~10–15 pips under D
Risk: ≤ 1–2 % of account per trade
🎯 Target Zones
Target Zone 1: 61.8 %–78.6 % retracement of X→D → 1.3717–1.3760
Target Zone 2: 100 % extension of X→D → 1.3816
🔍 Confirmation & Invalid
Candlestick Rejection: Watch for bullish pin-bar or engulfing at D
Structure Break: Close back above the C→D trendline adds conviction
Invalidation: A decisive close below 1.3535 (below X & PRZ) negates the setup
💡 Keep It Simple:
Pattern → Identify XABCD Bullish
PRZ/PCZ → Wait for D completion zone
Trigger → Bullish price action at D
Continuation → Ride the move into your Target Zones
🔔 Monitor CAD data releases and BoC commentary for catalysts.
Wishing everyone a profitable week ahead — stay disciplined, manage risk, and let structure lead, not emotions! 🚀
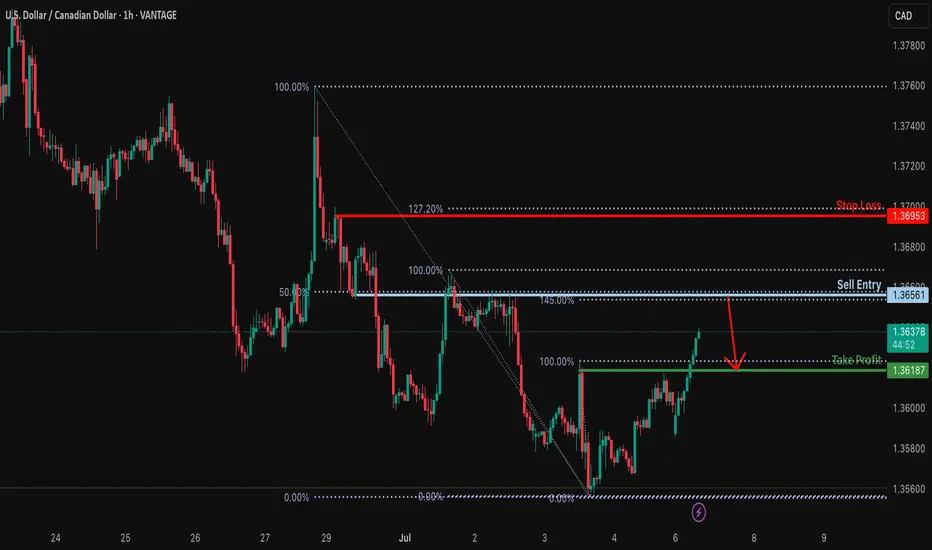
Bearish reversal?USD/CAD is rising towards the resistance level which is an overlap resistance that lines up with the 50% Fibonacci retracement and the 145% Fibonacci extension and could reverse from this level to our take profit.
Entry: 1.3656
Why we like it:
There is an overlap resistance level that lines up with the 145% Fibonacci extension and the 50% Fibonacci retracement.
Stop loss: 1.3695
Why we like it:
There is a pullback resistance level that lines up with the 127.2% Fibonacci extension.
Take profit: 1.3618
Why we like it:
There is a pullback support level.
Enjoying your TradingView experience? Review us!
Please be advised that the information presented on TradingView is provided to Vantage (‘Vantage Global Limited’, ‘we’) by a third-party provider (‘Everest Fortune Group’). Please be reminded that you are solely responsible for the trading decisions on your account. There is a very high degree of risk involved in trading. Any information and/or content is intended entirely for research, educational and informational purposes only and does not constitute investment or consultation advice or investment strategy. The information is not tailored to the investment needs of any specific person and therefore does not involve a consideration of any of the investment objectives, financial situation or needs of any viewer that may receive it. Kindly also note that past performance is not a reliable indicator of future results. Actual results may differ materially from those anticipated in forward-looking or past performance statements. We assume no liability as to the accuracy or completeness of any of the information and/or content provided herein and the Company cannot be held responsible for any omission, mistake nor for any loss or damage including without limitation to any loss of profit which may arise from reliance on any information supplied by Everest Fortune Group.
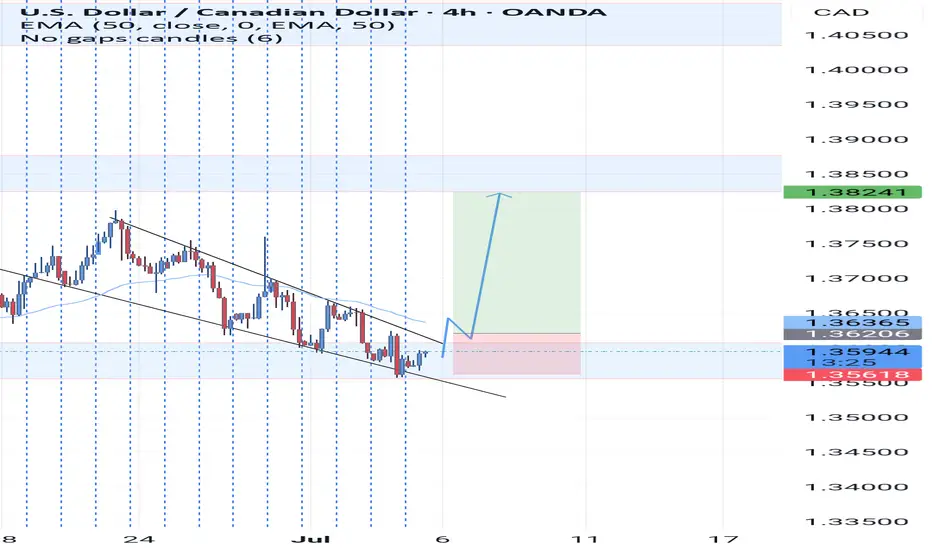
USDCAD SetupMy own opinion on USDCAD this week, we should see a push to the upside. Make your own research before entering the trade ☺️
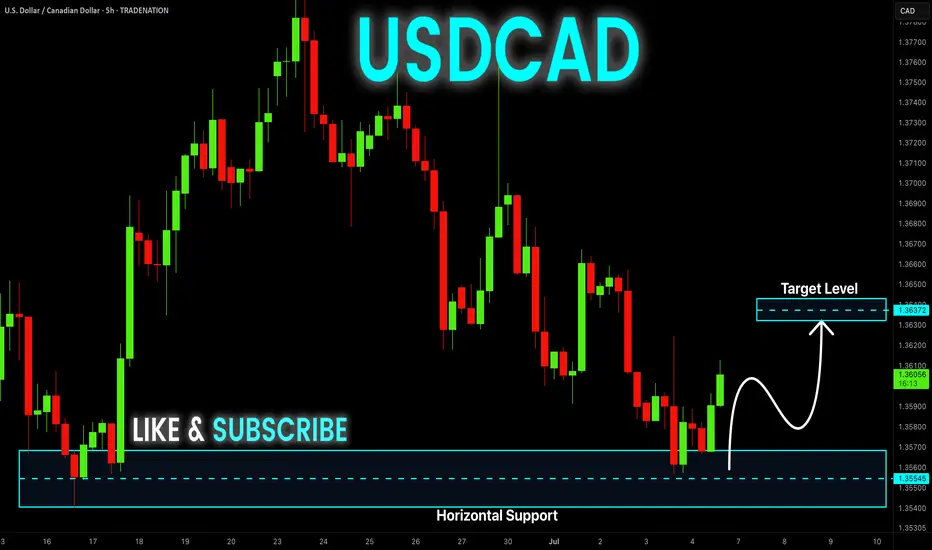
USD_CAD POTENTIAL LONG|
✅USD_CAD went down to retest
A horizontal support of 1.3560
Which makes me locally bullish biased
And I think that a move up
From the level is to be expected
Towards the target above at 1.3652
LONG🚀
✅Like and subscribe to never miss a new idea!✅
Disclosure: I am part of Trade Nation's Influencer program and receive a monthly fee for using their TradingView charts in my analysis.
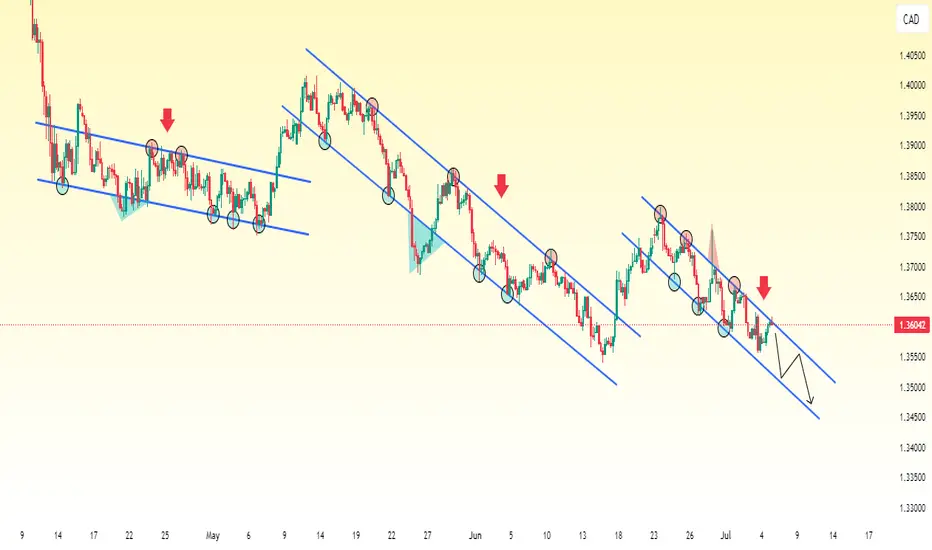
USD/CAD in a Strong Downtrend – Lower Channels Keep FormingUSD/CAD is currently in a strong bearish trend, forming a series of descending channels.
The price initially moved lower within a downward-sloping channel, then broke out to the upside, suggesting a reversal or deeper correction. However, this breakout was short-lived.
Instead of continuing higher, USD/CAD lost momentum and began forming a new descending channel, resuming its bearish movement. This pattern has repeated, each time the price breaks out upward, it quickly shifts back into a new downward channel, making lower lows each time.
This behavior indicates a bearish continuation structure, where temporary upward moves are corrective in nature and serve as setups for the next leg down. The consistent formation of new lower channels after brief pullbacks reflects ongoing selling pressure and trader sentiment favoring the downside.
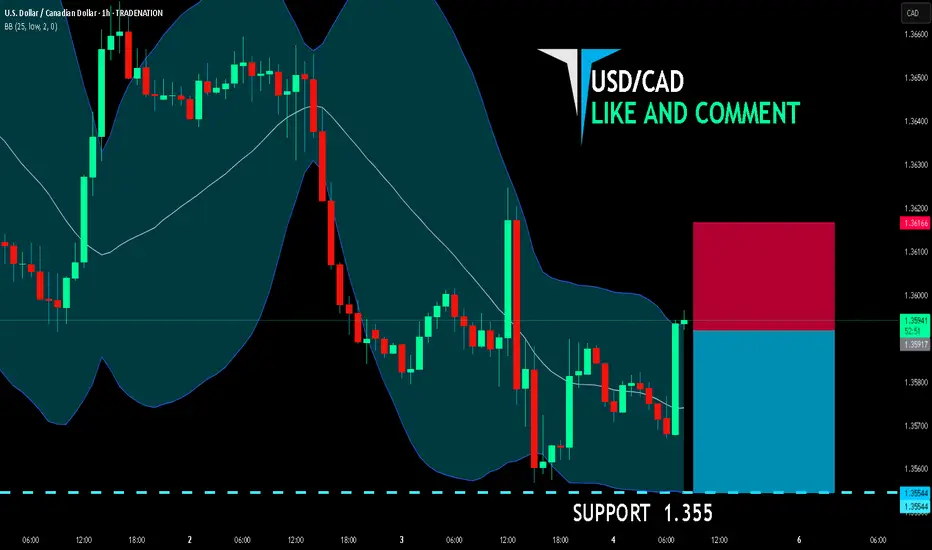
USD-CAD Local Rebound! Buy!
Hello,Traders!
USD-CAD is trading in a
Strong downtrend but
The pair made a retest
Of the horizontal support
Level of 1.3540 from where
We are already seeing a
Bullish rebound and we
Will be expecting a
Further move up
Buy!
Comment and subscribe to help us grow!
Check out other forecasts below too!
Disclosure: I am part of Trade Nation's Influencer program and receive a monthly fee for using their TradingView charts in my analysis.
USDCAD 15/3 Pullback LongOverall up trend. When the pull back reach congestion, will take off. Still need to monitor the CAD news later.

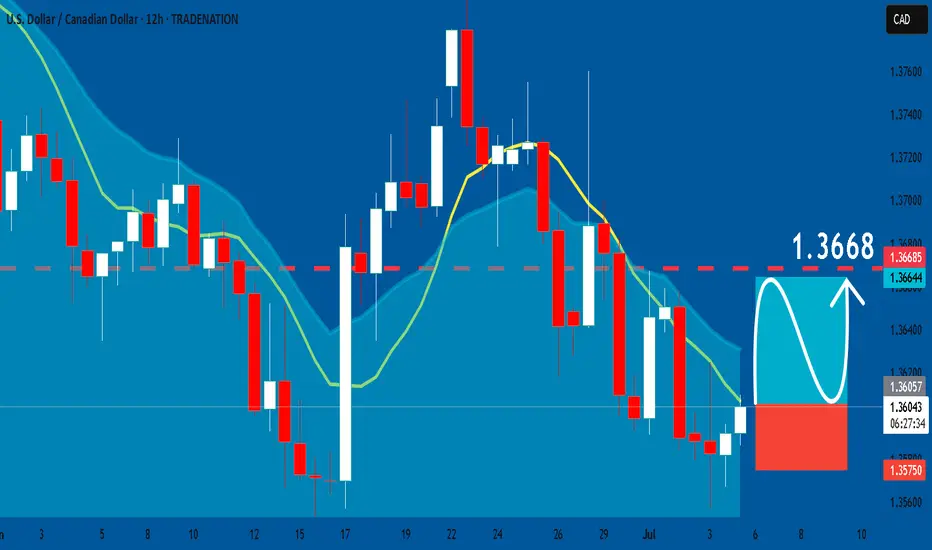
USDCAD: Long Signal with Entry/SL/TP
USDCAD
- Classic bullish formation
- Our team expects growth
SUGGESTED TRADE:
Swing Trade
Buy USDCAD
Entry Level - 1.3605
Sl - 1.3575
Tp - 1.3668
Our Risk - 1%
Start protection of your profits from lower levels
Disclosure: I am part of Trade Nation's Influencer program and receive a monthly fee for using their TradingView charts in my analysis.
❤️ Please, support our work with like & comment! ❤️
3 PM Market Update _ USDCADWhat happened was that the market reversed into a buy sentiment which i was able to take advantage of by using my strategy!!

USD/CADIt is very amazing chart 1h frame
Entry point 1.3600
stop loss below 1.39450 (93.4 point)
T1 1.39232 (325 Point)
T2 1.40417 (443 Point)
T3 141600 (558 Point)

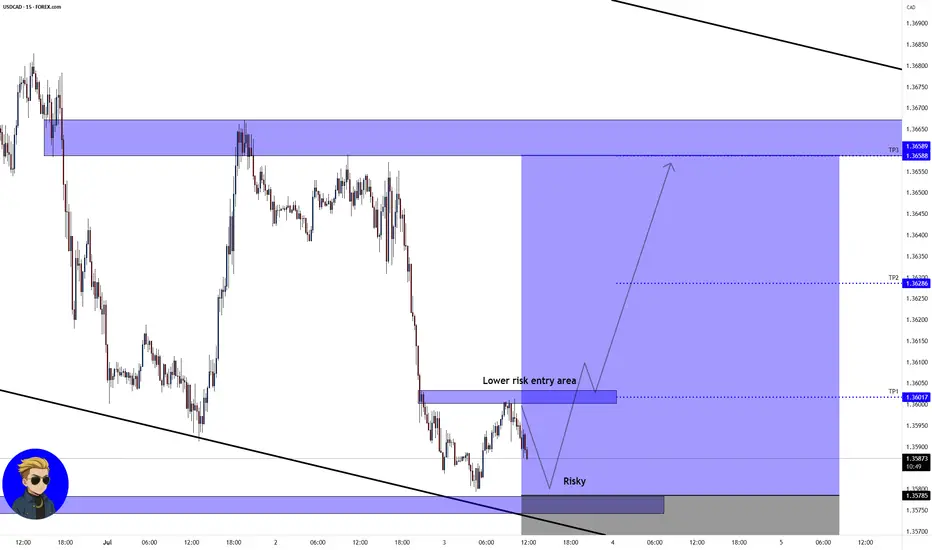
USD/CAD💰Symbol: { USD/CAD }
🟩Price: { 1.35785 }
🟥Stop: { 1.35534 }
1️⃣profit: { 1.36017 }
2️⃣profit: { 1.36286 }
3️⃣profit: { 1.36588 }
📊Check your chart before entering.
🚨Check before use to make sure there is no important news.🚨
usdcad longs Since dxy is showing some bullish momentum and was expecting a strong dollar if we close bullish on this 30 min candle we can go long ..quick newyork trades

Usdcad Usdcad as we can see is on a uptrend we hv 1d 1w on a uptrend and we are expecting a break and a retest on the 4hrs den we buy but this trade is a high probability trade
Trade Idea For USDCADDon't forget to follow!!
Eurusd on our medium timeframe is CT to the higher timeframe so at this stage we only targeting a fixed 1:5RR.

USD/CAD SHORT FROM RESISTANCE
USD/CAD SIGNAL
Trade Direction: short
Entry Level: 1.359
Target Level: 1.355
Stop Loss: 1.361
RISK PROFILE
Risk level: medium
Suggested risk: 1%
Timeframe: 1h
Disclosure: I am part of Trade Nation's Influencer program and receive a monthly fee for using their TradingView charts in my analysis.
✅LIKE AND COMMENT MY IDEAS✅
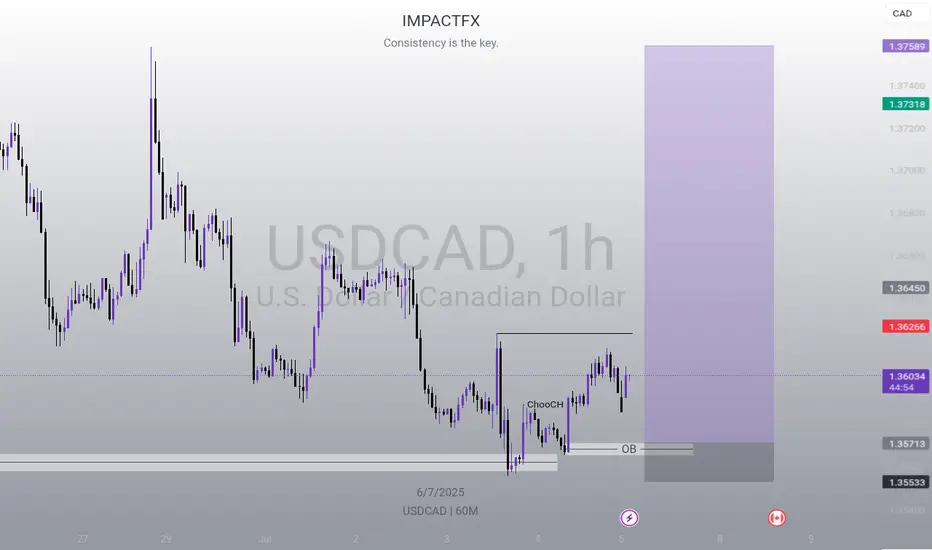
USDCAD LONG DAILY FORECAST Q3 D4 W27 Y25USDCAD LONG DAILY FORECAST Q3 D4 W27 Y25
Professional Risk Managers👋
Welcome back to another FRGNT chart update📈
Diving into some Forex setups using predominantly higher time frame order blocks alongside confirmation breaks of structure.
Let’s see what price action is telling us today! 👀
💡Here are some trade confluences📝
✅Daily Order block identified
✅4H Order Block identified
✅1H Order Block identified
🔑 Remember, to participate in trading comes always with a degree of risk, therefore as professional risk managers it remains vital that we stick to our risk management plan as well as our trading strategies.
📈The rest, we leave to the balance of probabilities.
💡Fail to plan. Plan to fail.
🏆It has always been that simple.
❤️Good luck with your trading journey, I shall see you at the very top.
🎯Trade consistent, FRGNT X
USDCAD offers good R:R opportunityAs the price corrected, its forming a falling wedges pattern. And the best thing is all the new lower low was appear alongside the higher low on MACD, it's such a strong BULLISH DIVERGENCE signal.
I believe in the next 2-3 trading days, 100-150 pips upward movement is very likely to happen.
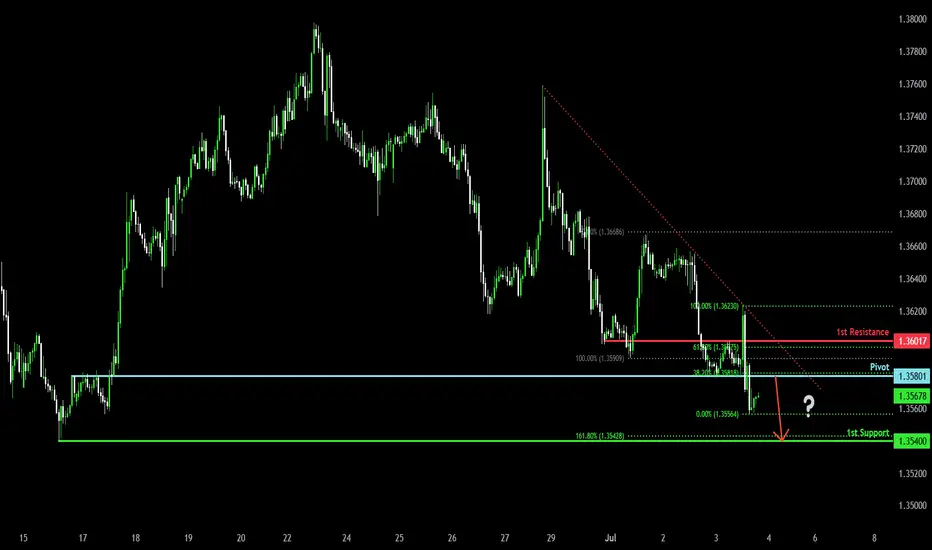
Bearish drop?The Loonie (USD/CAD) is rising towards the pivot and could drop to the 1st support that aligns with the 161.8% Fibonacci extension.
Pivot: 1.3580
1st Support: 1.3540
1st Resistance: 1.3601
Risk Warning:
Trading Forex and CFDs carries a high level of risk to your capital and you should only trade with money you can afford to lose. Trading Forex and CFDs may not be suitable for all investors, so please ensure that you fully understand the risks involved and seek independent advice if necessary.
Disclaimer:
The above opinions given constitute general market commentary, and do not constitute the opinion or advice of IC Markets or any form of personal or investment advice.
Any opinions, news, research, analyses, prices, other information, or links to third-party sites contained on this website are provided on an "as-is" basis, are intended only to be informative, is not an advice nor a recommendation, nor research, or a record of our trading prices, or an offer of, or solicitation for a transaction in any financial instrument and thus should not be treated as such. The information provided does not involve any specific investment objectives, financial situation and needs of any specific person who may receive it. Please be aware, that past performance is not a reliable indicator of future performance and/or results. Past Performance or Forward-looking scenarios based upon the reasonable beliefs of the third-party provider are not a guarantee of future performance. Actual results may differ materially from those anticipated in forward-looking or past performance statements. IC Markets makes no representation or warranty and assumes no liability as to the accuracy or completeness of the information provided, nor any loss arising from any investment based on a recommendation, forecast or any information supplied by any third-party.
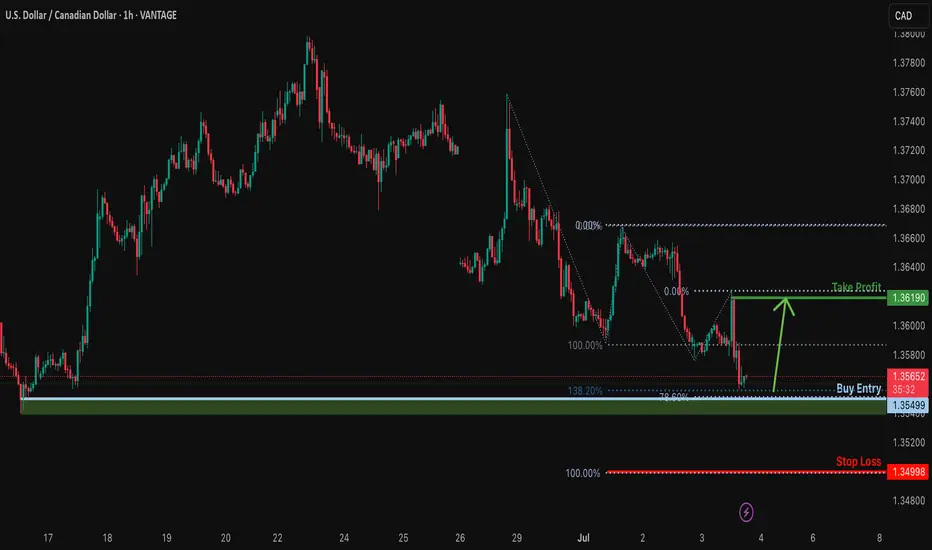
Falling towards pullback support?USD/CAD us falling towards the support level which is a pullback support that lines up with the 138.2% Fibonacci extension and the 78.6% Fibonacci projection and could bounce from this level to our take profit.
Entry: 1.3549
Why we like it:
There is a pullback support level that lines up with the 138.2% Fibonacci extension and the 78.6% Fibonacci projection.
Stop loss: 1.3499
Why we like it:
There is a support level at the 100% Fibonacci projection.
Take profit: 1.3690
Why we like it:
There is a pullback resistance level.
Enjoying your TradingView experience? Review us!
Please be advised that the information presented on TradingView is provided to Vantage (‘Vantage Global Limited’, ‘we’) by a third-party provider (‘Everest Fortune Group’). Please be reminded that you are solely responsible for the trading decisions on your account. There is a very high degree of risk involved in trading. Any information and/or content is intended entirely for research, educational and informational purposes only and does not constitute investment or consultation advice or investment strategy. The information is not tailored to the investment needs of any specific person and therefore does not involve a consideration of any of the investment objectives, financial situation or needs of any viewer that may receive it. Kindly also note that past performance is not a reliable indicator of future results. Actual results may differ materially from those anticipated in forward-looking or past performance statements. We assume no liability as to the accuracy or completeness of any of the information and/or content provided herein and the Company cannot be held responsible for any omission, mistake nor for any loss or damage including without limitation to any loss of profit which may arise from reliance on any information supplied by Everest Fortune Group.
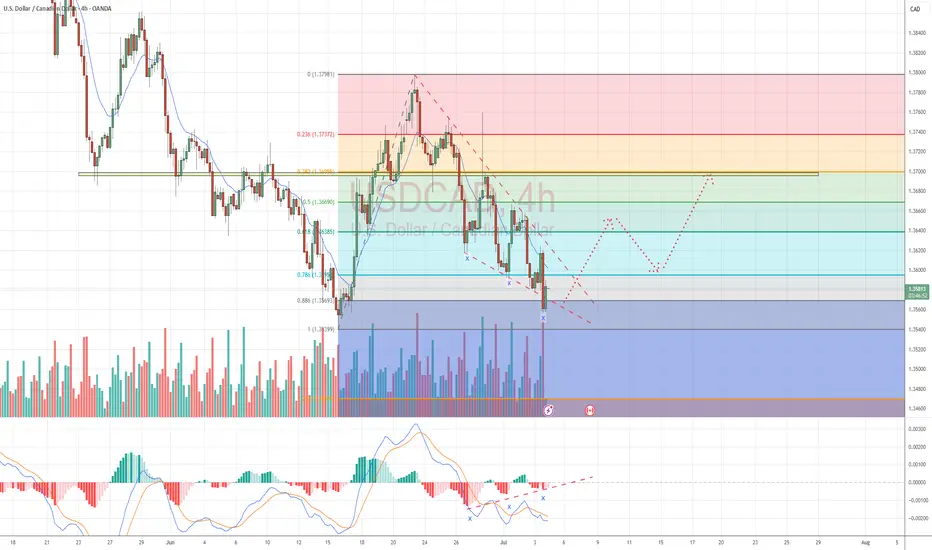
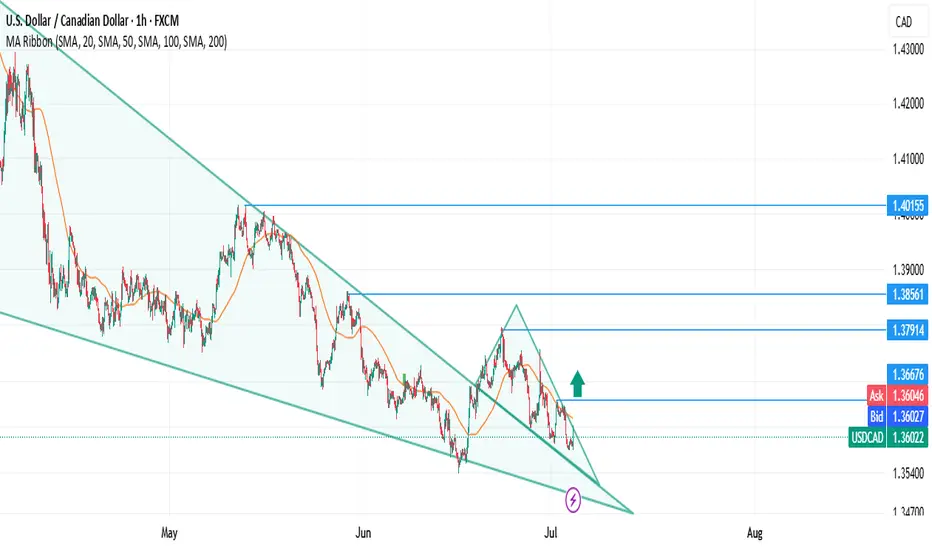
Two Wedges on USD/CAD: Waiting for the FRL ConfirmationWe have two descending wedges on USD/CAD across different timeframes:
H1: Clean falling wedge structure since March, price near the lower boundary.
H4: Same wedge structure, aligning with the larger phase.
FRL Entry Confirmation:
Following the Fractal Reversal Law (FRL), we do not enter immediately.
We wait for:
✅ A full candle close above the neckline of the local double bottom,
✅ Where the neckline on H1 aligns precisely with the 100 SMA.
This confirms phase reversal and removes noise, making the entry safe.
🎯 Targets:
1️⃣ 1.36676 – First take profit, retesting the neckline break.
2️⃣ 1.37914 – Mid-term target, wedge mid-level.
3️⃣ 1.38561 – 1.40155 – Full wedge top, long-term objective.
Why This Matters:
✅ Positive US unemployment data supports USD strength.
✅ The wedge is 3+ months wide, adding reliability to the breakout.
✅ Alignment with 100 SMA increases the accuracy of FRL signals.
✅ The trade offers a clear Risk/Reward above 1:2.5.
Trading is capital management under uncertainty.
The red horizontal zone is uncertainty; the neckline is the Rubicon where the market becomes clear. Don’t fear uncertainty. Wait for clarity.
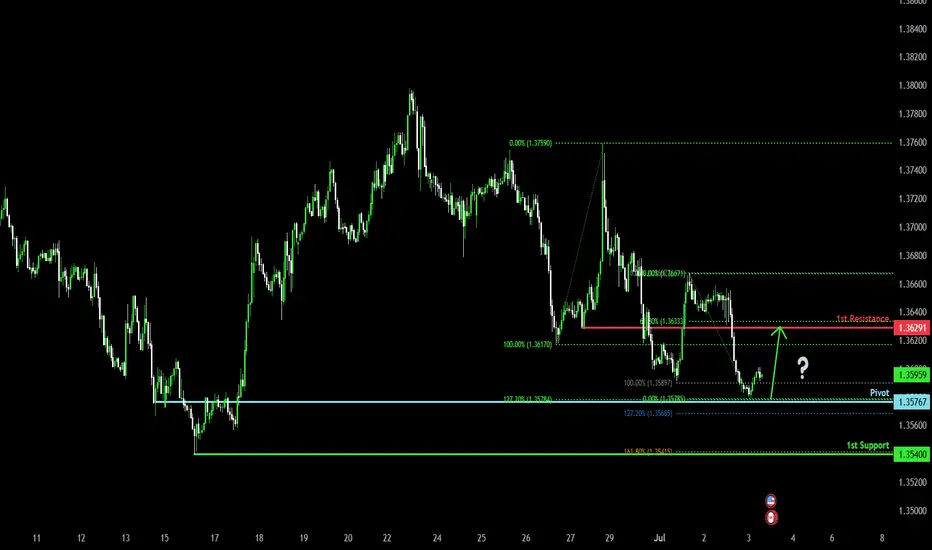
Bullilsh bounce?The Loonie (USD/CAD) has bounced off the pivot and could rise to the 1st resistance which is also a pullback resistance that lines up with the 61.8% Fibonacci retracement.
Pivot: 1.3576
1st Support: 1.3540
1st Resistance: 1.3629
Risk Warning:
Trading Forex and CFDs carries a high level of risk to your capital and you should only trade with money you can afford to lose. Trading Forex and CFDs may not be suitable for all investors, so please ensure that you fully understand the risks involved and seek independent advice if necessary.
Disclaimer:
The above opinions given constitute general market commentary, and do not constitute the opinion or advice of IC Markets or any form of personal or investment advice.
Any opinions, news, research, analyses, prices, other information, or links to third-party sites contained on this website are provided on an "as-is" basis, are intended only to be informative, is not an advice nor a recommendation, nor research, or a record of our trading prices, or an offer of, or solicitation for a transaction in any financial instrument and thus should not be treated as such. The information provided does not involve any specific investment objectives, financial situation and needs of any specific person who may receive it. Please be aware, that past performance is not a reliable indicator of future performance and/or results. Past Performance or Forward-looking scenarios based upon the reasonable beliefs of the third-party provider are not a guarantee of future performance. Actual results may differ materially from those anticipated in forward-looking or past performance statements. IC Markets makes no representation or warranty and assumes no liability as to the accuracy or completeness of the information provided, nor any loss arising from any investment based on a recommendation, forecast or any information supplied by any third-party.
sell from pivotgood RR
on Daily chart I saw down trend
so I was looking for sell
price now is retsting the pivot
that was resistance, broke down and now may be support for continuing the down trend
