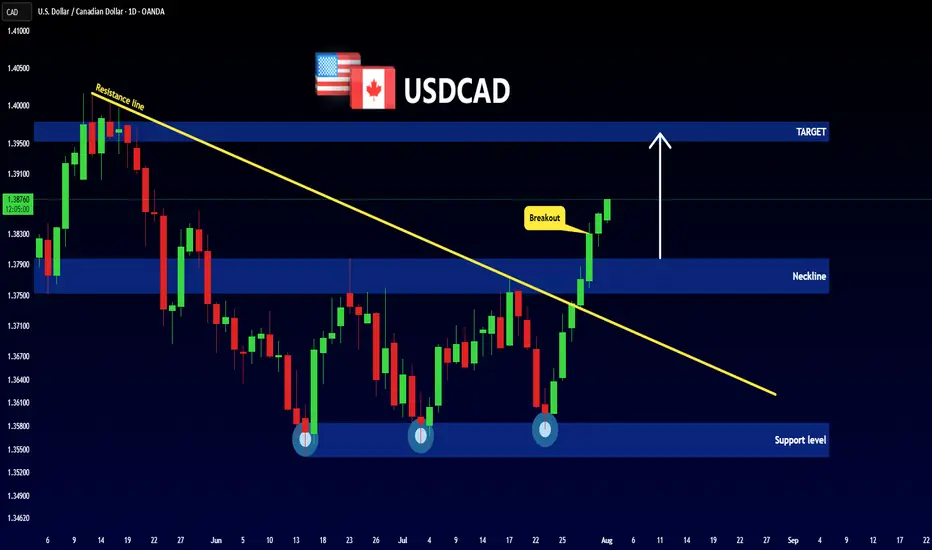
USDCAD - Bullish Triple BottomHello Traders !
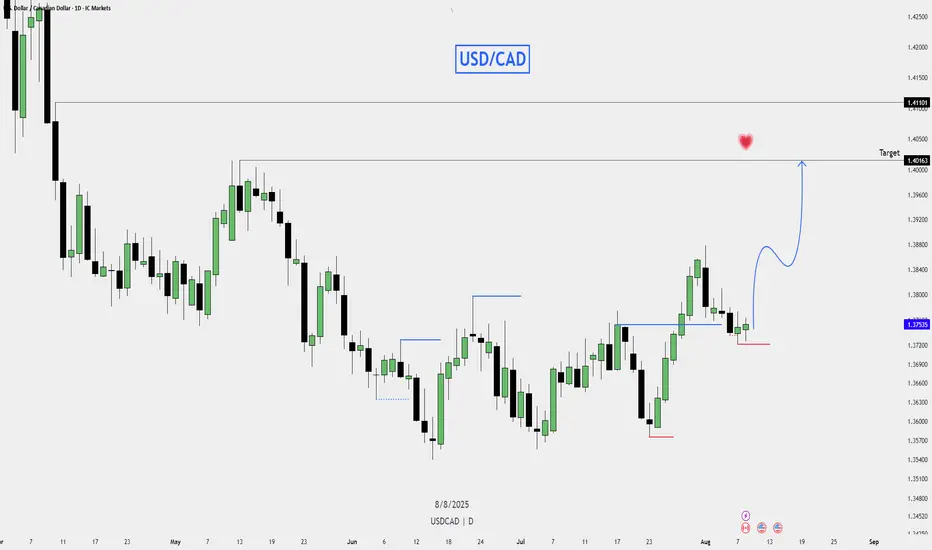
The USDCAD price formed a triple bottom pattern.
Currently, The neckline is broken!
So, I expect a bullish move🚀
________________
TARGET: 1.39530🎯
CADUSD trade ideas
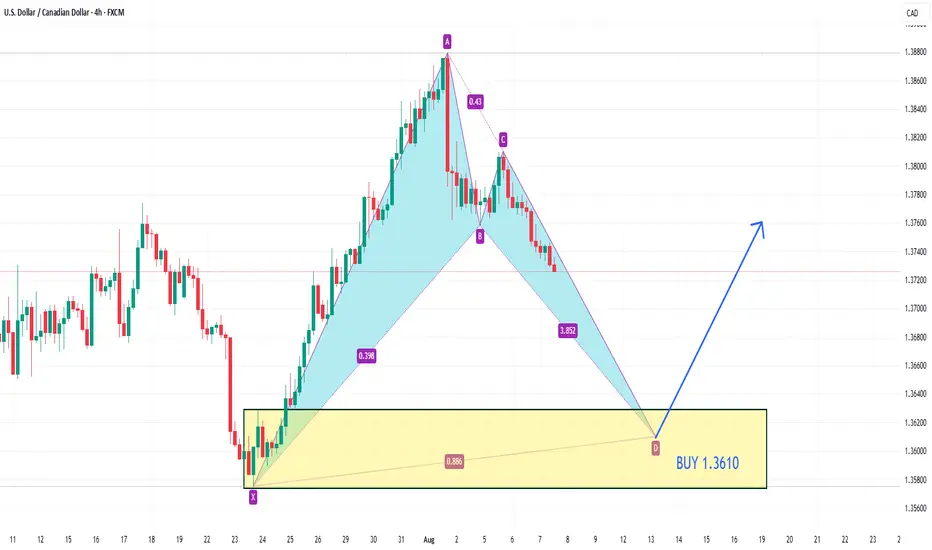
USDCAD BUY 1.3610On the 4-hour chart, USDCAD is experiencing a short-term oscillation and decline, with a bearish trend prevailing. Currently, attention can be paid to the area around 1.3610, which is a potential buy point for a bullish bat pattern and is within the previous demand zone.
USDCAD Will Go Down From Resistance! Short!
Please, check our technical outlook for USDCAD.
Time Frame: 1D
Current Trend: Bearish
Sentiment: Overbought (based on 7-period RSI)
Forecast: Bearish
The market is trading around a solid horizontal structure 1.375.
The above observations make me that the market will inevitably achieve 1.362 level.
P.S
We determine oversold/overbought condition with RSI indicator.
When it drops below 30 - the market is considered to be oversold.
When it bounces above 70 - the market is considered to be overbought.
Disclosure: I am part of Trade Nation's Influencer program and receive a monthly fee for using their TradingView charts in my analysis.
Like and subscribe and comment my ideas if you enjoy them!

BUY OPPORTUNITY AFTER A TRIPLE BOTTOM This week I'm expecting for OANDA:USDCAD USDCAD to close bullish or at least to show lower time frame intraday momentum to the upside not only technically but also fundamentally.
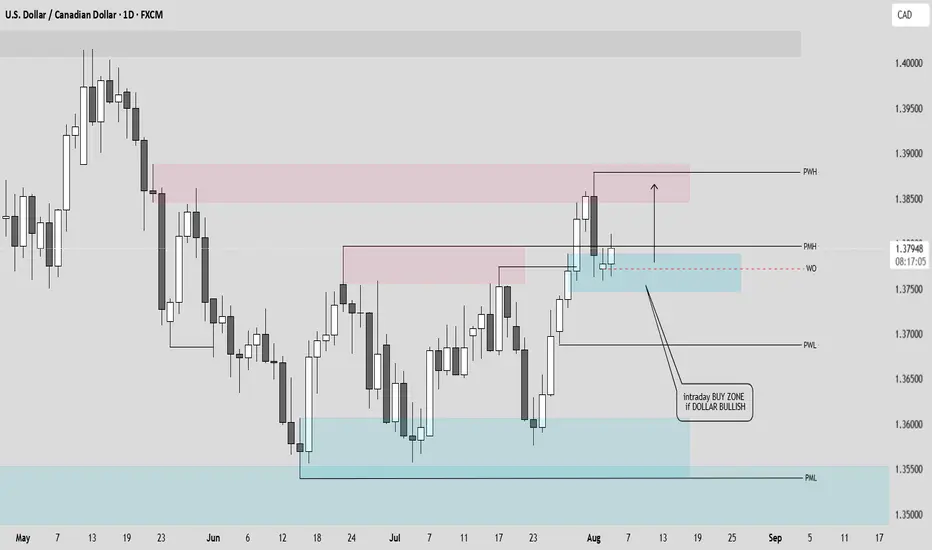
USD/CAD – Bullish ScenarioUSD/CAD – Bullish Scenario
Bias: Bullish, expecting upside continuation.
Current Structure: Price is holding above a key daily support level.
Plan:
As long as support holds, the bullish structure remains valid.
Look for bullish confirmations on lower timeframes — such as a fair value gap or a break of short-term highs.
First major upside target is the next daily resistance.
Extended target at the higher resistance zone if momentum is strong.
Invalidation: A daily close below support will void this bullish plan and require reassessment.
Summary:
Holding support and looking for bullish continuation toward the next resistance zone, with potential for further extension if momentum continues.
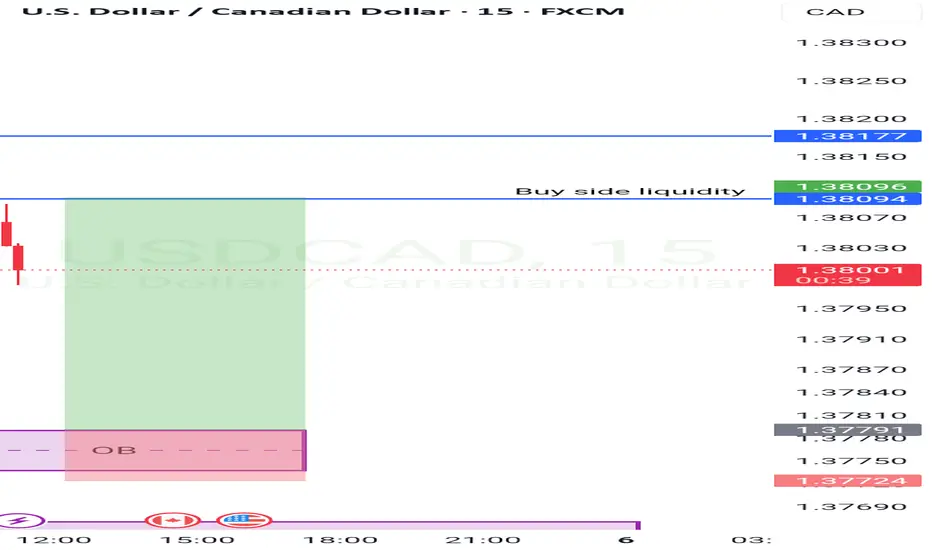
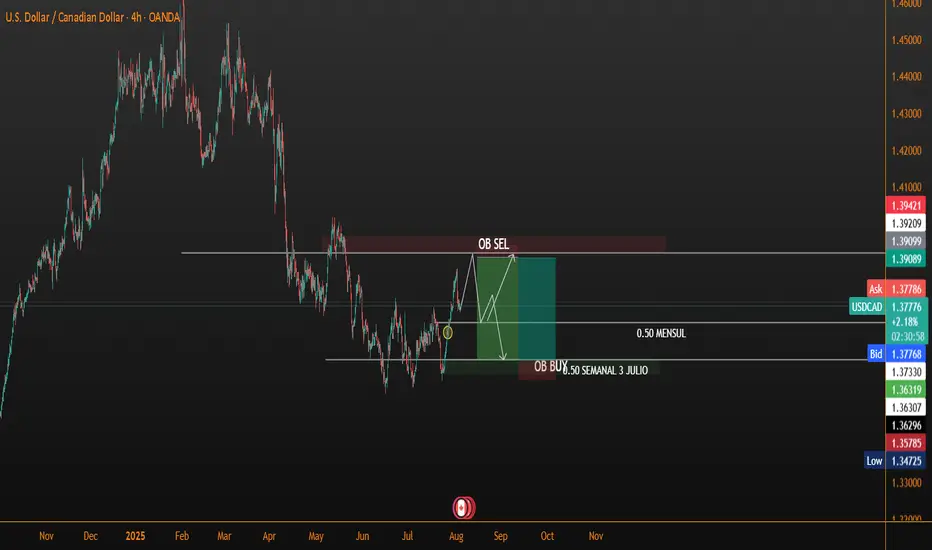
USDCAD: Bearish Structure with Rejection from Key Supply ArraysGreetings Traders,
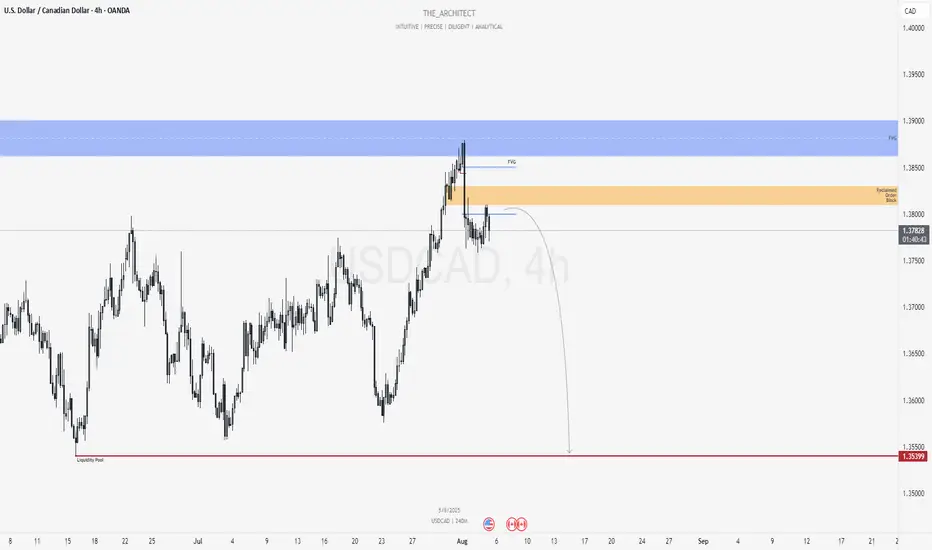
In today’s analysis of USDCAD, recent price action confirms the presence of bearish institutional order flow. As a result, we aim to align ourselves with this directional bias by identifying strategic selling opportunities.
Key Observations:
Weekly Timeframe Insight:
Last week's candle rebalanced a weekly Fair Value Gap (FVG), indicating internal range price action. As a rule of thumb, once internal imbalances are addressed, the draw typically shifts toward external liquidity—located at the swing low, where the weekly liquidity pool resides.
H4 Resistance Alignment:
On the H4 timeframe, price shifted bearish and has since retraced into a bearish FVG that aligns precisely with a reclaimed bearish order block. The alignment of these bearish arrays strengthens the case for continued downside, making this zone a high-probability resistance area.
Trading Plan:
Entry Strategy:
Look for bearish confirmation setups on the M15 or lower timeframes within the H4 supply arrays (FVG + OB confluence).
Target Objective:
The primary draw on liquidity lies within the discount range—targeting the liquidity pool below the most recent swing low.
For a detailed market walkthrough and in-depth execution zones, be sure to watch this week’s Forex Market Breakdown:
Stay patient, wait for your confirmations, and trade in alignment with the flow of smart money.
Kind regards,
The Architect 🏛️📉
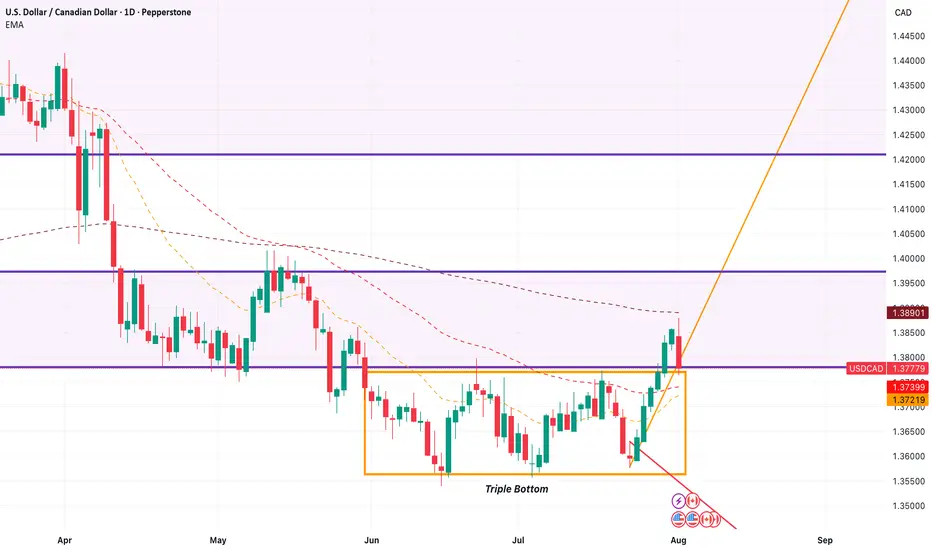
Triple Bottom seen on USDCADUSDCAD has a triple bottom which we can see.
Price already has started to break out and is heading upwards.
We know that, at the time of writing, USD has strength while CAD is weak. Which also supports the triple bottom.
Price broke through 1.37700
USD/CAD 1H Setup – Bearish Reversal Incoming? We’re closely watching the USD/CAD pair on the 1-hour timeframe, and the chart is flashing multiple high-probability reversal signals.
🔹 The trend has been bullish, but momentum is weakening.
🔹 A clear bearish divergence has formed on the oscillator.
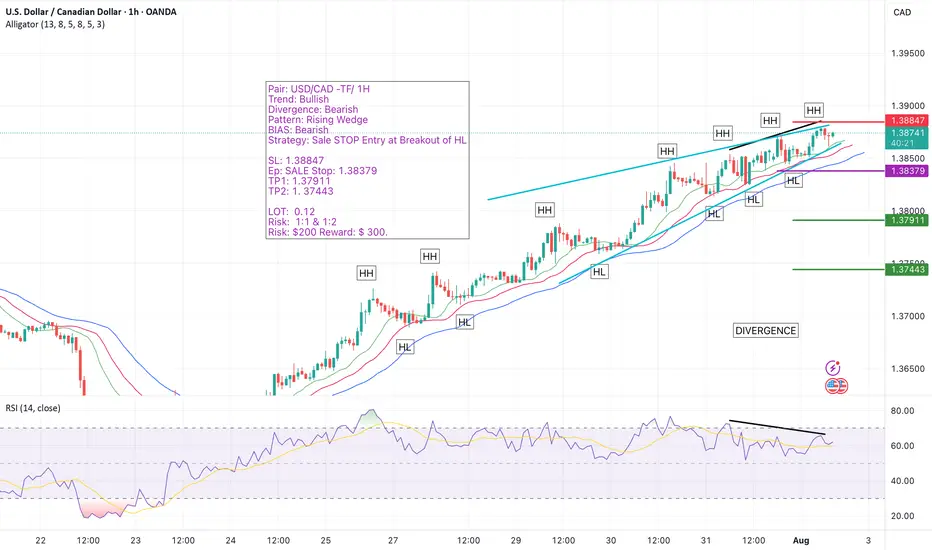
🔹 A rising wedge — one of the most reliable reversal patterns — is fully developed and ready to break.
🔹 All signs point toward an imminent bearish shift, and we're preparing to catch the move early with a Sell Stop below the key Higher Low (HL).
📌 Trade Setup at a Glance:
Pair: USD/CAD
Timeframe: 1H
Trend: Bullish (for now)
Divergence: Bearish
Pattern: Rising Wedge
Bias: Bearish
Strategy: Sell Stop at HL Breakout
🟡 Entry: 1.38379 (Sell Stop)
🔴 Stop Loss: 1.38847
🟢 Take Profit 1: 1.37911 (R:R 1:1)
🟢 Take Profit 2: 1.37443 (R:R 1:2)
📊 Position Sizing & Risk Management
🔹 Lot Size: 0.25
🔹 Risk Per Trade: $200
🔹 Total Reward Target: Up to $300
🔹 Executing two trades – one targeting TP1, the second targeting TP2.
📈 Why This Setup Matters:
✅ Bearish divergence shows clear loss of bullish strength
✅ Rising wedge pattern aligns perfectly with reversal expectations
✅ Well-structured entry with favorable risk-to-reward
✅ Using a split-target strategy to lock in profits smartly
📣 Let’s Discuss!
💬 Drop your thoughts and analysis in the comments — how are you trading USD/CAD?
🔔 Follow me for more high-probability trade setups, chart breakdowns, and real-time analysis. Let’s trade smart and grow together! 🚀
#USDCAD #ForexSetup #RisingWedge #BearishDivergence #PriceActionTrading #SmartMoney #TrendReversal #FXSignals #SellSetup #TradingStrategy #ChartPatterns #BreakoutStrategy #TradeSmart #1HourChart #RiskReward #ForexTrade #TechnicalSetup #TradeIdeas #TradingCommunity #ForexEducation #TradersOfTradingView #SmartEntry #SwingTrading #TradingMindset #TradingViewSetup #ForexAnalysis
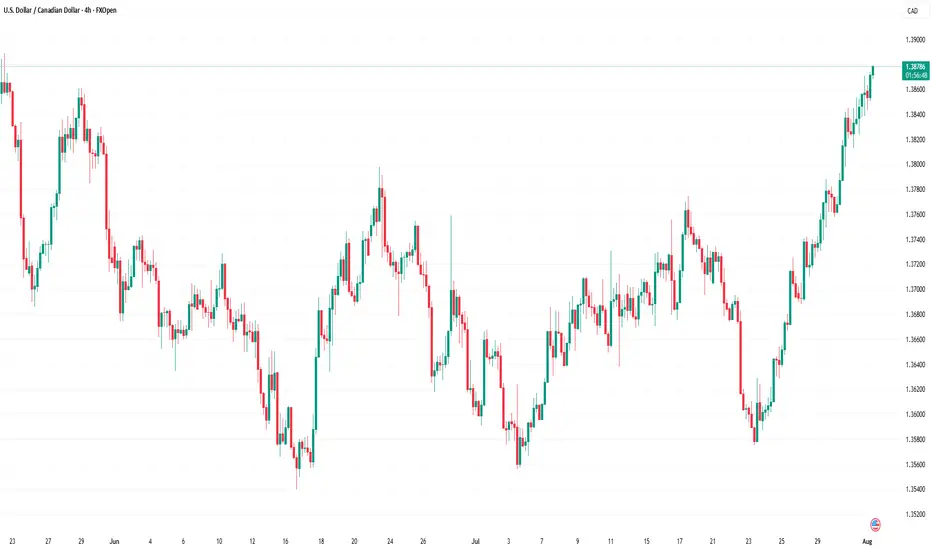
USD/CAD Rises to 2-Month HighUSD/CAD Rises to 2-Month High
Today, the USD/CAD exchange rate briefly exceeded the 1.3870 mark – the highest level seen this summer. In less than ten days, the US dollar has strengthened by over 2% against the Canadian dollar.
Why Is USD/CAD Rising?
Given that both the Federal Reserve and the Bank of Canada left interest rates unchanged on Wednesday (as expected), the primary driver behind the pair’s recent rally appears to be US President Donald Trump's decision to impose tariffs on several countries – including Canada:
→ Despite efforts by Prime Minister of Canada Mark Carney to reach an agreement with Trump, no deal was achieved;
→ Canadian goods exported to the US will now be subject to a 35% tariff;
→ The tariffs take effect from 1 August;
→ Goods compliant with the United States-Mexico-Canada Agreement (USMCA) are exempt.
Media analysts note that the tariffs are likely to increase pressure on the Canadian economy, as approximately 75% of the country's exports are destined for the United States.
USD/CAD Technical Analysis
At the end of July, the price formed a steep ascending channel (A-B), with bullish momentum confirmed by a decisive breakout above the 1.3790 resistance level, as illustrated by the arrow:
→ the pullback before the breakout was relatively shallow;
→ the bullish breakout was marked by a long bullish candlestick with a close near the session high;
→ following the breakout, the price confidently consolidated above 1.3790.
Provided that the fundamental backdrop does not undergo a major shift, bulls might attempt to maintain control in the market. However, the likelihood of a correction is also increasing, as the RSI indicator has entered extreme overbought territory.
Should USD/CAD show signs of a correction after its steep ascent, support might be found at:
→ line C, drawn parallel to the A-B channel at a distance of its width;
→ the previously mentioned 1.3790 level, which now acts as a support following the breakout.
This article represents the opinion of the Companies operating under the FXOpen brand only. It is not to be construed as an offer, solicitation, or recommendation with respect to products and services provided by the Companies operating under the FXOpen brand, nor is it to be considered financial advice.
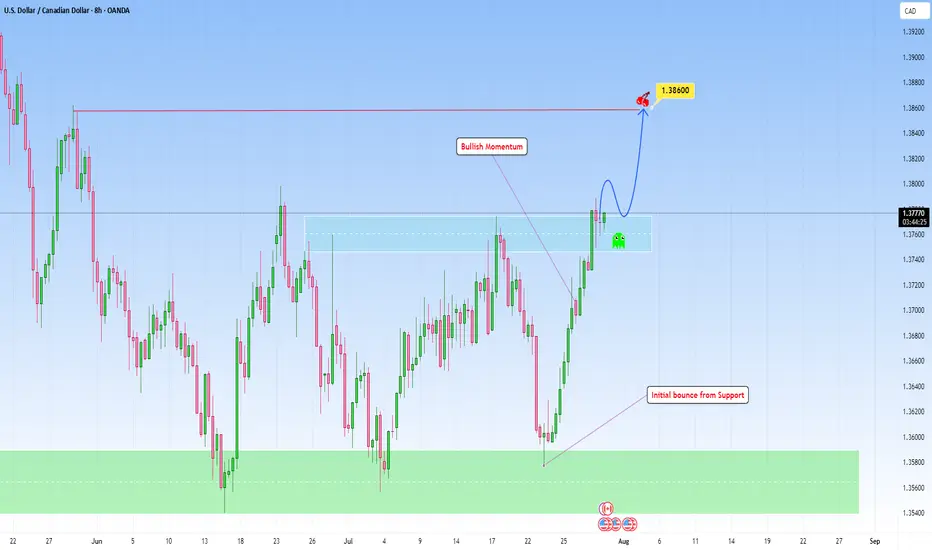
USDCAD bounced from Support and can continue higherLooking at the chart and the overall structure, I think we can favor the continuation setup with a emphasis on price action at key zones, particularly when price breaks out then can revisit this structure for a retest.
This bounce off support has been accomplished in my previous analysis:
Here, if price breaks with strength and dips back into the area and holds with bullish confirmation (likely a wick rejection or bullish engulfing on lower timeframes), that would be the cue to get in.
I am projecting the next target to 1.38600 that makes sense as a logical level for trend continuation and that I find achievable.
Buy USDCADLooking to buy it if it reaches my zone, though the market does whatever it wants, we ride along
USDCAD - Re entryWe were bullish yesterday, we took a trade but we were stopped at a 14 Pips. We are taking a buy trade today too, a non confirmation low risk trade.
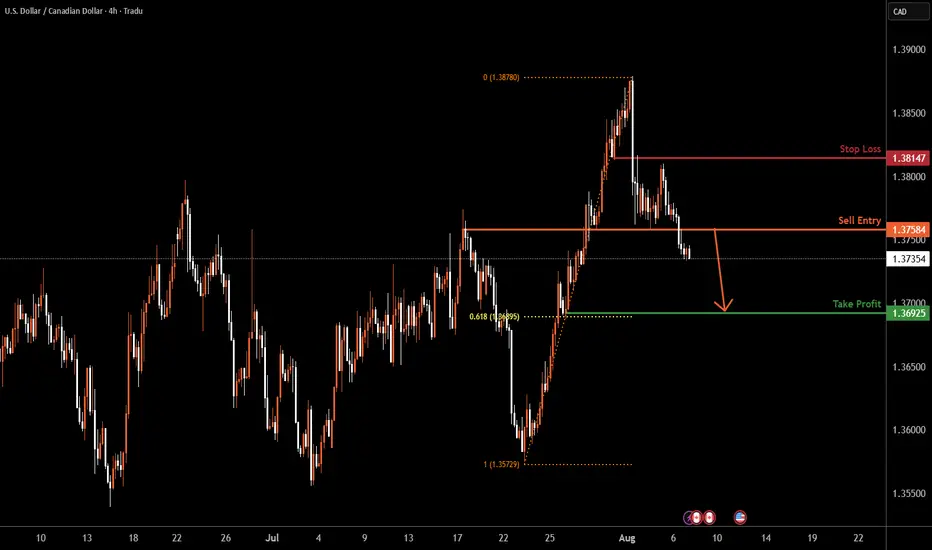
USDCAD H4 | Potential bearish dropUSD/CAD is is rising towards the sell entry at 1.3758, which is an overlap resistance and could drop from this level to the downside.
Stop loss is at 1.3758, which is an overlap resistance.
Take profit is at 1.3692, which is a pullback support that aligns witht he 61.8% Fibonacci retracement.
High Risk Investment Warning
Trading Forex/CFDs on margin carries a high level of risk and may not be suitable for all investors. Leverage can work against you.
Stratos Markets Limited (tradu.com ):
CFDs are complex instruments and come with a high risk of losing money rapidly due to leverage. 65% of retail investor accounts lose money when trading CFDs with this provider. You should consider whether you understand how CFDs work and whether you can afford to take the high risk of losing your money.
Stratos Europe Ltd (tradu.com ):
CFDs are complex instruments and come with a high risk of losing money rapidly due to leverage. 66% of retail investor accounts lose money when trading CFDs with this provider. You should consider whether you understand how CFDs work and whether you can afford to take the high risk of losing your money.
Stratos Global LLC (tradu.com ):
Losses can exceed deposits.
Please be advised that the information presented on TradingView is provided to Tradu (‘Company’, ‘we’) by a third-party provider (‘TFA Global Pte Ltd’). Please be reminded that you are solely responsible for the trading decisions on your account. There is a very high degree of risk involved in trading. Any information and/or content is intended entirely for research, educational and informational purposes only and does not constitute investment or consultation advice or investment strategy. The information is not tailored to the investment needs of any specific person and therefore does not involve a consideration of any of the investment objectives, financial situation or needs of any viewer that may receive it. Kindly also note that past performance is not a reliable indicator of future results. Actual results may differ materially from those anticipated in forward-looking or past performance statements. We assume no liability as to the accuracy or completeness of any of the information and/or content provided herein and the Company cannot be held responsible for any omission, mistake nor for any loss or damage including without limitation to any loss of profit which may arise from reliance on any information supplied by TFA Global Pte Ltd.
The speaker(s) is neither an employee, agent nor representative of Tradu and is therefore acting independently. The opinions given are their own, constitute general market commentary, and do not constitute the opinion or advice of Tradu or any form of personal or investment advice. Tradu neither endorses nor guarantees offerings of third-party speakers, nor is Tradu responsible for the content, veracity or opinions of third-party speakers, presenters or participants.
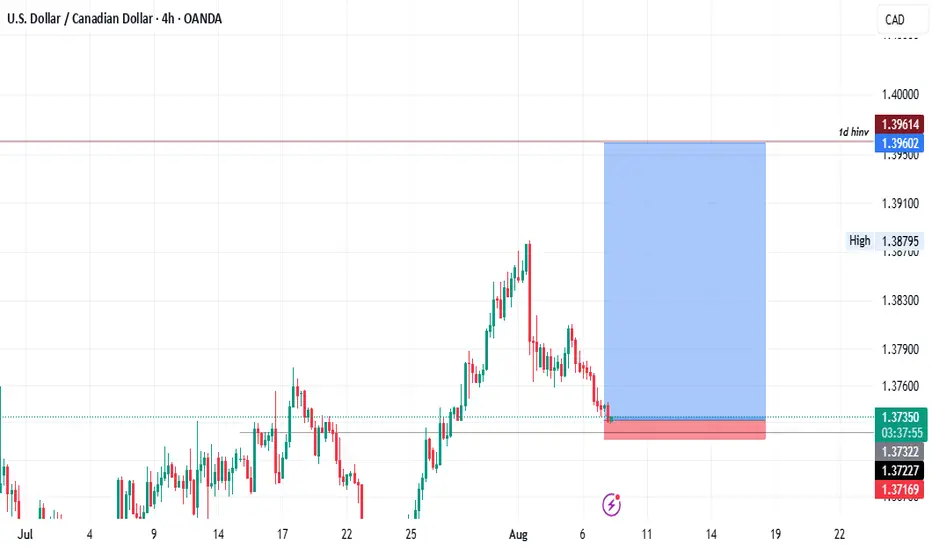
USDCAD Long?- In the monthly (higher timeframes), USDCAD is bullish.
- In the weekly timeframe, price reaction seems to trace a clear uptrend
- In the daily timeframe, it is also in a clear uptrend but at retracement phase due to a hidden 1 day invalidation.
- With our current 4hr timeframe forming what looks like an accumulation in an important psychological level we are tracing for low risk (14 Pips) high reward of up to 1:13 on the trade.
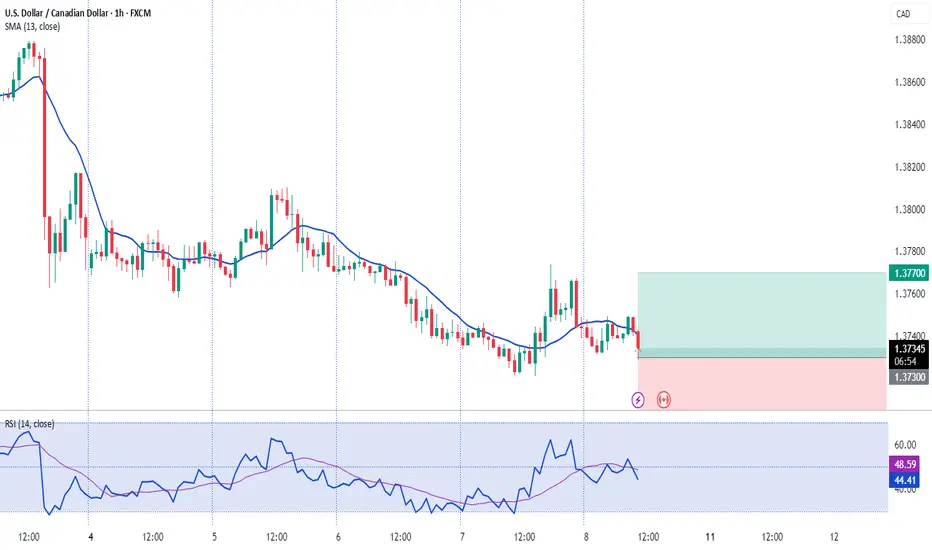
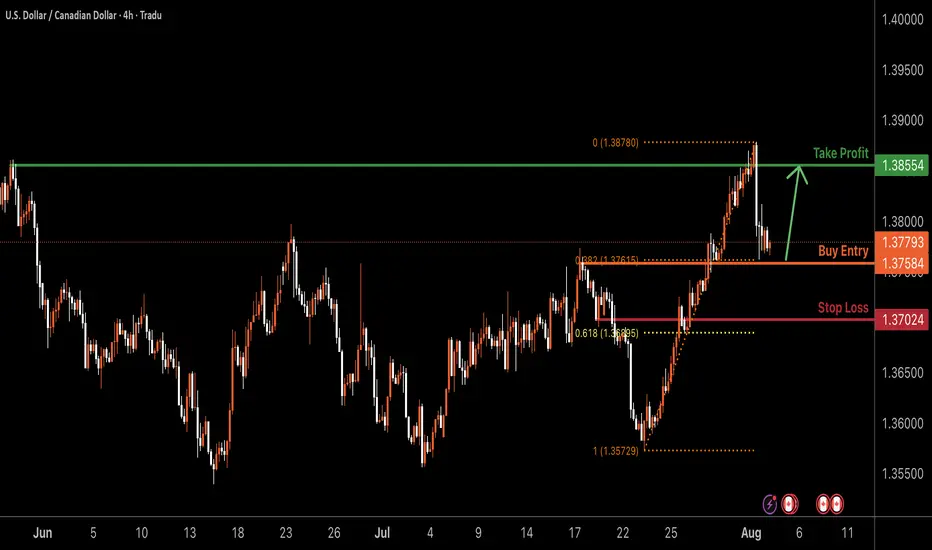
USDCAD H4 | Bullish bounce off pullback supportUSD/CAD is falling toward the buy entry, identified as a pullback support that aligns with the 38.2% Fibonacci retracement and could potentially bounce to the upside.
Buy entry is at 1.3758, which is a pullback support that lines up with the 38.2% Fibonacci retracement.
Stop loss is at 1.37024, which is a pullback support that is slightly above the 61.8% Fibonacci retracement.
Take profit is at 1.3855, which is a pullback resistance.
High Risk Investment Warning
Trading Forex/CFDs on margin carries a high level of risk and may not be suitable for all investors. Leverage can work against you.
Stratos Markets Limited (tradu.com ):
CFDs are complex instruments and come with a high risk of losing money rapidly due to leverage. 65% of retail investor accounts lose money when trading CFDs with this provider. You should consider whether you understand how CFDs work and whether you can afford to take the high risk of losing your money.
Stratos Europe Ltd (tradu.com ):
CFDs are complex instruments and come with a high risk of losing money rapidly due to leverage. 66% of retail investor accounts lose money when trading CFDs with this provider. You should consider whether you understand how CFDs work and whether you can afford to take the high risk of losing your money.
Stratos Global LLC (tradu.com ):
Losses can exceed deposits.
Please be advised that the information presented on TradingView is provided to Tradu (‘Company’, ‘we’) by a third-party provider (‘TFA Global Pte Ltd’). Please be reminded that you are solely responsible for the trading decisions on your account. There is a very high degree of risk involved in trading. Any information and/or content is intended entirely for research, educational and informational purposes only and does not constitute investment or consultation advice or investment strategy. The information is not tailored to the investment needs of any specific person and therefore does not involve a consideration of any of the investment objectives, financial situation or needs of any viewer that may receive it. Kindly also note that past performance is not a reliable indicator of future results. Actual results may differ materially from those anticipated in forward-looking or past performance statements. We assume no liability as to the accuracy or completeness of any of the information and/or content provided herein and the Company cannot be held responsible for any omission, mistake nor for any loss or damage including without limitation to any loss of profit which may arise from reliance on any information supplied by TFA Global Pte Ltd.
The speaker(s) is neither an employee, agent nor representative of Tradu and is therefore acting independently. The opinions given are their own, constitute general market commentary, and do not constitute the opinion or advice of Tradu or any form of personal or investment advice. Tradu neither endorses nor guarantees offerings of third-party speakers, nor is Tradu responsible for the content, veracity or opinions of third-party speakers, presenters or participants.
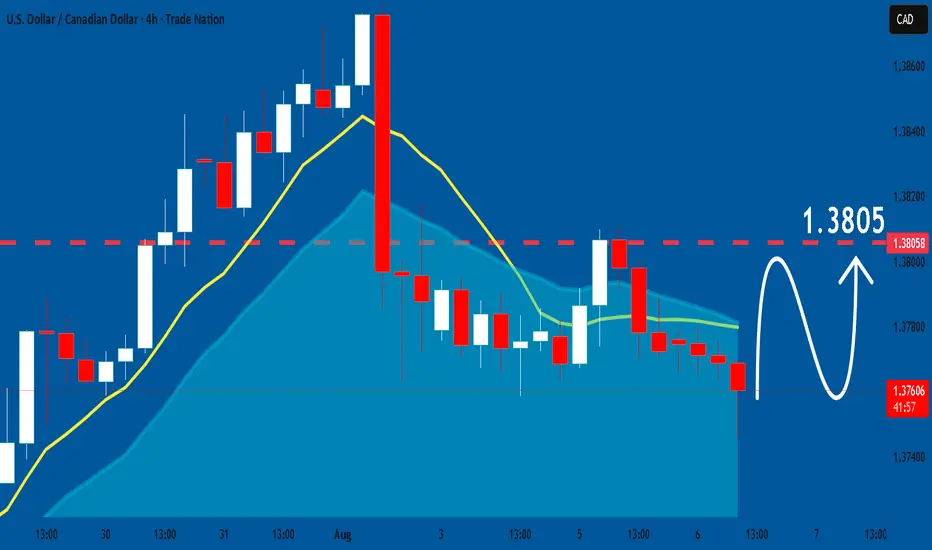
USDCAD: Bulls Will Push
Looking at the chart of USDCAD right now we are seeing some interesting price action on the lower timeframes. Thus a local move up seems to be quite likely.
Disclosure: I am part of Trade Nation's Influencer program and receive a monthly fee for using their TradingView charts in my analysis.
❤️ Please, support our work with like & comment! ❤️
#USDCAD Possible sale or possible purchase for this pair, whatever the market does first. When it reaches any of our marked zones. We will use an OBB or OBS. Using good R.R. management.
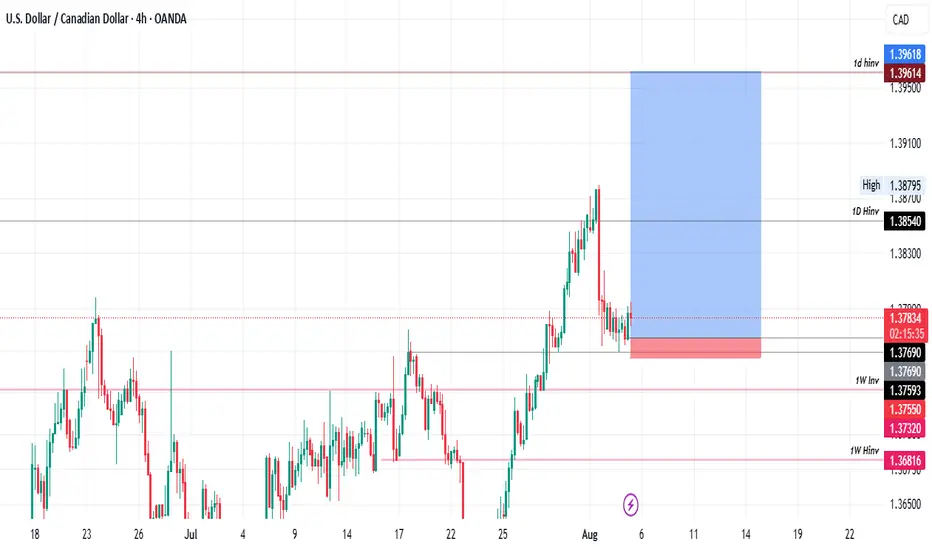
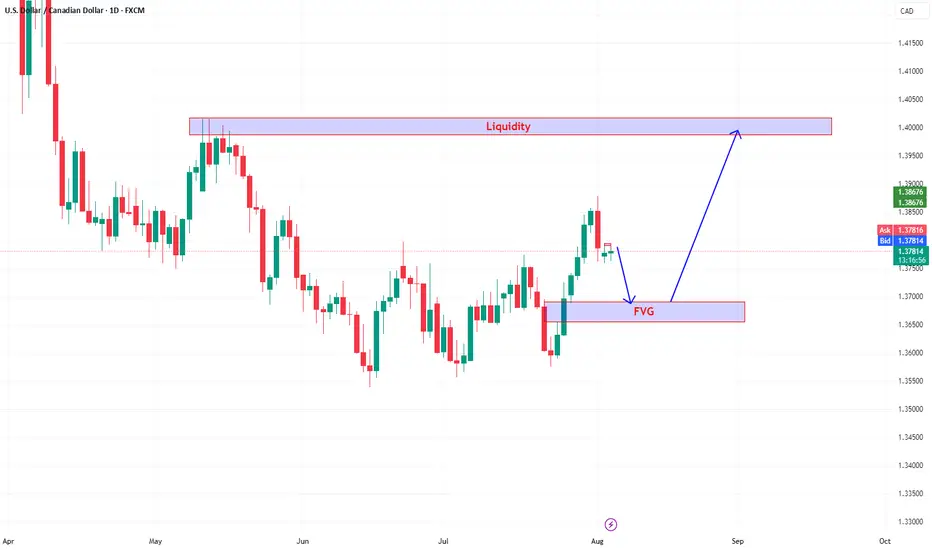
USDCAD is forming a bullish structure.We can a clear bullish structure forming after a series of higher highs and higher lows, indicating bullish momentum building. Recently, price rejected from a key swing high and appears to be pulling back. This pullback is targeting a Fair Value Gap (FVG) marked in the blue zone then bounce from the FVG zone back toward the overhead Liquidity Zone.
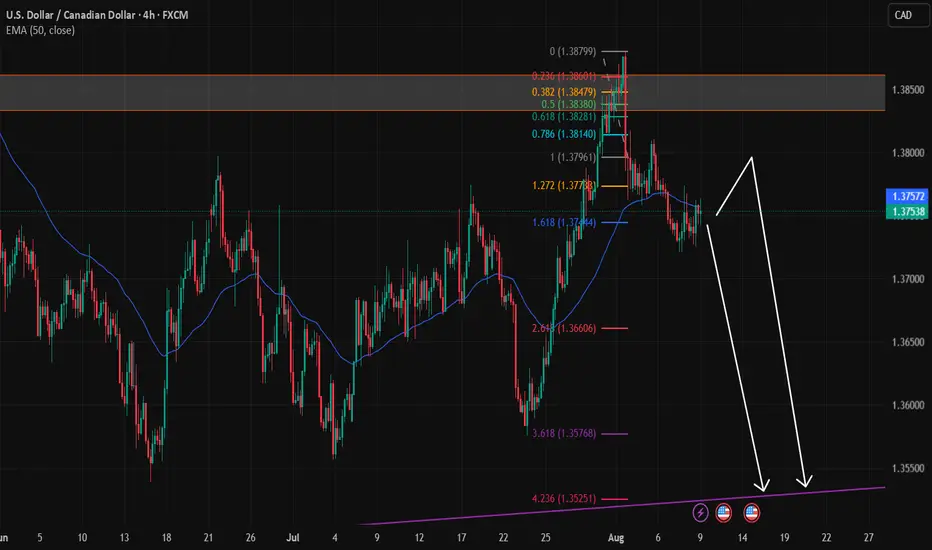
Next week sell USDCAD upon retracementHave a great weekend guys, for next week I am going to sell USDCAD upon retracement, targeting at the purple line there, coincidence with fibo 423.6. Reason is price had rejected the lower low level with great reversal candle, high chance continuing the big trend which is the downtrend. In previous I had posted that double bottom may formed and right now from candlestick analysis it seems the pattern no longer valid. Cheers~
Usd/Cadafter three bottoms its time to go up , return to my last chart on CAD u can see what i have said, buy.

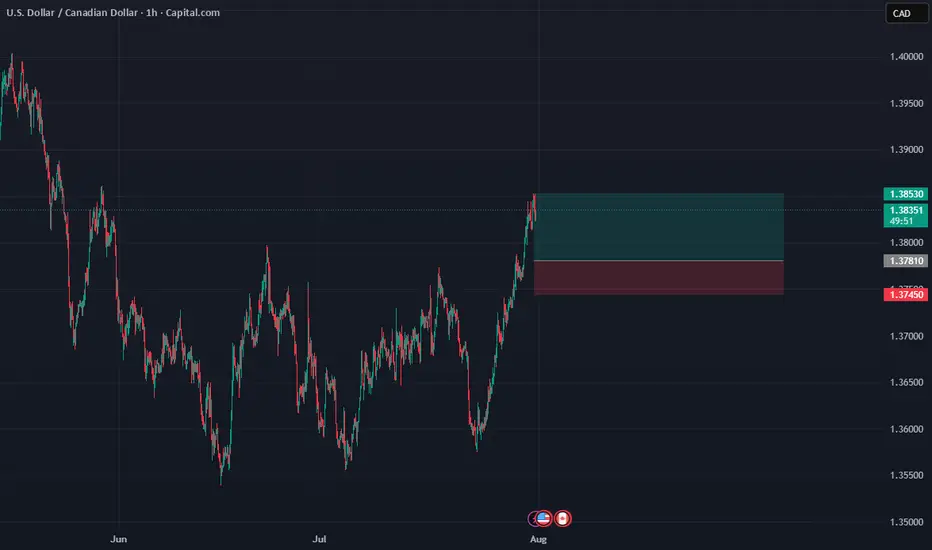
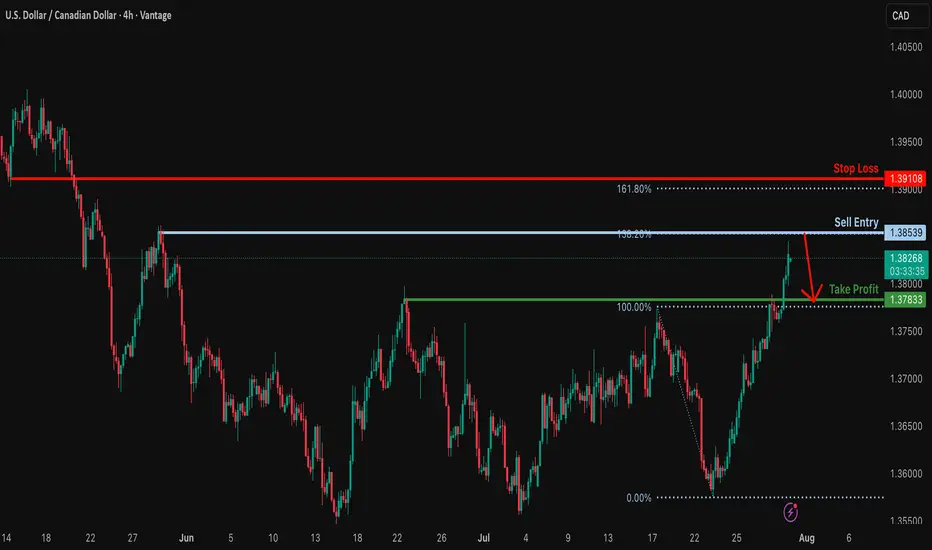
Could the Loonie reverse from here?The price is rising towards the resistance level, which is a swing high resistance that aligns with the 138.2% Fibonacci extension and could potentially reverse from this level to our take-profit.
Entry: 1.3853
Why we like it:
There is a swing high resistance that lines up with the 138.2% Fibonacci extension.
Stop loss: 1.3910
Why we like it:
There is a pullback resistance that is slightly above the 161.8% Fibonacci extension.
Take profit: 1.3783
Why we like it:
There is a pullback support.
Enjoying your TradingView experience? Review us!
Please be advised that the information presented on TradingView is provided to Vantage (‘Vantage Global Limited’, ‘we’) by a third-party provider (‘Everest Fortune Group’). Please be reminded that you are solely responsible for the trading decisions on your account. There is a very high degree of risk involved in trading. Any information and/or content is intended entirely for research, educational and informational purposes only and does not constitute investment or consultation advice or investment strategy. The information is not tailored to the investment needs of any specific person and therefore does not involve a consideration of any of the investment objectives, financial situation or needs of any viewer that may receive it. Kindly also note that past performance is not a reliable indicator of future results. Actual results may differ materially from those anticipated in forward-looking or past performance statements. We assume no liability as to the accuracy or completeness of any of the information and/or content provided herein and the Company cannot be held responsible for any omission, mistake nor for any loss or damage including without limitation to any loss of profit which may arise from reliance on any information supplied by Everest Fortune Group.
ENTRY USDCADDisclaimer:
This is merely a chart-based analytical trading idea and is not considered investment advice. Please manage your risks carefully and conduct your own research before making any trading decisions.