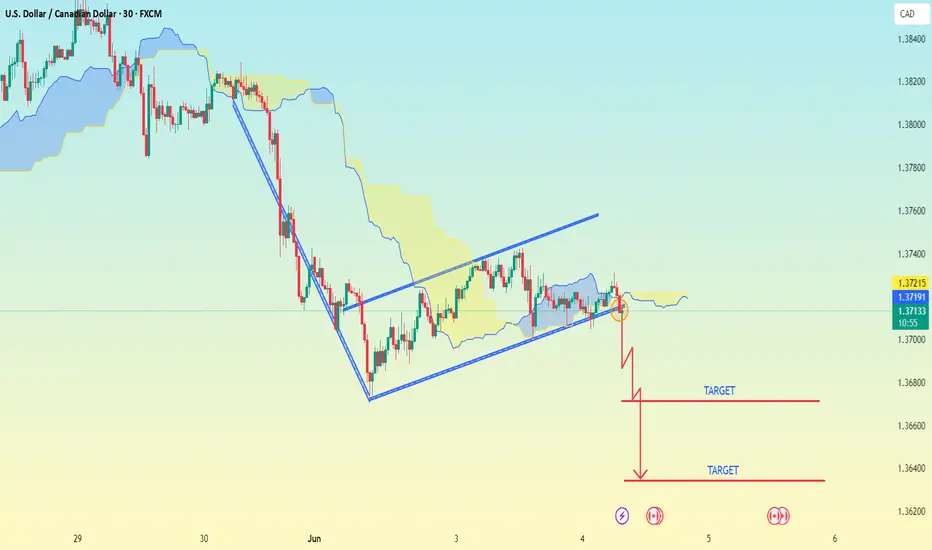
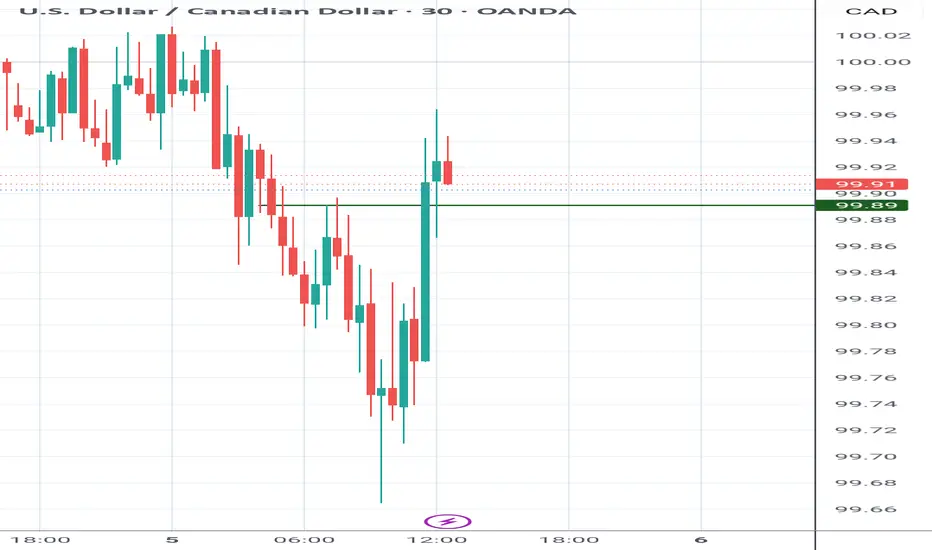
USD/CAD..30M chart bearish flag pattern.Looking at the chart I'm provided, here's a quick technical breakdown:
---
📉 Chart Analysis
Pair: Likely USDCAD (based on visible digits and style).
Pattern: Bearish rising channel has broken down.
Breakdown Confirmed: Price has clearly broken below the lower channel support, with bearish continuation signs.
Ichimoku Cloud: Price has moved below the Kumo (cloud), which confirms downside momentum.
Red Arrows & Levels: You've drawn a zigzag-style projection with two target zones marked.
---
🎯 Identified Target Levels (approximate)
Based on your chart's drawing and current price (1.3710):
1. Target 1: Around 1.3660
2. Target 2: Around 1.3620
These correspond to the two red horizontal lines marked "TARGET" in your chart.
---
✅ Summary
Sell Bias Active
Target 1: 1.3660
Target 2: 1.3620
Invalidation (Stop Loss suggestion): Above 1.3745–1.3755 zone (back inside channel or Kumo)
Would you like a more precise projection using Fibonacci levels or a cleaned-up chart version with these targets plotted clearly?
CADUSD trade ideas
USDCAD WILL DELIVER BY FIREFX:USDCAD WeeklyTF and MontlyTF Buy analysis, Its surely going to be hit by the grace of God the Almighty.

possibility of uptrendThe price is expected to cross the resistance trend line and advance to the specified resistance area. Then, considering the price behavior in the resistance area, possible scenarios have been identified.
USDCAD Buy- Go for short term buy then manage your trade
- potentially go higher or significant reversing to the upside
- Refine entry with smaller SL for better RR, if your strategy allow
A Message To Traders:
I’ll be sharing high-quality trade setups for a period time. No bullshit, no fluff, no complicated nonsense — just real, actionable forecast the algorithm is executing. If you’re struggling with trading and desperate for better results, follow my posts closely.
Check out my previously posted setups and forecasts — you’ll be amazed by the high accuracy of the results.
"I Found the Code. I Trust the Algo. Believe Me, That’s It."

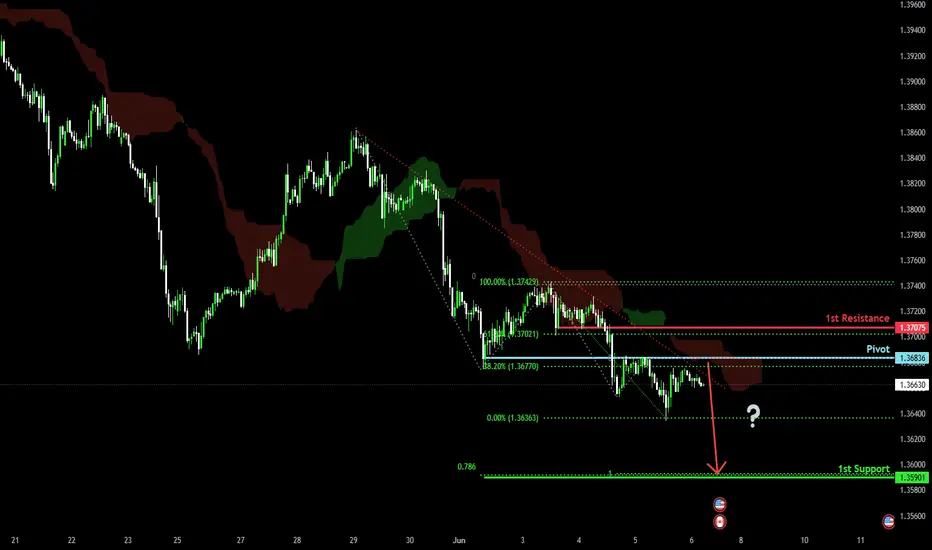
Potential bearish drop for the Loonie?The price is rising towards the pivot, which is an overlap resistance, and could drop to the 1st support.
Pivot: 1.3683
1st Support: 1.3590
1st Resistance: 1.3707
Risk Warning:
Trading Forex and CFDs carries a high level of risk to your capital and you should only trade with money you can afford to lose. Trading Forex and CFDs may not be suitable for all investors, so please ensure that you fully understand the risks involved and seek independent advice if necessary.
Disclaimer:
The above opinions given constitute general market commentary, and do not constitute the opinion or advice of IC Markets or any form of personal or investment advice.
Any opinions, news, research, analyses, prices, other information, or links to third-party sites contained on this website are provided on an "as-is" basis, are intended only to be informative, is not an advice nor a recommendation, nor research, or a record of our trading prices, or an offer of, or solicitation for a transaction in any financial instrument and thus should not be treated as such. The information provided does not involve any specific investment objectives, financial situation and needs of any specific person who may receive it. Please be aware, that past performance is not a reliable indicator of future performance and/or results. Past Performance or Forward-looking scenarios based upon the reasonable beliefs of the third-party provider are not a guarantee of future performance. Actual results may differ materially from those anticipated in forward-looking or past performance statements. IC Markets makes no representation or warranty and assumes no liability as to the accuracy or completeness of the information provided, nor any loss arising from any investment based on a recommendation, forecast or any information supplied by any third-party.
USD CAD at weekly support likely to re bound from here Price is consolidating in a tight range after prior upward move → suggesting bullish accumulation. If price breaks above 1.3770, a rally toward 1.3820 is likely. However, a breakdown below 1.3680 could attract sellers toward 1.3620.
Usdcad Sellprice is bearish still on the 4hr tf and is in a 4hr supply zone. there are supplies across the lower tfs within the 4hr zone. there is a particular one on the 15m tf that is strong. looking to sell once price trades below last ll.
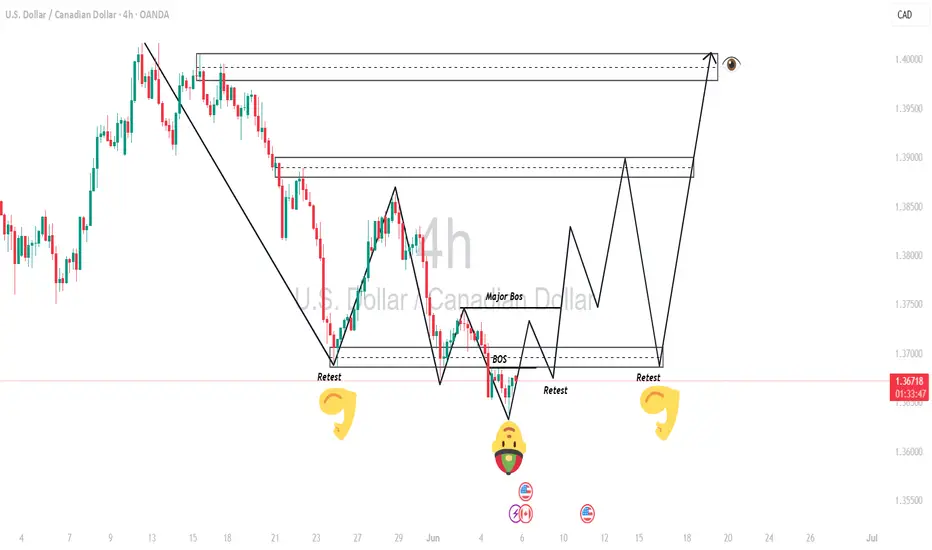
USDCAD TREND REVERSAL OR CONTINUETION OF BEARISH TREND? The price has been making lower highs and lower lows, especially from late May into early June, indicating sustained downward momentum. There is a small bullish pullback (seen in the last few candles), but no strong reversal confirmation yet if price action form BOS and invers H & S then we can expect a short term bullish trend reversal.
USDCAD Potential DownsidesHey traders, in today's trading session we are monitoring USDCAD for a selling opportunity around 1.37500 zone, USDCAD is trading in a downtrend and currently is in a correction phase in which it is approaching the trend at 1.37500 support and resistance area.
Trade safe, Joe.

USD/CAD under pressure as RBC warns of dollar overvaluationRBC Global Asset Management has warned that the U.S. dollar appears significantly overvalued. The firm points to the ballooning U.S. budget deficit—now forecast to surpass $1.9 trillion this year—as a key factor behind its bearish outlook.
RBC's position might be reflected in the FX market with the USD/CAD under pressure. The pair has been forming lower highs and lower lows since late May, suggesting a potential continuation of the short-term downtrend.
Key support levels to watch might include 1.3640, 1.3600, and potentially 1.3560 if selling accelerates. On the upside, a recovery might need to break above 1.3720, with further resistance possibly around 1.3760 and 1.3820.

Bearish reversal off overlap resistance?USD/CAD is rising towards the resistance level which is an overlap resistance that lines up with the 23.6% and the 50% Fibonacci retracement and could reverse from this level to our take profit.
Entry: 1.3691
Why we like it:
There is an overlap resistance that lines up with the 23.6% and the 50% Fibonacci retracement.
Stop loss: 1.3738
Why we like it:
There is a pullback resistance level that is slightly below the 50% Fibonacci retracement.
Take profit: 1.3635
Why we like it:
There is a pullback support level.
Enjoying your TradingView experience? Review us!
Please be advised that the information presented on TradingView is provided to Vantage (‘Vantage Global Limited’, ‘we’) by a third-party provider (‘Everest Fortune Group’). Please be reminded that you are solely responsible for the trading decisions on your account. There is a very high degree of risk involved in trading. Any information and/or content is intended entirely for research, educational and informational purposes only and does not constitute investment or consultation advice or investment strategy. The information is not tailored to the investment needs of any specific person and therefore does not involve a consideration of any of the investment objectives, financial situation or needs of any viewer that may receive it. Kindly also note that past performance is not a reliable indicator of future results. Actual results may differ materially from those anticipated in forward-looking or past performance statements. We assume no liability as to the accuracy or completeness of any of the information and/or content provided herein and the Company cannot be held responsible for any omission, mistake nor for any loss or damage including without limitation to any loss of profit which may arise from reliance on any information supplied by Everest Fortune Group.

USDCAD BUY SIGNAL Entry Point: 1.36800USDCAD BUY SIGNAL
Entry Point: 1.36800
🎯 Target 1: 1.37500
🎯 Target 2: 1.38000
🎯 Final Target: 1.38300
⚠️ Risk Management is CRUCIAL
– Use a proper stop-loss every time
– Don’t overexpose your account
– Risk only what fits your strategy
📊 Trade Setup Insight:
– Price rebounding from support
– Bullish structure forming
– Momentum favoring upside push
✅ Book profits at each level
✅ Adjust SL to breakeven after T1
✅ Patience > Emotion in trading
📌 Consistency brings results
📌 Follow your system – not the crowd
📌 Capital protection = long-term success
📢 Educational purposes only – trade smart, trade safe!

USDCAD SHORT TERM BULLISH CORRECTIONGenerally, the US Dollar is losing ground against major currencies. The decline is stemming from pending tariffs equilibrium and looming Fed rate cuts. On the USDCAD daily chart, the US Dollar is poised to decline further to the unmitigated zone. Once this demand zone is contacted we are likely to clearer price action direction on whether to buy or sell further. Our bias is a short term bullish market correction outlook once the unmitigated zone is contacted.
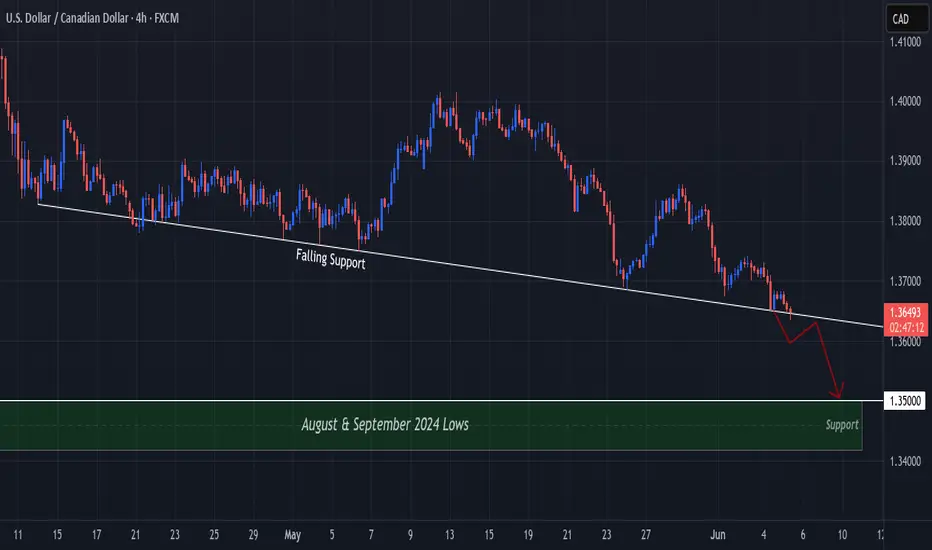
UCAD Bears Ready to Break 2 Month Long Falling Support??OANDA:USDCAD has been supported by a Falling Support Trend line since August 14th and here soon Price could potentially give us a Bearish Break to that Trend line!
Once a Breakout is validated, we could look for a Retest Set-Up for some Short Opportunities to take Price down to the Support Zone created by the August and September 2024 Lows.
An interesting fact to point out is if you observe the reaction of Price when it tests the Falling Support, we can see Price arc and the following reactions arc smaller, suggesting Bulls are losing strength on the push off of the Falling Support!
Price Action is being heavily driven by Fundamentals in the markets this week:
-USD-
ADP Non-Farm Employment - Previous 60K / Forecast 111K / Actual 37K
ISM Services PMI - Previous 51.6 / Forecast 52 / Actual 49.9
ISM Manufacturing PMI - Previous 48.7 / Forecast 49.3 / Actual 48.5
ISM Manufacturing Prices - Previous 69.8 / Forecast 70.2 / Actual 48.5
Unemployment Claims - Previous 239K / Forecast 236K / Actual 247K
*Average Hourly Earnings, Non-Farm Employment and Unemployment Rate are to be released tomorrow
-CAD-
BOC held Interest Rates @ 2.75%
Ivey PMI - Previous 47.9 / Forecast 48.3 / Actual 48.9
*Employment Change and Unemployment are to be released tomorrow
With BOC holding Interest Rates and the Federal Reserve possibly looking to cut rates because of a "softening labor market", this could fuel CAD to overcome the pair and put Bears in control to pull Prices lower!
tradingview.sweetlogin.com
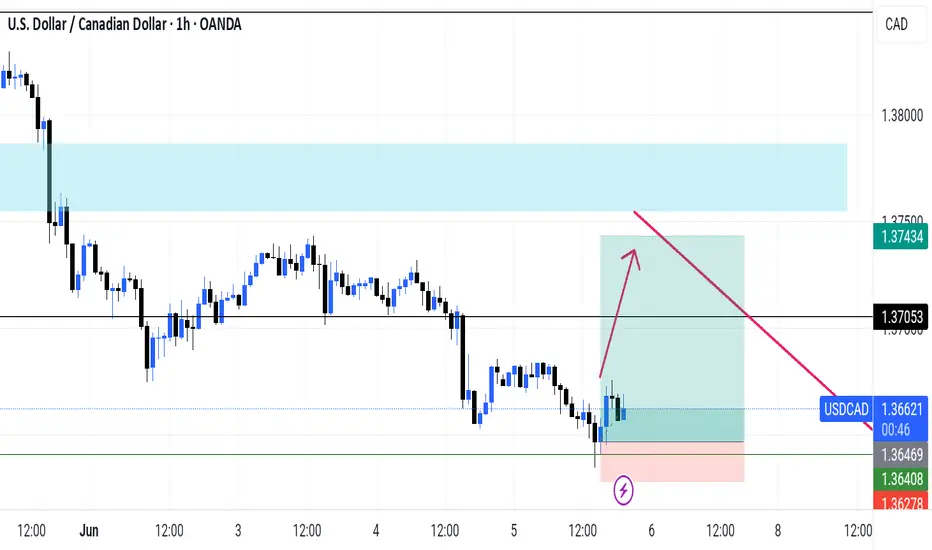
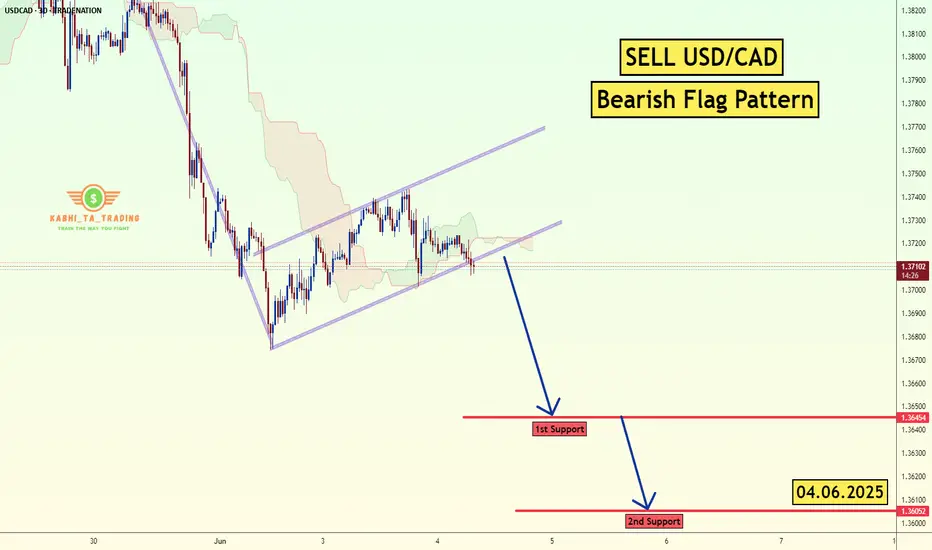
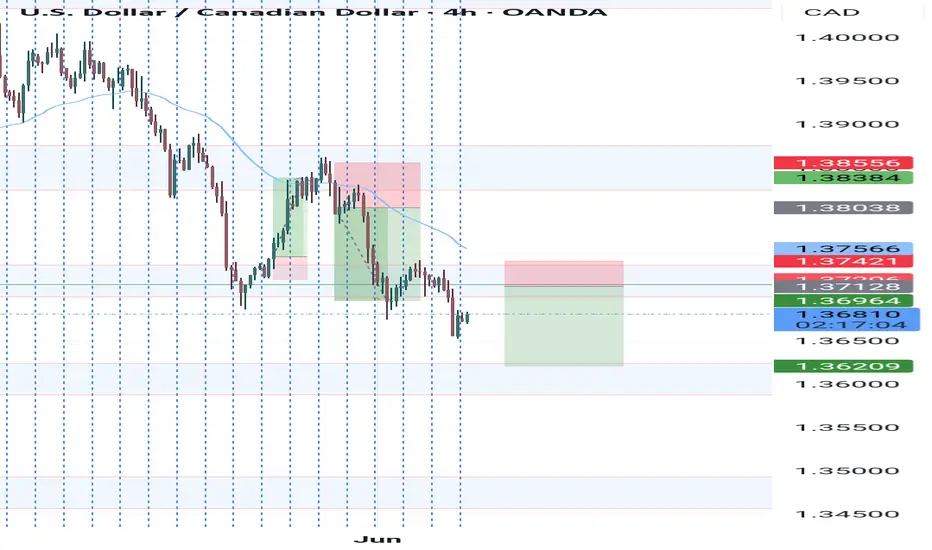
USD/CAD - Bearish Flag (04.06.2025)The USD/CAD Pair on the M30 timeframe presents a Potential Selling Opportunity due to a recent Formation of a Bearish Flag Pattern. This suggests a shift in momentum towards the downside in the coming hours.
Possible Short Trade:
Entry: Consider Entering A Short Position around Trendline Of The Pattern.
Target Levels:
1st Support – 1.3645
2nd Support – 1.3605
🎁 Please hit the like button and
🎁 Leave a comment to support for My Post !
Your likes and comments are incredibly motivating and will encourage me to share more analysis with you.
Best Regards, KABHI_TA_TRADING
Thank you.
Disclosure: I am part of Trade Nation's Influencer program and receive a monthly fee for using their TradingView charts in my analysis.
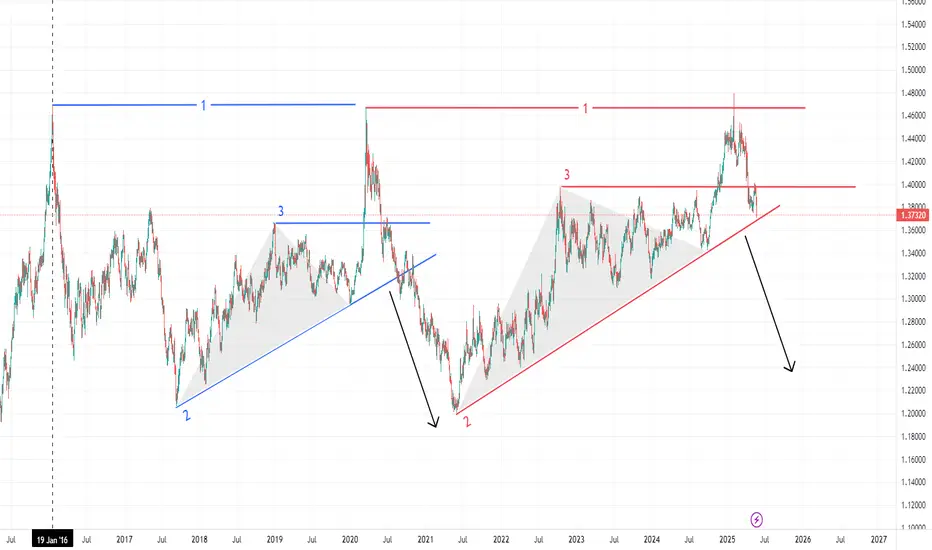
USDCAD A chance for Fall DownI see A chance for Fall down after breaks LEVEL 2 (trend line) similar to what happened before.
lets wait and see will happened next week.
Do you agree ? what's your idea ?
USDCAD Under PressureSeveral negative data points were released this week for the US dollar, led by the ADP Non-Farm Employment Change, which posted its lowest reading since March 2023 at just 37K. Additionally, the Non-Manufacturing PMI fell below the key 50 level, recording 49.9. These readings add further downside pressure on the US dollar. On the other hand, the Bank of Canada kept interest rates steady at 2.75%.
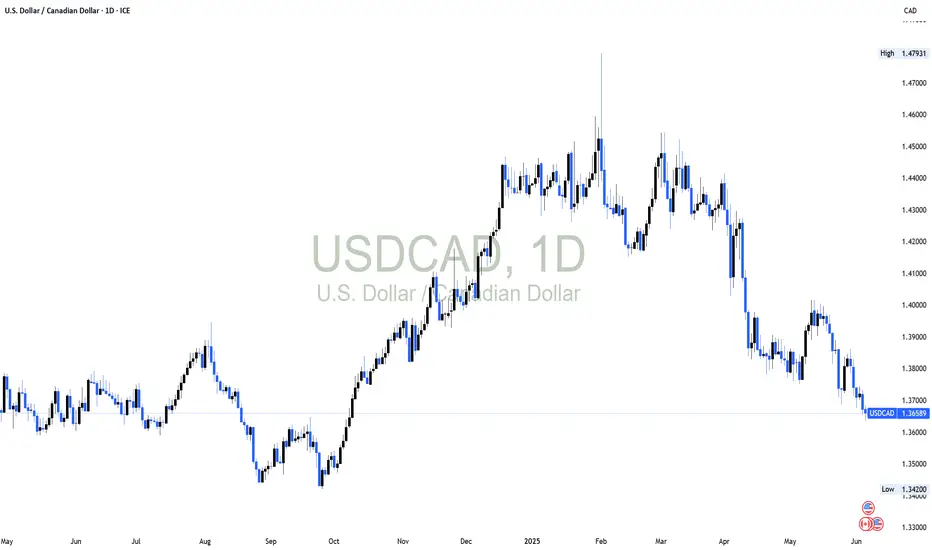
Technical Outlook on the Daily Chart
The US Dollar against the Canadian Dollar (USDCAD) is trading in a general downtrend, forming lower highs and lower lows, confirming the bearish momentum.
Traders should monitor any corrective rise toward the 1.38164 level as a potential opportunity to continue the downtrend and target 1.36015.
However, a break and daily candle close above 1.38611 would invalidate the bearish scenario.
Note
Markets are anticipating the US and Canadian employment data due on Friday, June 6, 2025. Significant volatility is expected upon their release, especially for the USDCAD pair.

USDCAD BUY 1.3575On the weekly chart, USDCAD forms a potential bullish bat pattern in the short term, with the buying position focusing on 1.3575, which is also within the previous demand area.

Usdcad This is another clean setup from the last signal we were expecting price to go down to de last support but for some reason I left early and we have price breaks the previous support and is now acting like a resistance so we are expecting price to retrace on that zone de we sell more
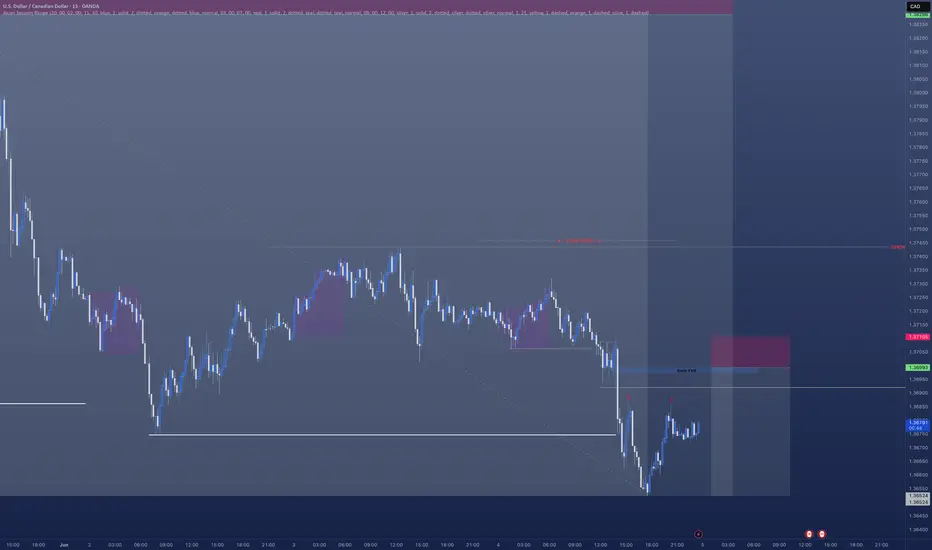
USDCAD - Short ContinuationHave a really nice short currently open on USDCAD
However I am looking to get a further position opened which come in the morning.
There's a clear break of structure.
- A nice FVG left behind.
- We are creating liquidity / inducement
- All pointing towards a nice further sell off in the morning.
Ideal situation is we sweep Asian session highs in the morning in the hope we move lower
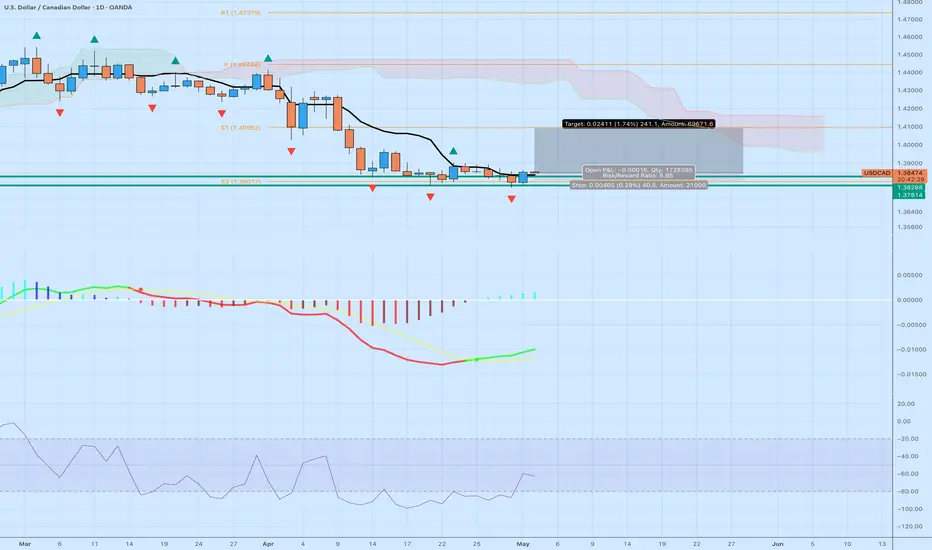
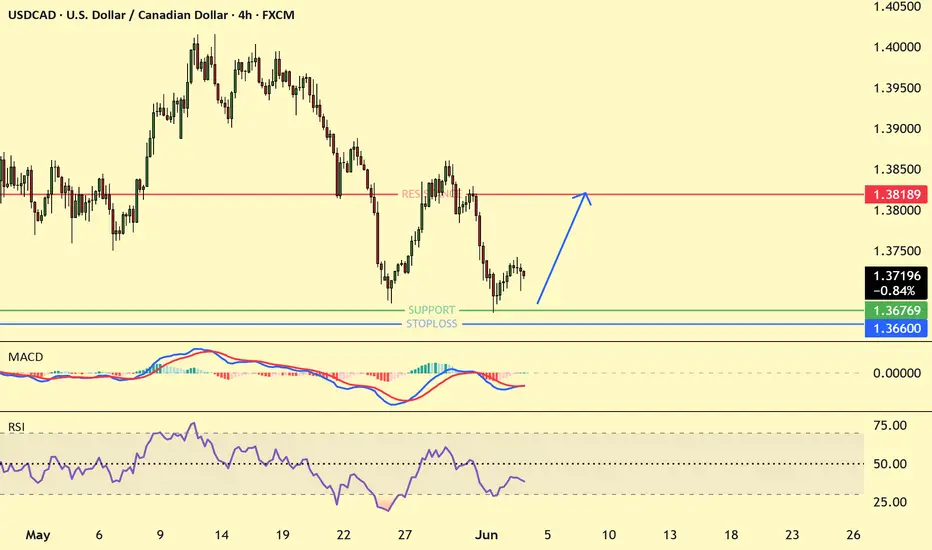
USD/CAD at a Turning PointTechnical Analysis: Signs of a Bottoming Out
USD/CAD’s technical picture is beginning to shift from bearish to cautiously bullish. Let’s start with what the daily chart is telling us. Over April, the pair’s decline started to stall around the 1.3780 – 1.3810 zone, which corresponds to a second support level (S2) on pivot point charts. In fact, 1.3780 has been identified by analysts as a “critical support”areaeconomies.com, and the market has thus far respected this floor. For roughly two weeks, prices have been consolidating in a tight range just above this support, roughly between 1.378 and 1.388. This kind of sideways basing after a drop indicates that selling pressure is no longer as aggressive – the CAD hasn’t been able to push the USD convincingly below the support line around 1.38.
Several momentum indicators are aligning to suggest that the worst of the downtrend may be over:
MACD Crossover: The Moving Average Convergence Divergence (MACD) indicator, a favorite tool for gauging trend changes, is on the verge of a bullish crossover (i.e. the MACD line is crossing above the signal line). As of late April, daily MACD had already flipped to a “Buy” readingfortrade.com. A bullish crossover after a prolonged down-move implies the downward momentum is fading and buyers are starting to gain the upper hand. We’re also seeing the MACD histogram (which visualizes the difference between the MACD and its signal) tick up from deeply negative values toward the zero line, reinforcing the idea of a momentum reversal.
RSI Rising from Oversold: The Relative Strength Index (RSI), which measures the speed and change of price movements, dipped into oversold territory during the April sell-off. (Typically, an RSI reading below 30 is considered oversold and a possible sign of an overextended move.) In late April, USD/CAD’s daily RSI was hovering in the low 30sfxstreet.com. Now, in early May, the RSI has climbed upward, moving through the 40s and toward the mid-50s. This upward turn suggests that the prior bearish momentum is abating – in other words, sellers are running out of steam and buyers are gradually stepping in. Notably, the RSI made higher lows even as price made a lower low around 1.378, a classic bullish divergence hinting that the downtrend was losing strength.
Support and Price Action: Price action itself underscores the potential for a bottom. The 1.3800 area (pivot S2)has been tested multiple times and remains intactfxstreet.com. Each dip into the high-1.37s was met with buying interest, as evidenced by candles with lower wicks and quick recoveries back above 1.38. This demand zonearound 1.378–1.381 has effectively absorbed selling pressure. One trader on TradingView noted that “USD/CAD is bouncing off a major daily support level around 1.38100 after a strong bearish move. Price action shows early signs of bullish interest, with the potential for a correction toward the 50-day Simple Moving Average.”tradingview.com. The fact that the pair is holding this support is crucial – it provides a clear line in the sand. As long as 1.3780 holds, the bullish thesis remains alive. A break below that would be a warning sign, but so far the floor has held firm.
Ichimoku Cloud and A Shift in Trend: The daily Ichimoku cloud on the chart (the colored cloud area representing support/resistance and trend) is still positioned above current prices – a legacy of the prior downtrend. However, the pair’s consolidation means it is no longer plunging deeper below the cloud; instead, it’s inching closer to the cloud’s base. Often, when a trend is about to reverse, we see price start testing the underside of the Ichimoku cloud or the baseline (Kijun-sen). While USD/CAD hasn’t broken out above the cloud yet, it’s noteworthy that the cloud ahead is thinning and flattening. A thinner cloud can be easier to break, and a flat Kijun line (baseline) around the 1.40–1.41 area could act like a magnet for price if bullish momentum kicks in. In short, the Ichimoku system is saying the trend is still technically bearish, but conditions are improving for a potential bullish breakif buyers can push the price into the cloud.
Another technical element worth mentioning is the moving averages. During the decline, USD/CAD stayed below short-term moving averages, which acted as resistance. Now we see price testing those moving averages from below. For instance, the 10-day exponential MA and 20-day MA lurk around 1.3870–1.3900 – right where the current consolidation top is. A break above 1.39 would not only clear this minor consolidation range but also put the price back above those moving averages, a bullish sign. Beyond there, the 50-day SMA (around the mid-1.41s) could be an initial target for a rebound. All in all, the technical setup is showing early glimmers of a reversal: a solid support base, momentum indicators flipping positive, and weakening bearish forces. This lays a technical foundation for the argument to go long USD/CAD.
Why This Could Be an Opportunity to Go Long USD/CAD
Bringing together the technical signals and the macro context, the case for a USD/CAD rebound is getting stronger. Here’s a quick recap of why early May 2025 may be an attractive entry point for USD/CAD longs (buying USD against CAD):
Rock-Solid Support: The pair has a concrete floor around 1.3780–1.3800 that has held firmly through multiple tests. This pivot support (S2) level has proven its strengthfxstreet.com, indicating significant buying interest at those lows. A strong support means downside risk can be well-defined (for example, one can place a stop-loss just below it in a trade scenario), and it often serves as a launchpad for rebounds when the broader trend shifts.
Momentum Shift to Bullish: Key momentum indicators are flipping in favor of USD momentum. The MACD on the daily chart has turned upward, signaling waning bearish momentum and a possible bullish crossover – a classic early reversal sign. Likewise, the RSI has risen out of oversold territoryfxstreet.com, showing that the prior selling momentum is exhausted. In fact, a short-term trading model as of Apr 29 showed multiple daily indicators (MACD, RSI, Stochastics) all giving “Buy” signals for USD/CADfortrade.com. When formerly pessimistic indicators start signaling “buy” in unison, it’s often a telltale sign of a trend ready to change direction.
Bullish Price Action Clues: Price is speaking volumes: higher lows are forming on intraday charts and the pair is making attempts to push higher within the recent range. We’ve observed bullish candlestick patterns like small daily dojis and hammers near the lows, reflecting indecision and failed attempts by sellers to break lower. This kind of consolidation after a drop often indicates that the next significant move could be up, especially given the momentum backdrop. Additionally, if USD/CAD breaks above the 1.3900 resistance (which is the upper bound of the consolidation and near the 10-day/20-day moving averagesfxstreet.com), it would mark the first higher-high in weeks – essentially confirming the short-term trend reversal.
USD Fundamentals Support a Rise: The U.S. dollar’s broader fundamentals are relatively robust. The Fed’s higher-for-longer stance (with only modest rate cuts expected later) keeps USD interest rates attractiveam.jpmorgan.com, and the U.S. economy has been outperforming many peers in growth, which has underpinned the USD’s strengtham.jpmorgan.com. This means any USD weakness narrative might have been overdone – if traders realize the Fed won’t ease as much as hoped, USD could get a second wind. A stable or rising USD on the global stage directly benefits a long USD/CAD position.
Canadian Headwinds (Oil & Risk): The Canadian dollar, in contrast, faces a few headwinds. Commodity support is lacking – with oil prices recently in the doldrums at 4-year lows around $58investingnews.com, a key pillar of CAD strength has crumbled. Unless oil stages a dramatic comeback (which is not expected immediately, given only a moderate rebound to ~$68–$74 forecasted by the EIAinvestingnews.com), the CAD could struggle to maintain its recent strength. On top of that, if global risk appetite wavers, traders could rotate out of risk-sensitive currencies like CAD into safer havens. In short, the CAD may have enjoyed a good run, but the tables appear set to turn in favor of the USD.
Attractive Risk/Reward Setup: From a trading perspective, going long USD/CAD near current levels offers a compelling risk-to-reward scenario. The support at ~1.3780 provides a logical and tight risk cutoff – if the pair falls decisively below that, one can admit the bullish thesis was premature and exit. On the upside, even a retracement to mid-range resistance levels like 1.4000–1.4100 (around the 50-day MA or pivot resistance) would yield a solid gain relative to the risk. The trader who shared the long idea on USD/CAD set a target around 1.4140, just shy of major resistance, highlighting the potential for a move of several hundred pips off the lows if the reversal takes holdtradingview.com. The combination of well-defined support, improving indicators, and room overhead for a bounce means the odds are tilted that a long position could be rewarded.
Of course, no trade or investment is guaranteed – and one must always stay vigilant. If USD/CAD were to close below ~1.3780 support, it would call into question the bullish setup and could open the door to further downside (perhaps another leg down to the mid-1.37 or even low 1.36 area in a bearish scenario). But as things stand, the evidence leans bullish, and the reward potential outweighs the remaining downside risk, in our view.