CADUSD trade ideas
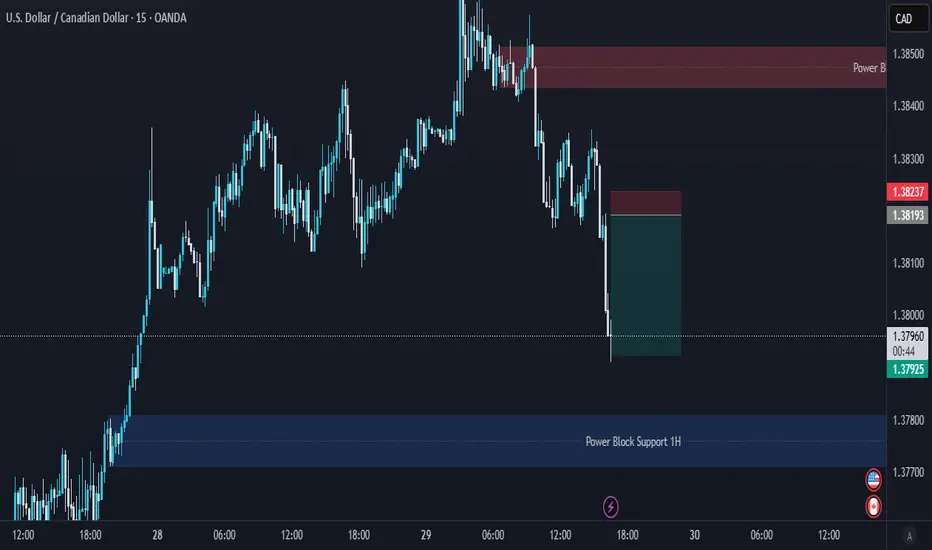
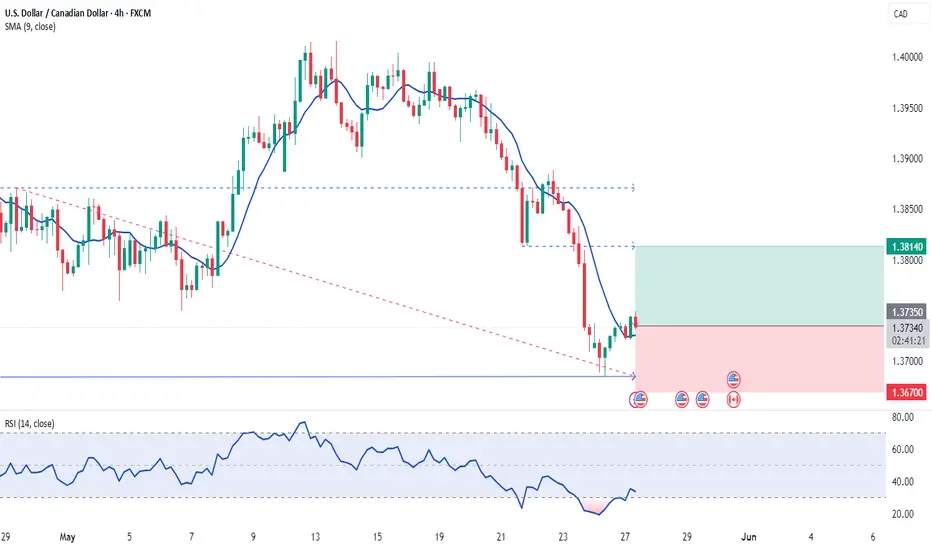
USDCAD: Bearish After the News 🇺🇸🇨🇦
USDCAD looks bearish after a release of today's fundamental news.
A bearish breakout of a rising channel on a 4h time frame
and a strong selling reaction after its retest provide
a reliable bearish continuation.
I think that the price may drop to 1.3743 support.
❤️Please, support my work with like, thank you!❤️
I am part of Trade Nation's Influencer program and receive a monthly fee for using their TradingView charts in my analysis.

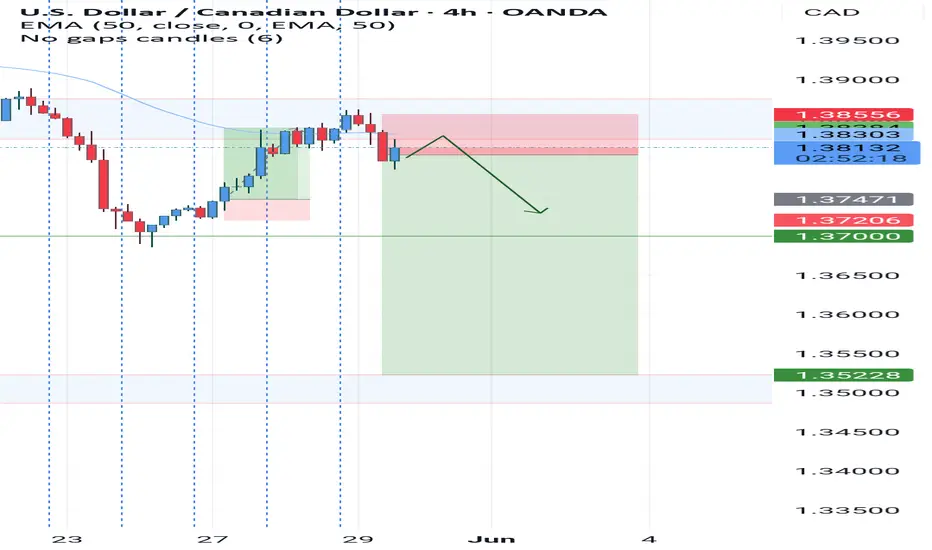
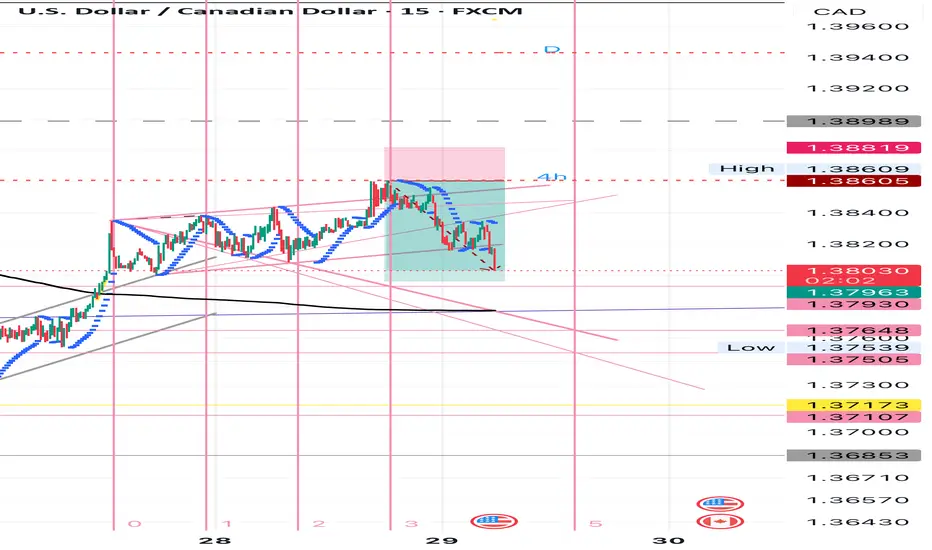
USDCAD Sell- Go for sell only when entry setup given
- Refine entry with smaller SL for better RR, if you know how
- keep looking for sell even if price goes one more up
- later CAD news could trigger the move
A Message To Traders:
I’ll be sharing high-quality trade setups for a period time. No bullshit, no fluff, no complicated nonsense — just real, actionable forecast the algorithm is executing. If you’re struggling with trading and desperate for better results, follow my posts closely.
Check out my previously posted setups and forecasts — you’ll be amazed by the high accuracy of the results.
"I Found the Code. I Trust the Algo. Believe Me, That’s It."
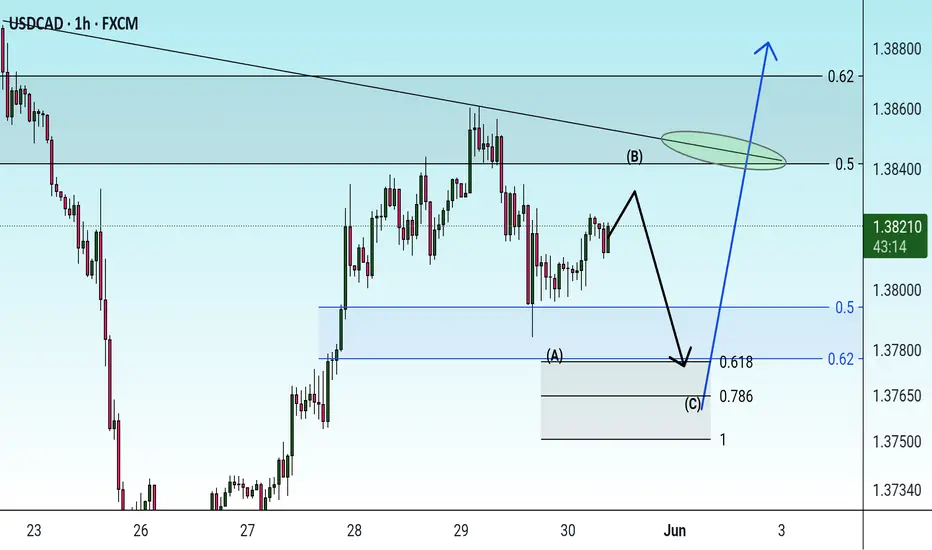
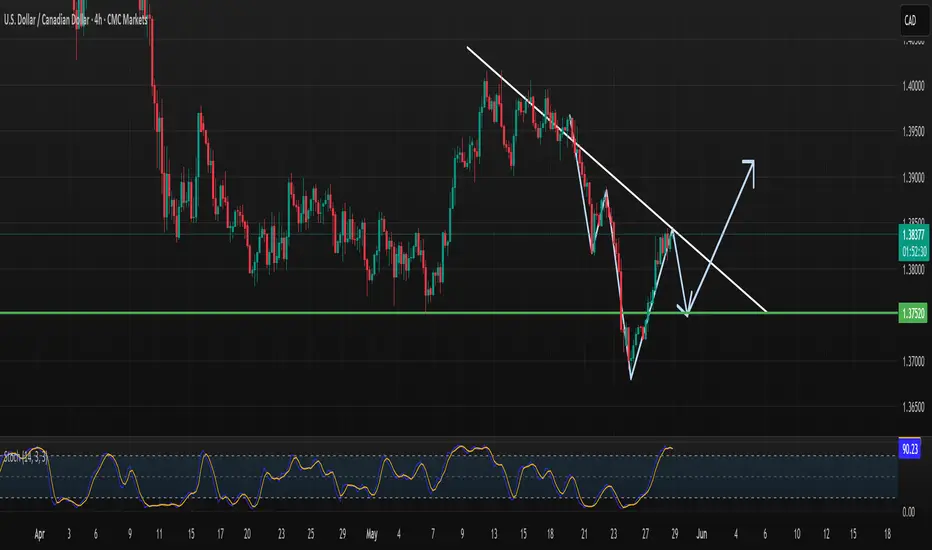
Correction The corrective pattern is expected to complete at the indicated support levels and we will witness the start of an uptrend.
A break of the resistance trend line will be confirmation of the uptrend.
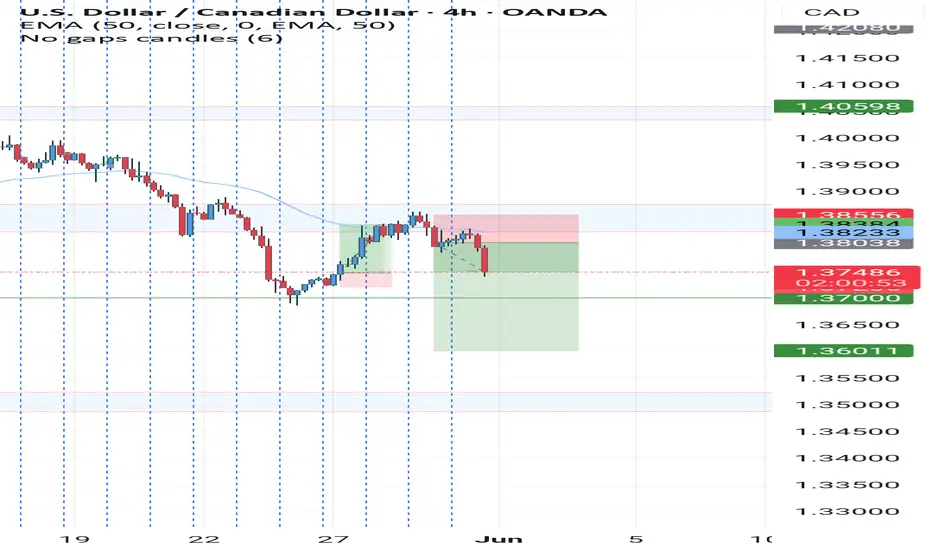
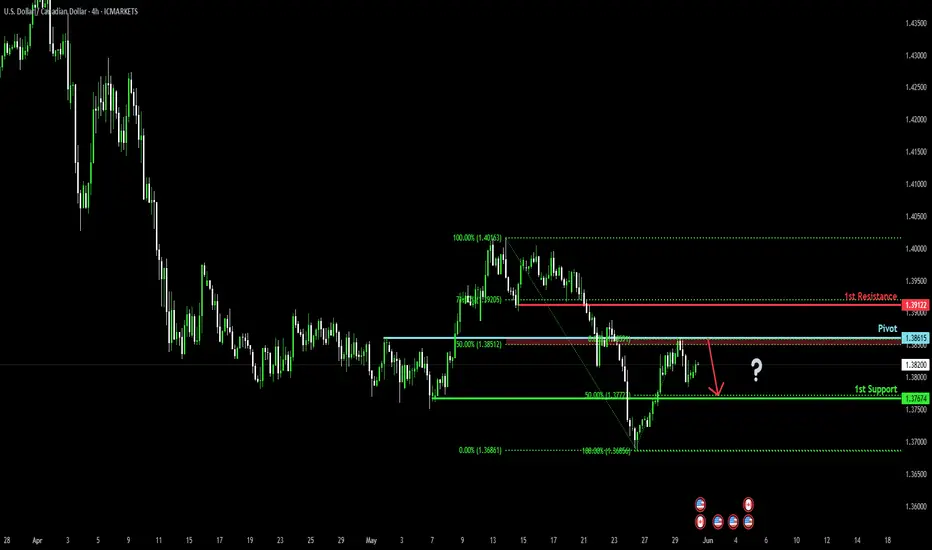
Bearish drop off overlap resistance?The Loonie (USD/CAD) is rising towards the pivot, which has been identified as an overlap resistance and could drop to the 50% Fibonacci support.
Pivot: 1.3861
1st Support: 1.3767
1st Resistance: 1.3912
Risk Warning:
Trading Forex and CFDs carries a high level of risk to your capital and you should only trade with money you can afford to lose. Trading Forex and CFDs may not be suitable for all investors, so please ensure that you fully understand the risks involved and seek independent advice if necessary.
Disclaimer:
The above opinions given constitute general market commentary, and do not constitute the opinion or advice of IC Markets or any form of personal or investment advice.
Any opinions, news, research, analyses, prices, other information, or links to third-party sites contained on this website are provided on an "as-is" basis, are intended only to be informative, is not an advice nor a recommendation, nor research, or a record of our trading prices, or an offer of, or solicitation for a transaction in any financial instrument and thus should not be treated as such. The information provided does not involve any specific investment objectives, financial situation and needs of any specific person who may receive it. Please be aware, that past performance is not a reliable indicator of future performance and/or results. Past Performance or Forward-looking scenarios based upon the reasonable beliefs of the third-party provider are not a guarantee of future performance. Actual results may differ materially from those anticipated in forward-looking or past performance statements. IC Markets makes no representation or warranty and assumes no liability as to the accuracy or completeness of the information provided, nor any loss arising from any investment based on a recommendation, forecast or any information supplied by any third-party.
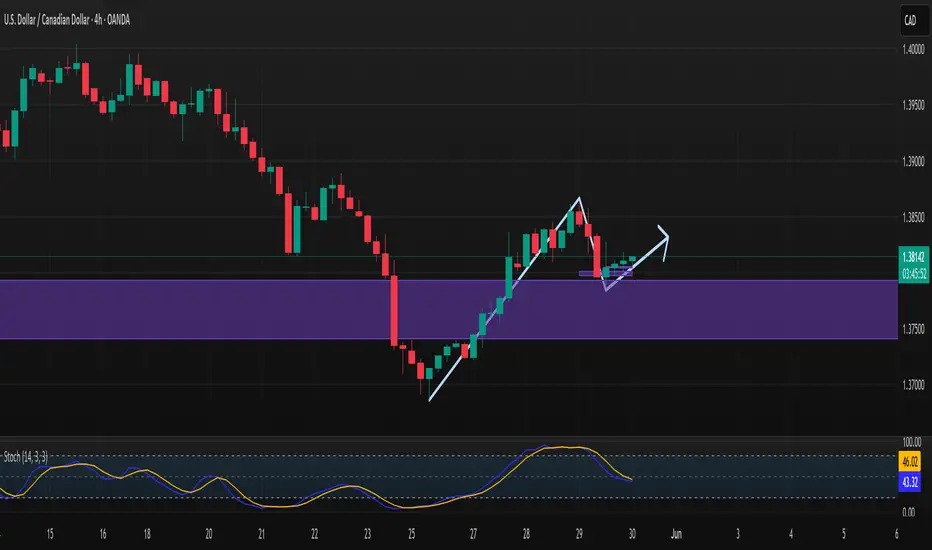
USDCAD - Following the market looks like we could be going longFollowing the market looks like we could be going long for a bit.
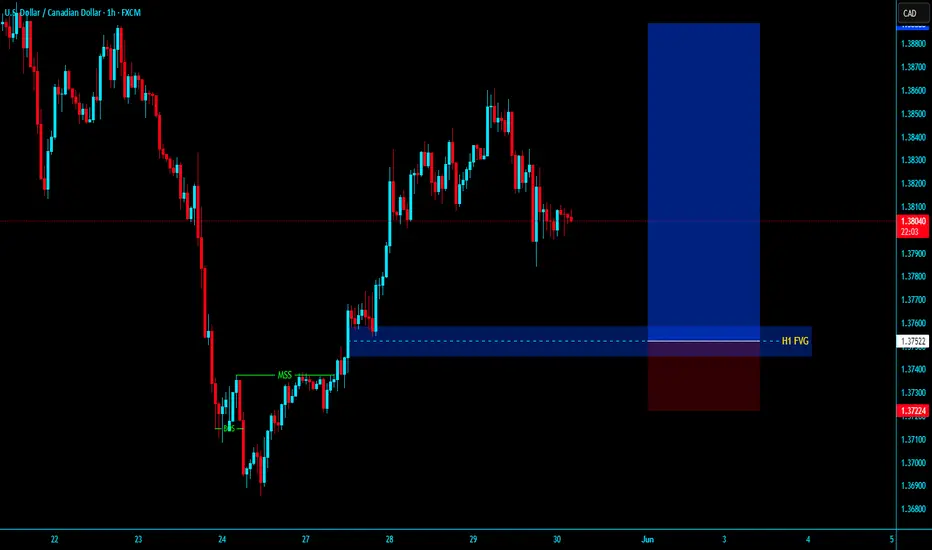
# USDCAD H1 MTD FVG FOR LONG# USDCAD H1 MTD FVG FOR LONG
after LTF Conformation with valid mss then entry
1st Target - 1.40155
2nd Target - 1.41250
-------------------------------------------------------------------------------------------
KGB Priyabrat Behera
ICT & Advaance Mapping SMC Trader
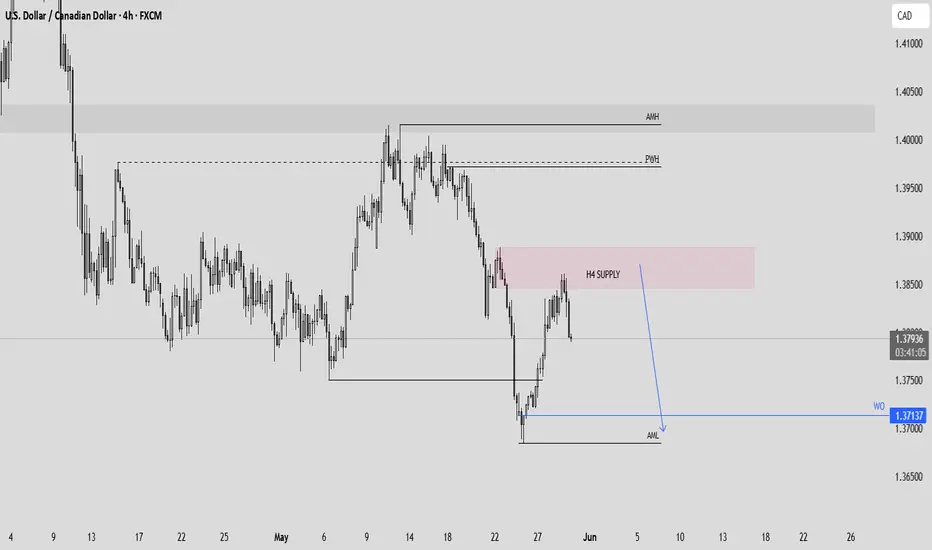
bear is the word of the dayOANDA:USDCAD the USD trend is still strong bears are still in the lead,
confluences daily downtrend(1) break of market structure to the downside(2) break and retest of resistance(3)
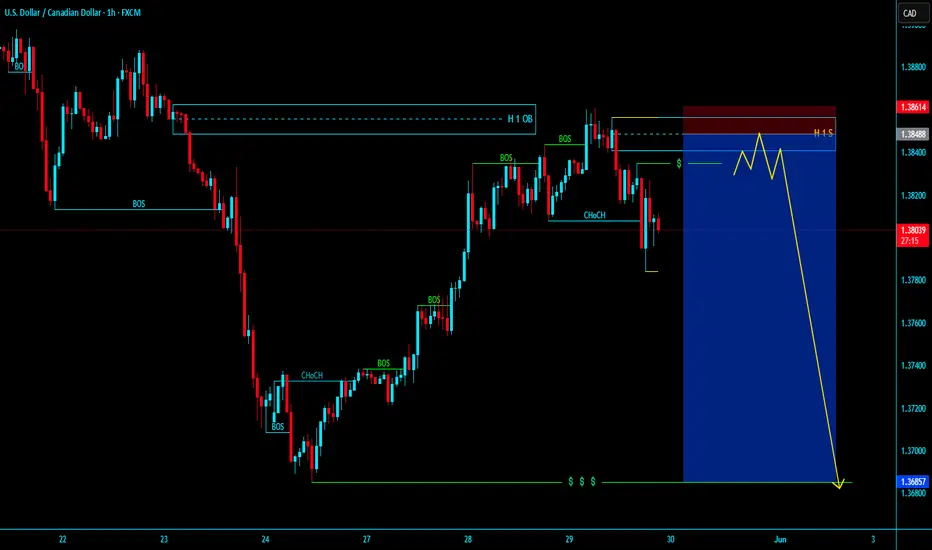
# USDCAD H1 SUPPLY , VALID MSS WITH LIQUIDITY# USDCAD H1 SUPPLY , Valid mss after LTF Conformation then entry
... KGB PRIYABRAT BEHERA
ICT & ADVANCE MAPPING SMC TRADER
Usdcad I hv been waiting for the big move in usdcad and it is about to happen u hv seen price got to de resistance zone and we are about to sell
USDCAD - Short term bearish long term bullishI was analyzing USDCAD and I noticed two type of patterns. One pattern is a strong bearish pattern to a strong bullish pattern. Hope it helps.
USDCAD: BEARISH CONTINUATION SETUPTechnically we were expecting for this area to work out. TVC:DXY dollar hasn't changed so much, my biais on dollar remains bearish. If that happens by positive correlation DXY WEAKNEESS means CMCMARKETS:USDCAD BEARISH
USDCAD Bearish Signal | Technical + Custom AlgoSmart Trend Signal | Technical Analysis + Custom Algorithm
This signal is the result of a combination of classic technical trend analysis and a proprietary software I personally developed.
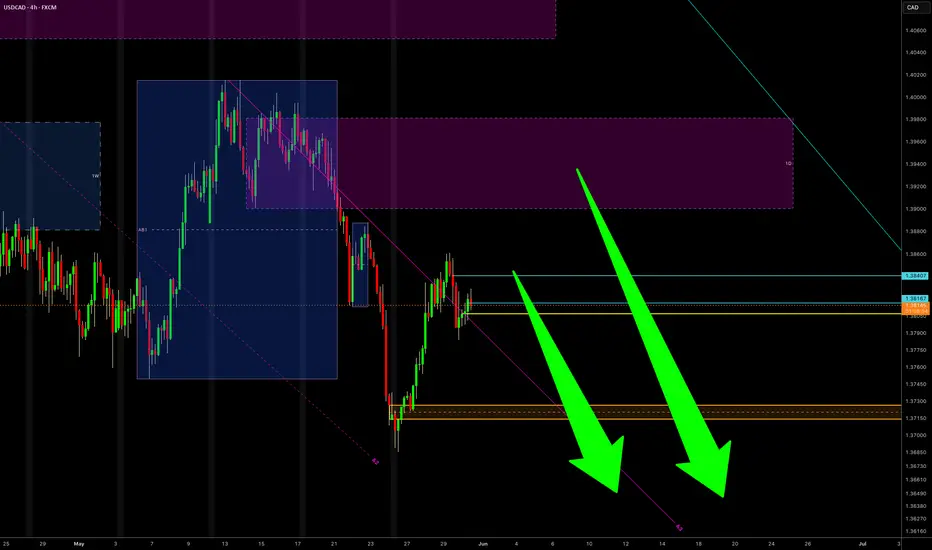
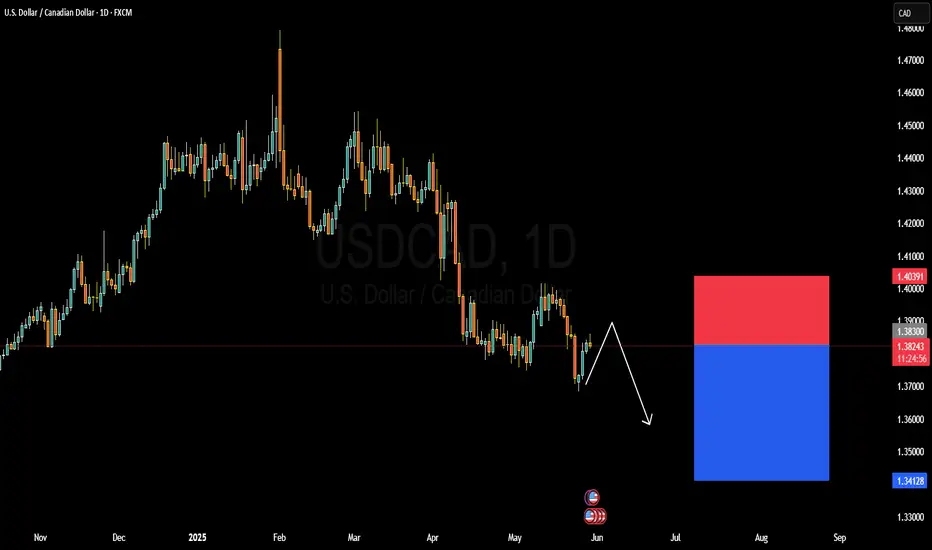
USDCAD BULLISH OR BEARISH DETAILED ANALYSIS ??USDCAD continues to follow the predicted bearish path, currently trading around 1.38300, and still moving gradually toward our target zone of 1.34300. After a strong bearish impulse from the 1.40391 supply zone, price has consistently formed lower highs, confirming selling pressure and market intent. The recent bounce was shallow, and price is respecting previous resistance levels perfectly, validating the bearish continuation setup.
Fundamentally, the Canadian dollar is gaining strength off rising oil prices and improving economic data from Canada, while the US dollar remains under pressure as the market begins pricing in a potential Fed rate cut in the second half of 2025. With softer US economic indicators including lower consumer confidence and slowing GDP growth, the momentum clearly favors CAD in this pair. The divergence in monetary policy outlooks between the Bank of Canada and the Federal Reserve adds further downside bias to USDCAD.
Technically, the structure remains bearish, with a clean breakdown below the 1.3900 psychological level and clear rejection at the 1.40300 resistance zone. Market liquidity appears to be shifting below the current price, and with the pair printing consistent lower highs and lower lows, there's significant space toward our target zone near 1.34128. A rejection from the minor pullback zone between 1.38800–1.39000 could provide another entry opportunity for trend continuation traders.
USDCAD remains a high-probability short setup in line with both technical structure and current fundamentals. As long as price stays below the 1.40300 resistance, I expect the bearish trend to continue with increased momentum as we approach summer liquidity shifts. This trade is already deep in profit and aligns with key institutional selling zones, making 1.34300 a realistic and conservative target in the coming weeks.
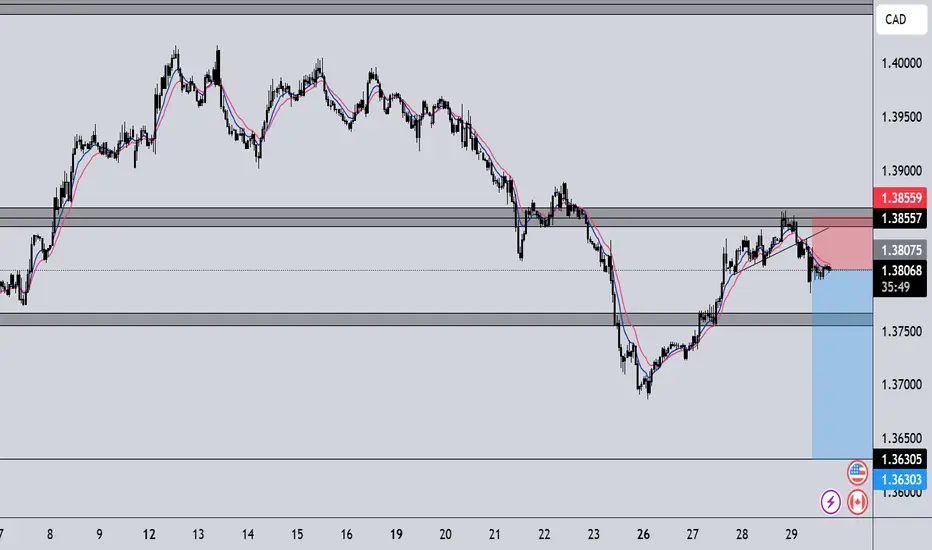
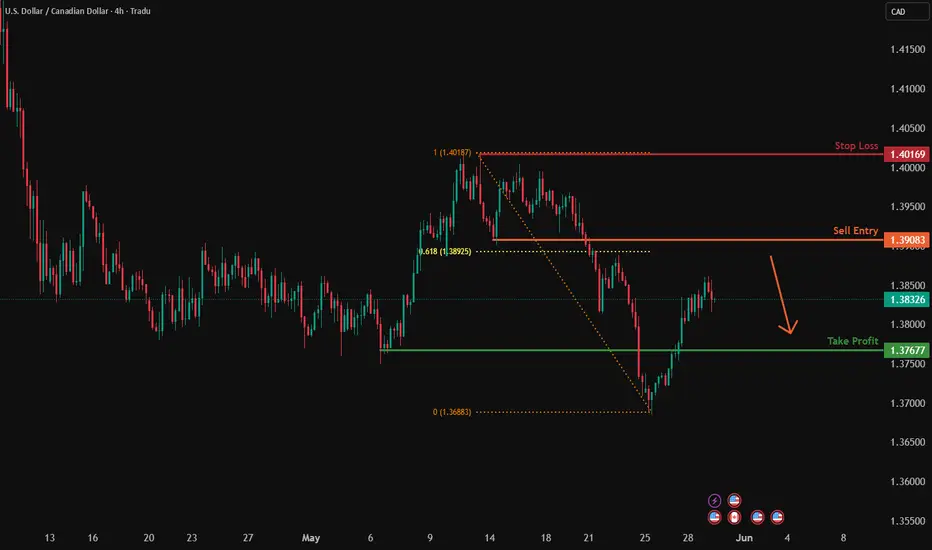
USDCAD H4 I Bearish Reversal Based on the H4 chart, the price is rising toward sell entry level at 1.3908, a pullback resistance that aligns close to the 61.8% Fibo retracement.
Our take profit is set at 1.3767, a pullback support.
The stop loss is set at 1.4016, a swing high resistance.
High Risk Investment Warning
Trading Forex/CFDs on margin carries a high level of risk and may not be suitable for all investors. Leverage can work against you.
Stratos Markets Limited (tradu.com ):
CFDs are complex instruments and come with a high risk of losing money rapidly due to leverage. 63% of retail investor accounts lose money when trading CFDs with this provider. You should consider whether you understand how CFDs work and whether you can afford to take the high risk of losing your money.
Stratos Europe Ltd (tradu.com ):
CFDs are complex instruments and come with a high risk of losing money rapidly due to leverage. 63% of retail investor accounts lose money when trading CFDs with this provider. You should consider whether you understand how CFDs work and whether you can afford to take the high risk of losing your money.
Stratos Global LLC (tradu.com ):
Losses can exceed deposits.
Please be advised that the information presented on TradingView is provided to Tradu (‘Company’, ‘we’) by a third-party provider (‘TFA Global Pte Ltd’). Please be reminded that you are solely responsible for the trading decisions on your account. There is a very high degree of risk involved in trading. Any information and/or content is intended entirely for research, educational and informational purposes only and does not constitute investment or consultation advice or investment strategy. The information is not tailored to the investment needs of any specific person and therefore does not involve a consideration of any of the investment objectives, financial situation or needs of any viewer that may receive it. Kindly also note that past performance is not a reliable indicator of future results. Actual results may differ materially from those anticipated in forward-looking or past performance statements. We assume no liability as to the accuracy or completeness of any of the information and/or content provided herein and the Company cannot be held responsible for any omission, mistake nor for any loss or damage including without limitation to any loss of profit which may arise from reliance on any information supplied by TFA Global Pte Ltd.
The speaker(s) is neither an employee, agent nor representative of Tradu and is therefore acting independently. The opinions given are their own, constitute general market commentary, and do not constitute the opinion or advice of Tradu or any form of personal or investment advice. Tradu neither endorses nor guarantees offerings of third-party speakers, nor is Tradu responsible for the content, veracity or opinions of third-party speakers, presenters or participants.
USDCADpotential for a short
- Bearish downtrend in the higher time frames
- double tops
- break of structures
- CHOCH - LL LH
USDCAD I Daily CLS nested in W/M CLS Hey, Market Warriors, here is another outlook on this instrument
If you’ve been following me, you already know every setup you see is built around a CLS range, a Key Level, Liquidity and a specific execution model.
If you haven't followed me yet, start now.
My trading system is completely mechanical — designed to remove emotions, opinions, and impulsive decisions. No messy diagonal lines. No random drawings. Just clarity, structure, and execution.
🧩 What is CLS?
CLS is real smart money — the combined power of major investment banks and central banks moving over 6.5 trillion dollars a day. Understanding their operations is key to markets.
✅ Understanding the behaviour of CLS allows you to position yourself with the giants during the market manipulations — leading to buying lows and selling highs - cleaner entries, clearer exits, and consistent profits.
🛡️ Models 1 and 2:
From my posts, you can learn two core execution models.
They are the backbone of how I trade and how my students are trained.
📍 Model 1
is right after the manipulation of the CLS candle when CIOD occurs, and we are targeting 50% of the CLS range. H4 CLS ranges supported by HTF go straight to the opposing range.
📍 Model 2
occurs in the specific market sequence when CLS smart money needs to re-accumulate more positions, and we are looking to find a key level around 61.8 fib retracement and target the opposing side of the range.
👍 Hit like if you find this analysis helpful, and don't hesitate to comment with your opinions, charts or any questions.
⚔️ Listen Carefully:
Analysis is not trading. Right now, this platform is full of gurus" trying to sell you dreams based on analysis with arrows while they don't even have the skill to trade themselves.
If you’re ever thinking about buying a Trading Course or Signals from anyone. Always demand a verified track record. It takes less than five minutes to connect 3rd third-party verification tool and link to the widget to his signature.
"Adapt what is useful, reject what is useless, and add what is specifically your own."
— David Perk aka Dave FX Hunter ⚔️

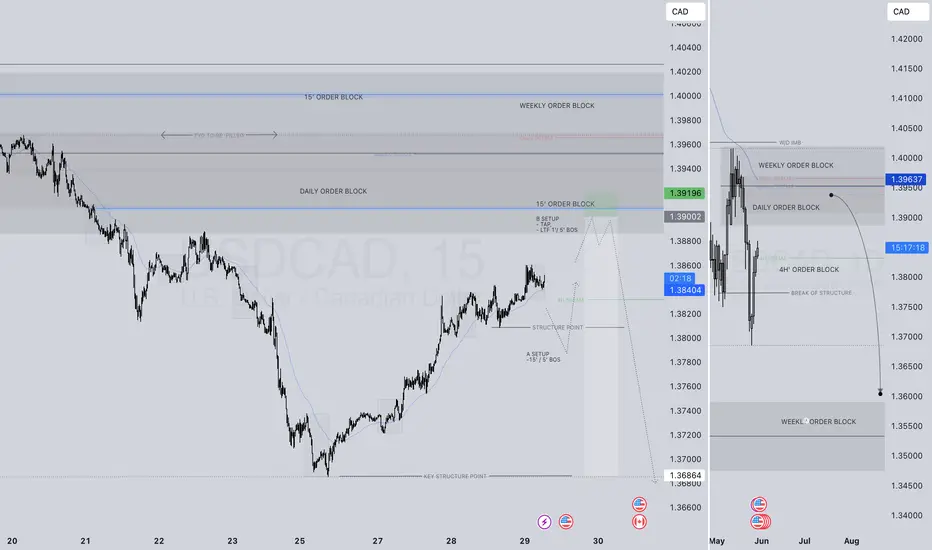
AWAIT BOS FIRST!! USDCAD SHORT FORECAST Q2 W22 D29 Y25
🔥👀USDCAD SHORT FORECAST Q2 W22 D29 Y25
Professional Risk Managers👋
Welcome back to another FRGNT chart update📈
Diving into some Forex setups using predominantly higher time frame order blocks alongside confirmation breaks of structure.
💡Here are some trade confluences📝
✅Daily Order block
✅HTF 50 EMA
✅Intraday bearish breaks of structure to be identified
✅15’ order block identified
🔑 Remember, to participate in trading comes always with a degree of risk, therefore as professional risk managers it remains vital that we stick to our risk management plan as well as our trading strategies.
📈The rest, we leave to the balance of probabilities.
💡Fail to plan. Plan to fail.
🏆It has always been that simple.
❤️Good luck with your trading journey, I shall see you at the very top.
🎯Trade consistent, FRGNT X
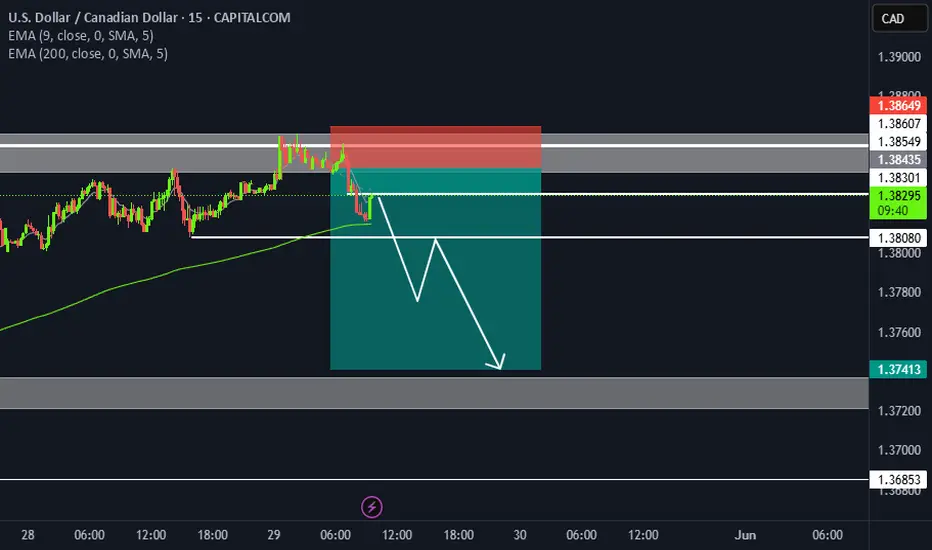
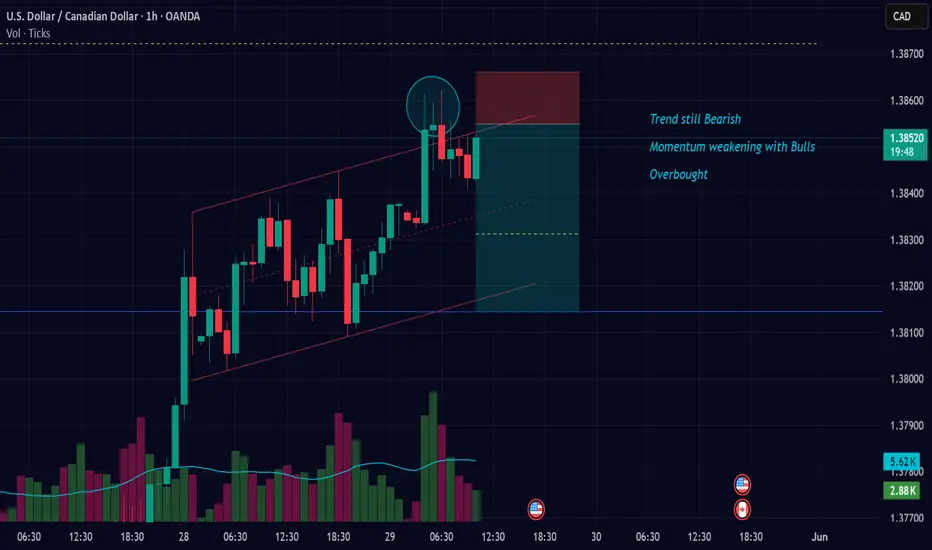
Bulls losing some momentum on USDCADCan plan a short trade
Look for 15min confirmations
Trade at your own risks & phase
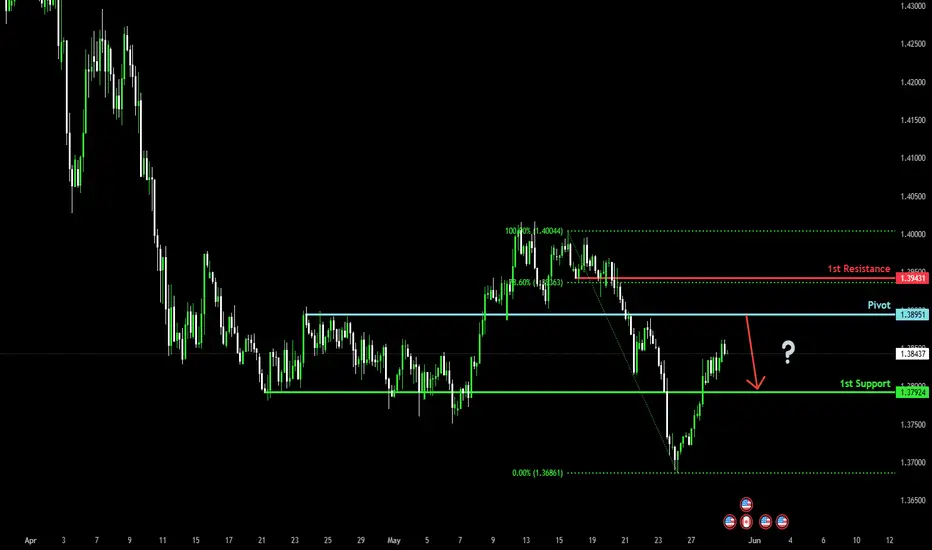
Bearish reversal?The Loonie (USD/CAD) is rising towards the pivot and could reverse to the 1st support.
Pivot: 1.3895
1st Support: 1.3792
1st Resistance: 1.3943
Risk Warning:
Trading Forex and CFDs carries a high level of risk to your capital and you should only trade with money you can afford to lose. Trading Forex and CFDs may not be suitable for all investors, so please ensure that you fully understand the risks involved and seek independent advice if necessary.
Disclaimer:
The above opinions given constitute general market commentary, and do not constitute the opinion or advice of IC Markets or any form of personal or investment advice.
Any opinions, news, research, analyses, prices, other information, or links to third-party sites contained on this website are provided on an "as-is" basis, are intended only to be informative, is not an advice nor a recommendation, nor research, or a record of our trading prices, or an offer of, or solicitation for a transaction in any financial instrument and thus should not be treated as such. The information provided does not involve any specific investment objectives, financial situation and needs of any specific person who may receive it. Please be aware, that past performance is not a reliable indicator of future performance and/or results. Past Performance or Forward-looking scenarios based upon the reasonable beliefs of the third-party provider are not a guarantee of future performance. Actual results may differ materially from those anticipated in forward-looking or past performance statements. IC Markets makes no representation or warranty and assumes no liability as to the accuracy or completeness of the information provided, nor any loss arising from any investment based on a recommendation, forecast or any information supplied by any third-party.
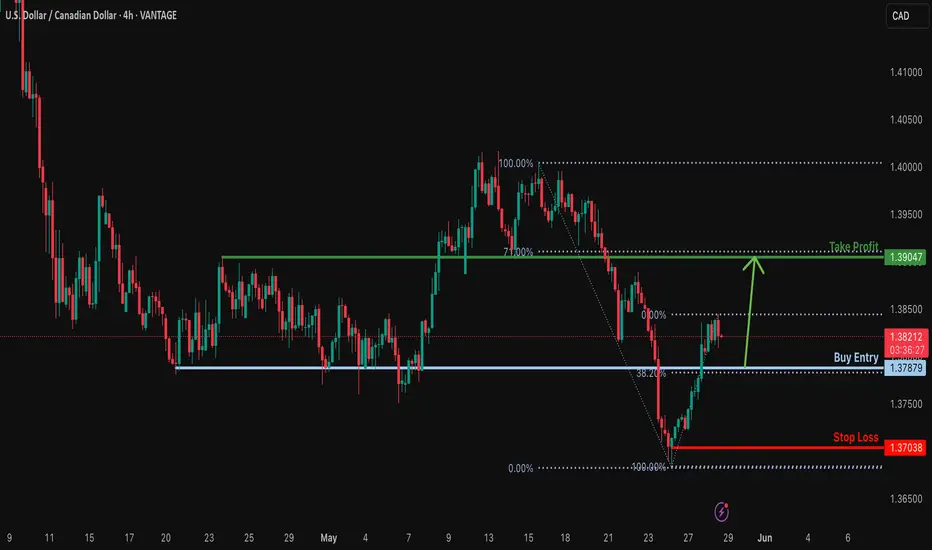
Bullish bounce off pullback support?USD/CAD is falling towards the support level which is a pullback support that lines up with the 38.2% Fibonacci retracement and could bounce from this level to our take profit.
Entry: 1.3787
Why we like it:
There is a pullback support level that aligns with the 38.2% Fibonacci retracement.
Stop loss: 1.3703
Why we like it:
There is a pullback support level.
Take profit: 1.3904
Why we lik eit:
There is an overlap resistance level that lines up with the 71% Fibonacci retracement.
Enjoying your TradingView experience? Review us!
Please be advised that the information presented on TradingView is provided to Vantage (‘Vantage Global Limited’, ‘we’) by a third-party provider (‘Everest Fortune Group’). Please be reminded that you are solely responsible for the trading decisions on your account. There is a very high degree of risk involved in trading. Any information and/or content is intended entirely for research, educational and informational purposes only and does not constitute investment or consultation advice or investment strategy. The information is not tailored to the investment needs of any specific person and therefore does not involve a consideration of any of the investment objectives, financial situation or needs of any viewer that may receive it. Kindly also note that past performance is not a reliable indicator of future results. Actual results may differ materially from those anticipated in forward-looking or past performance statements. We assume no liability as to the accuracy or completeness of any of the information and/or content provided herein and the Company cannot be held responsible for any omission, mistake nor for any loss or damage including without limitation to any loss of profit which may arise from reliance on any information supplied by Everest Fortune Group.