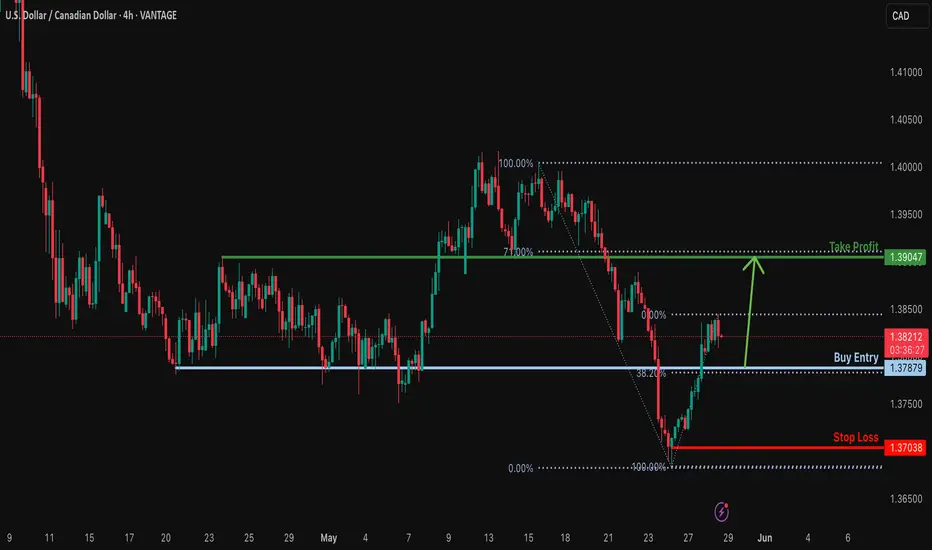
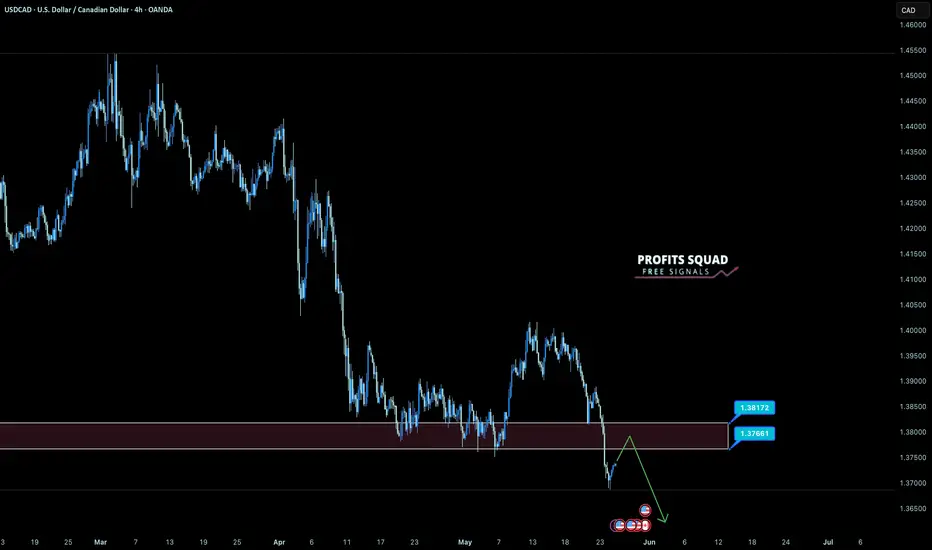
Bullish bounce off pullback support?USD/CAD is falling towards the support level which is a pullback support that lines up with the 38.2% Fibonacci retracement and could bounce from this level to our take profit.
Entry: 1.3787
Why we like it:
There is a pullback support level that aligns with the 38.2% Fibonacci retracement.
Stop loss: 1.3703
Why we like it:
There is a pullback support level.
Take profit: 1.3904
Why we lik eit:
There is an overlap resistance level that lines up with the 71% Fibonacci retracement.
Enjoying your TradingView experience? Review us!
Please be advised that the information presented on TradingView is provided to Vantage (‘Vantage Global Limited’, ‘we’) by a third-party provider (‘Everest Fortune Group’). Please be reminded that you are solely responsible for the trading decisions on your account. There is a very high degree of risk involved in trading. Any information and/or content is intended entirely for research, educational and informational purposes only and does not constitute investment or consultation advice or investment strategy. The information is not tailored to the investment needs of any specific person and therefore does not involve a consideration of any of the investment objectives, financial situation or needs of any viewer that may receive it. Kindly also note that past performance is not a reliable indicator of future results. Actual results may differ materially from those anticipated in forward-looking or past performance statements. We assume no liability as to the accuracy or completeness of any of the information and/or content provided herein and the Company cannot be held responsible for any omission, mistake nor for any loss or damage including without limitation to any loss of profit which may arise from reliance on any information supplied by Everest Fortune Group.
CADUSD trade ideas
USDCAD downtrend continuation capped at 1.4060The USDCAD pair is exhibiting a bearish sentiment, reinforced by the ongoing downtrend. The key trading level to watch is at 1.4060, which represents the current intraday swing low and the falling resistance trendline level.
In the short term, an oversold rally from current levels, followed by a bearish rejection at the 1.4060 resistance, could lead to a downside move targeting support at 1.3780, with further potential declines to 1.3730 and 1.3630 over a longer timeframe.
On the other hand, a confirmed breakout above the 1.4060 resistance level and a daily close above that mark would invalidate the bearish outlook. This scenario could pave the way for a continuation of the rally, aiming to retest the 1.4080 resistance, with a potential extension to 1.4160 levels.
Conclusion:
Currently, the USDCAD sentiment remains bearish, with the 1.4060 level acting as a pivotal resistance. Traders should watch for either a bearish rejection at this level or a breakout and daily close above it to determine the next directional move. Caution is advised until the price action confirms a clear break or rejection.
This communication is for informational purposes only and should not be viewed as any form of recommendation as to a particular course of action or as investment advice. It is not intended as an offer or solicitation for the purchase or sale of any financial instrument or as an official confirmation of any transaction. Opinions, estimates and assumptions expressed herein are made as of the date of this communication and are subject to change without notice. This communication has been prepared based upon information, including market prices, data and other information, believed to be reliable; however, Trade Nation does not warrant its completeness or accuracy. All market prices and market data contained in or attached to this communication are indicative and subject to change without notice.
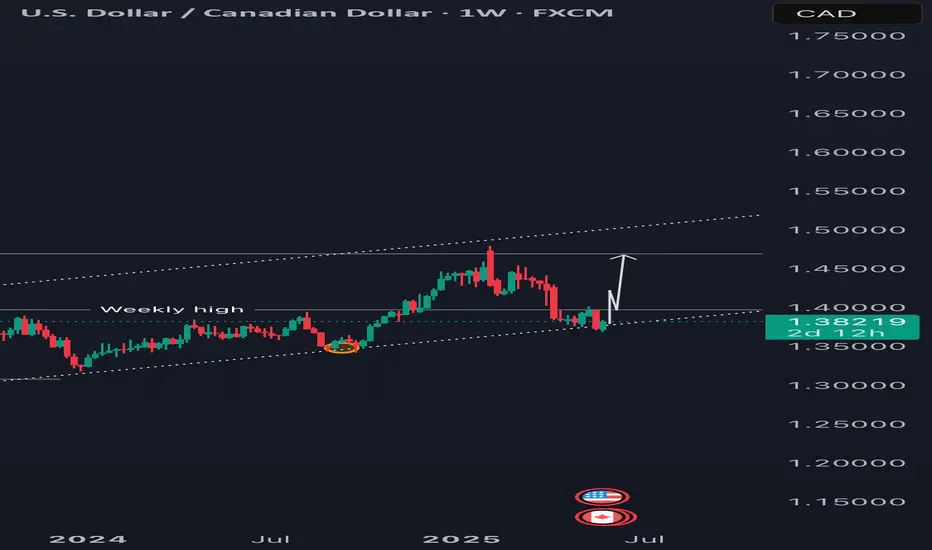
USDCAD -- Wait to see which way...Hello,
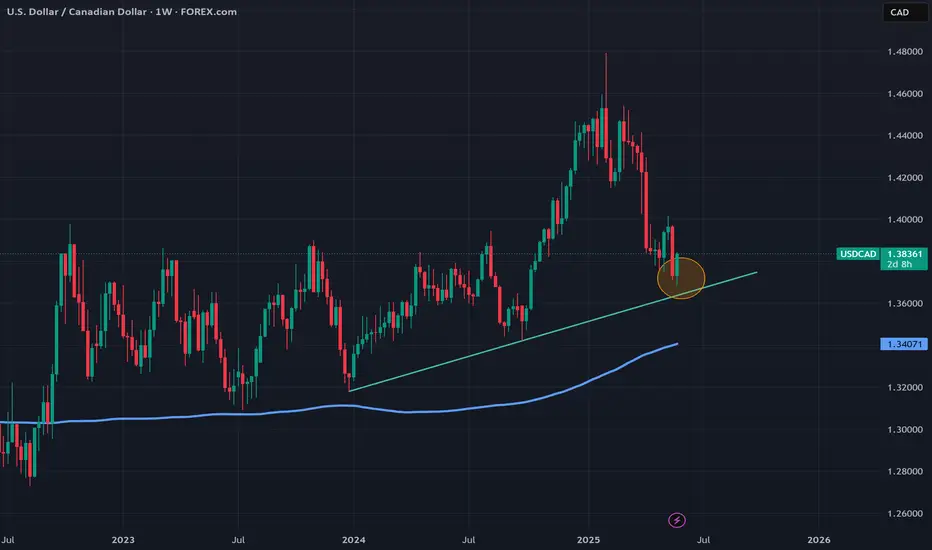
The weekly for the USDCAD is showing a potential bounce from around 1.37805. However, price is below 200 MA for D, 4HR & 1HR; Weekly and Monthly are still strong bullish for 200 MA.
I would like to see a hammer followed by a bullish engulfing candle as in past weeks - that would put me in a buy position targeting ~1.43566.
Price currently is trying to bust out of resistance set from Oct of 2022.
For the short game, price is almost touching the Hourly 200 MA.
As always, we'll wait and see and go with the flow!
usdcad will risehi after long time
im here for sharing my chart
usdcad based on fibo
and important levels based on supply and demand
looking for buy side
lets see what will happen
share your ideas with me
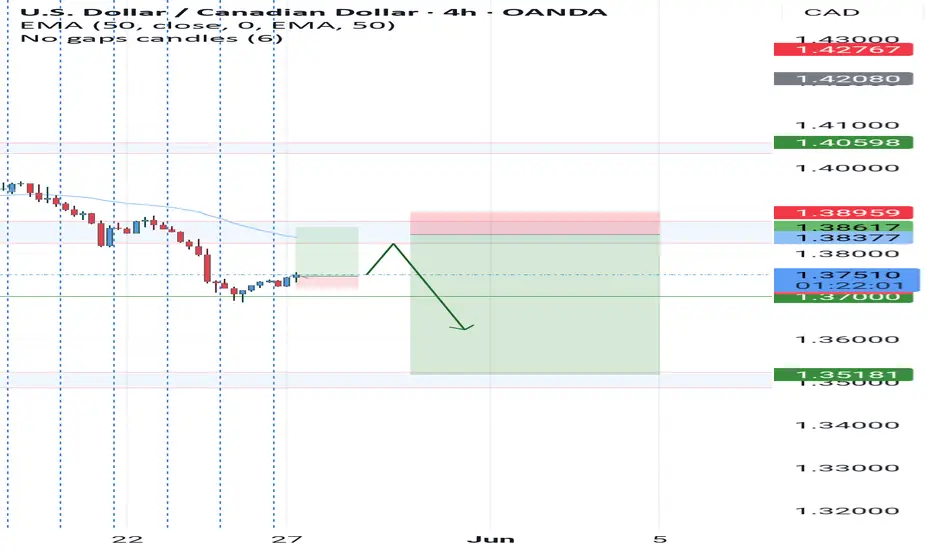
USDCADPotential short opportunity
- current trend is bearish.
- underneath the rolling EMAs (200,8)
- retesting off strong 1hr/4hr supply zone
- strong bearish candles
- will USD fall even more? TP is at major demand zone
USDCAD Bullish Setup – Watching Key Breakout LevelUSDCAD has tested the lower trend line and is showing signs of a potential reversal. The overall trend remains bullish, but additional confirmation is needed before entering. I’ll be looking to go long above 1.39734, which would signal a strong breakout continuation.
🔹 Trend: Bullish
🔹 Entry Idea: Long above 1.39734
🔹 Confirmation Needed: Break and retest or strong bullish momentum
🔹 Support Zone: Around the trend line
🔹 Resistance: Monitor previous highs once breakout occurs
Let me know your thoughts or drop your chart in the comments below!
possibility of correctionIt is expected that a trend change will form in the current resistance area and we will see the beginning of the downward trend. If the price breaks through the resistance area, the upward trend will likely continue.
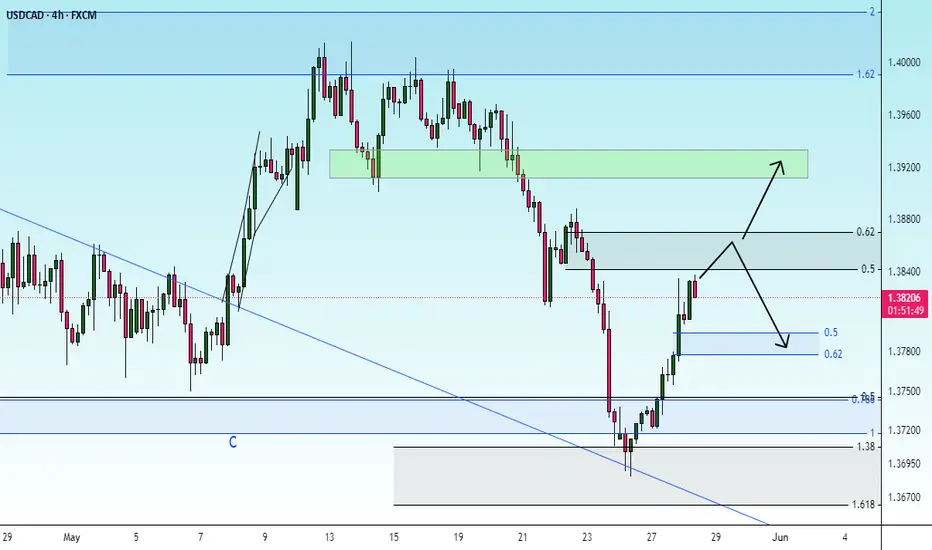
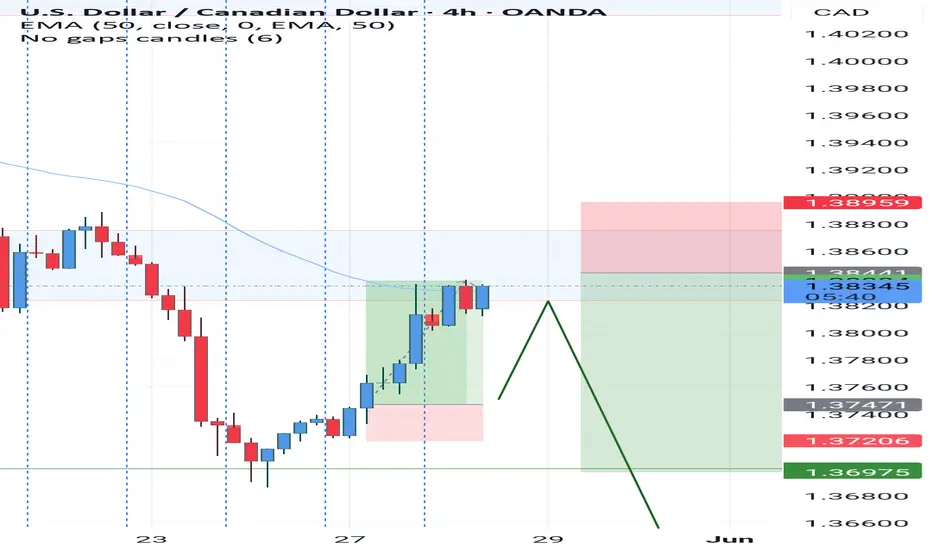
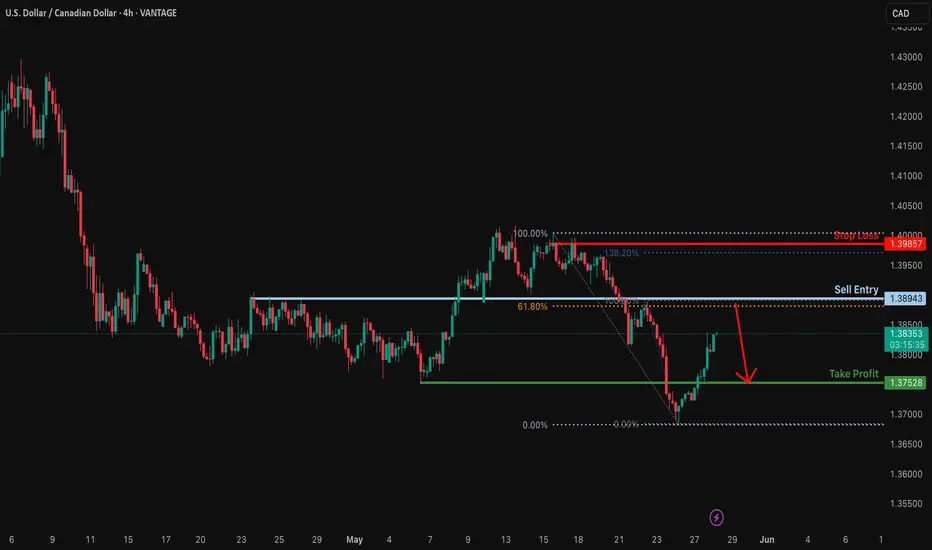
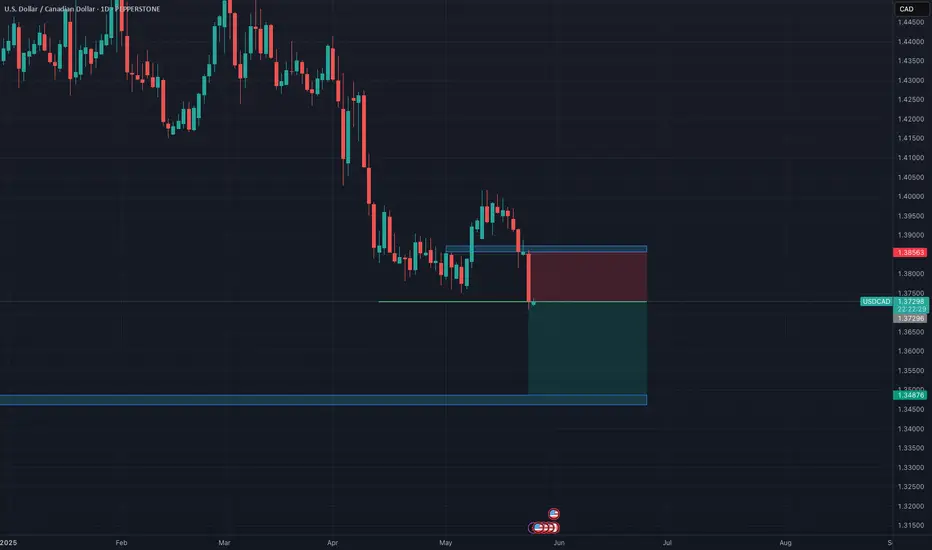
Heading into 61.8% Fibonacci resistance?USD/CAD is rising towards the resistance level which is an overlap resistance that aligns with the 61.8% Fibonacci retracement and could reverse from this level to our take profit.
Entry: 1.3894
Why we like it:
There is an overlap resistance level that lines up with the 61.8% Fibonacci retracement.
Stop loss: 1.3985
Why we like it:
There is a pullback resistance level that lines up with the 138.2% Fibonacci extension.
Take profit: 1.3752
Why we like it:
There is a pullback support level.
Enjoying your TradingView experience? Review us!
Please be advised that the information presented on TradingView is provided to Vantage (‘Vantage Global Limited’, ‘we’) by a third-party provider (‘Everest Fortune Group’). Please be reminded that you are solely responsible for the trading decisions on your account. There is a very high degree of risk involved in trading. Any information and/or content is intended entirely for research, educational and informational purposes only and does not constitute investment or consultation advice or investment strategy. The information is not tailored to the investment needs of any specific person and therefore does not involve a consideration of any of the investment objectives, financial situation or needs of any viewer that may receive it. Kindly also note that past performance is not a reliable indicator of future results. Actual results may differ materially from those anticipated in forward-looking or past performance statements. We assume no liability as to the accuracy or completeness of any of the information and/or content provided herein and the Company cannot be held responsible for any omission, mistake nor for any loss or damage including without limitation to any loss of profit which may arise from reliance on any information supplied by Everest Fortune Group.
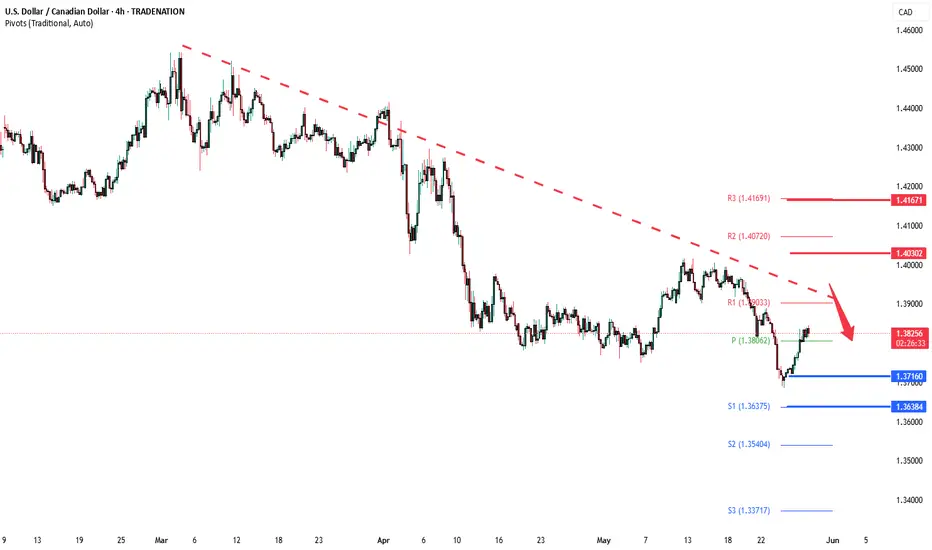
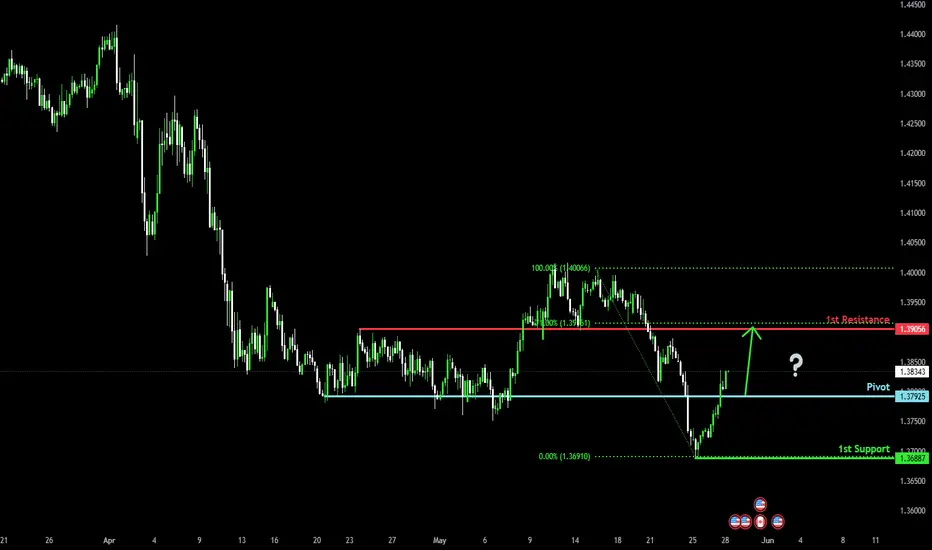
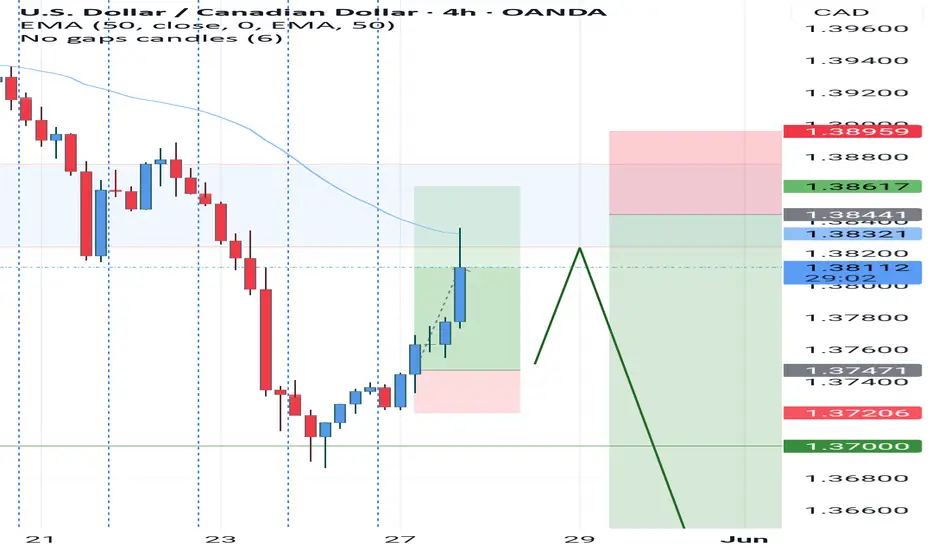
Potential bullish rise?The Loonie (USD/CAD) has reacted off the pivot and could rise to the 1st resistance that aligns with the 71% Fibonacci retracement.
Pivot: 1.3792
1st Support: 1.3688
1st Resistance: 1.3905
Risk Warning:
Trading Forex and CFDs carries a high level of risk to your capital and you should only trade with money you can afford to lose. Trading Forex and CFDs may not be suitable for all investors, so please ensure that you fully understand the risks involved and seek independent advice if necessary.
Disclaimer:
The above opinions given constitute general market commentary, and do not constitute the opinion or advice of IC Markets or any form of personal or investment advice.
Any opinions, news, research, analyses, prices, other information, or links to third-party sites contained on this website are provided on an "as-is" basis, are intended only to be informative, is not an advice nor a recommendation, nor research, or a record of our trading prices, or an offer of, or solicitation for a transaction in any financial instrument and thus should not be treated as such. The information provided does not involve any specific investment objectives, financial situation and needs of any specific person who may receive it. Please be aware, that past performance is not a reliable indicator of future performance and/or results. Past Performance or Forward-looking scenarios based upon the reasonable beliefs of the third-party provider are not a guarantee of future performance. Actual results may differ materially from those anticipated in forward-looking or past performance statements. IC Markets makes no representation or warranty and assumes no liability as to the accuracy or completeness of the information provided, nor any loss arising from any investment based on a recommendation, forecast or any information supplied by any third-party.
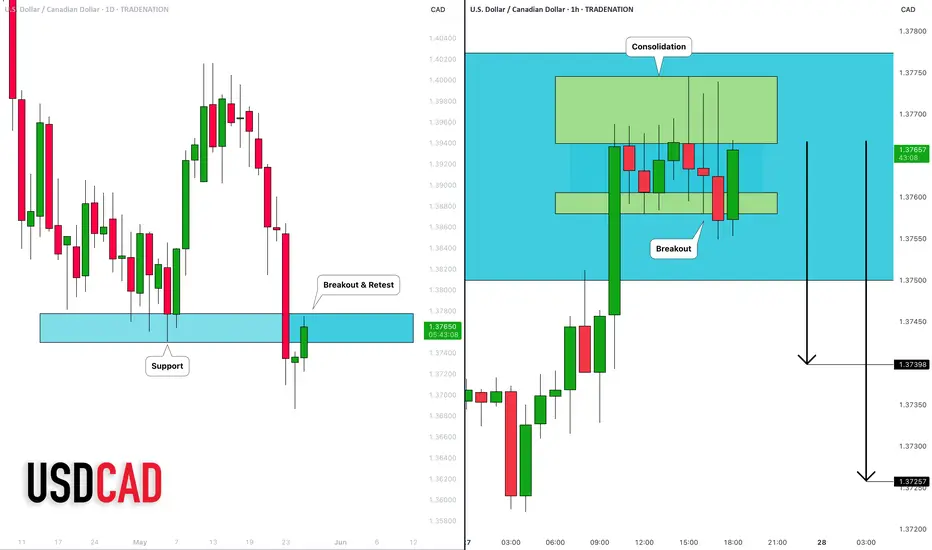
USDCAD: Expect further downside following a potential retest USDCAD: Expect further downside following a potential retest of the previous support level, which is now acting as resistance. The current downtrend appears to have additional momentum.
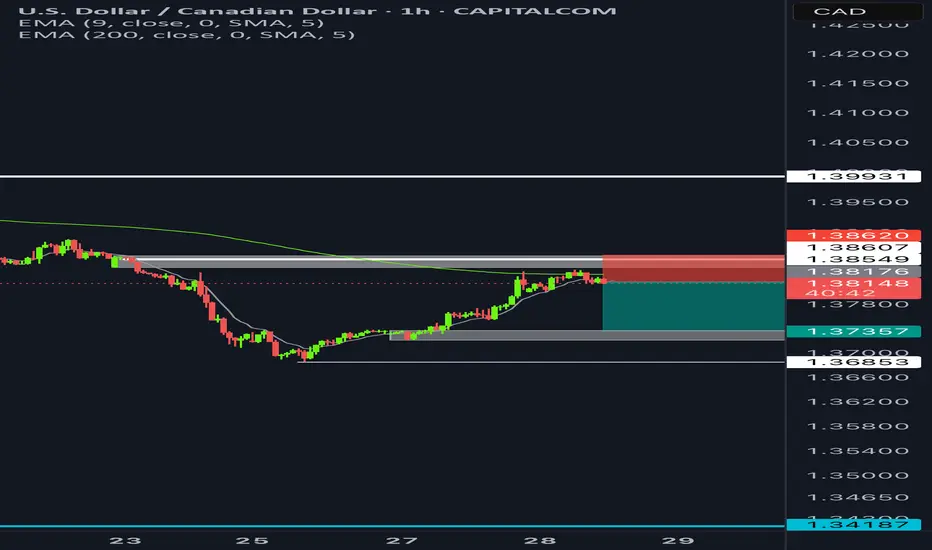
NNFX USDCAD Short Full Signal Signal: Short — Full Signal
Context: Price Breaks through with Volume, Full Signal 2 days behind C2
Probability: Normal to Weak - Signal 2 candles into C2 but huge volume short
Risk: Base 1%
R:R Plan: 0.72R, 75% scale-out at TP - Huge Range to Trend into 2R and opportunity to severely reduce risk within the first 24 hours.
Notes:
At first glance the R is not too great, but this is mainly due to breakout meaning stops are placed at full 1.5x ATR Away from entry but supported by the candle structure.
The range for this trade is large though, beyond 1xATR and even beyond 2x ATR. Opportunity to reduce risk to the order zone halfway through the candle which will make the R instantly positive. Reduced Risk to match the lower probability of this trade and other USD pending trades.
UsdcadSorry I posted be4 I made a mistake in the pairs I was to post my usdcad trade the 1 I posted was the wan I had privately and was a mistake
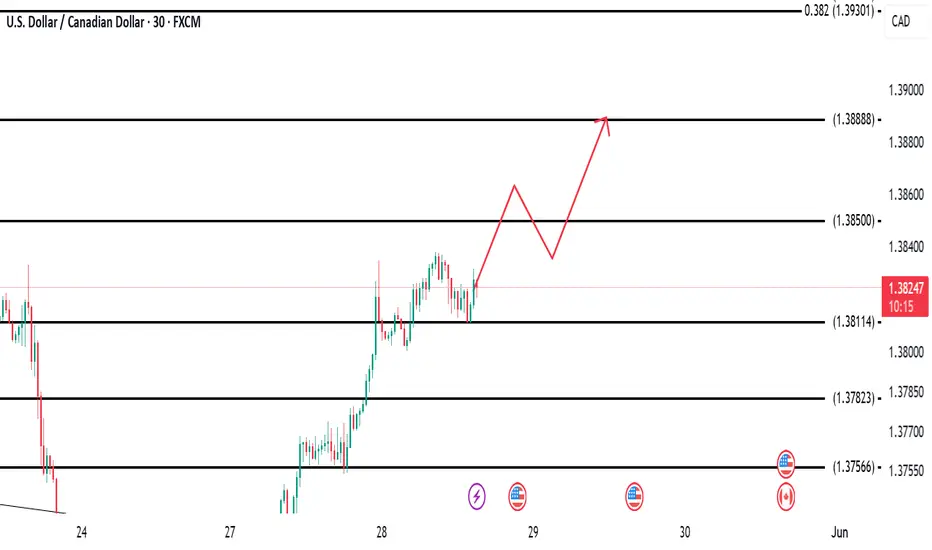
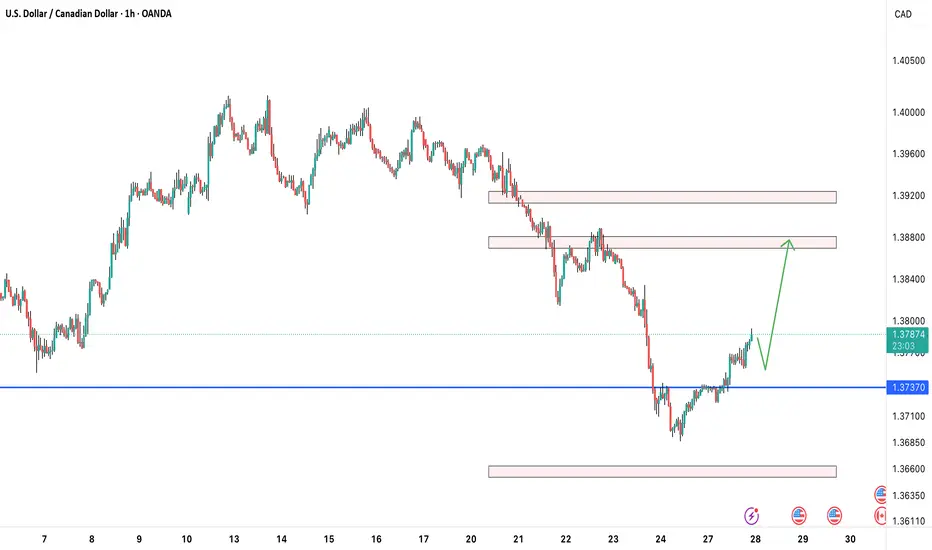
USD/CADThe pair has been in a clear downtrend, forming a bottom around the 1.3665 area, followed by a noticeable bullish rebound with consecutive bullish candles.
Key Support Zone:
1.3665 – Represents the recent bottom and a significant reversal point.
Upcoming Resistance Levels:
1.3818: A horizontal resistance that has been tested multiple times and is close to the current price.
1.3860 – 1.3880: A strong resistance zone, marking a previous reversal point.
1.3920 – 1.3950: The next resistance zone after a breakout, corresponding to a prior lower high.
Bullish Scenario (currently more likely):
If the upward momentum continues, price may reach the 1.3860 zone and potentially break above it toward 1.3920, provided it stabilizes above 1.3818.
Bearish Scenario (if the rally fails):
If the price forms a reversal candle near 1.3818 and fails to break through, a pullback may occur toward 1.3730, and possibly retest 1.3665.
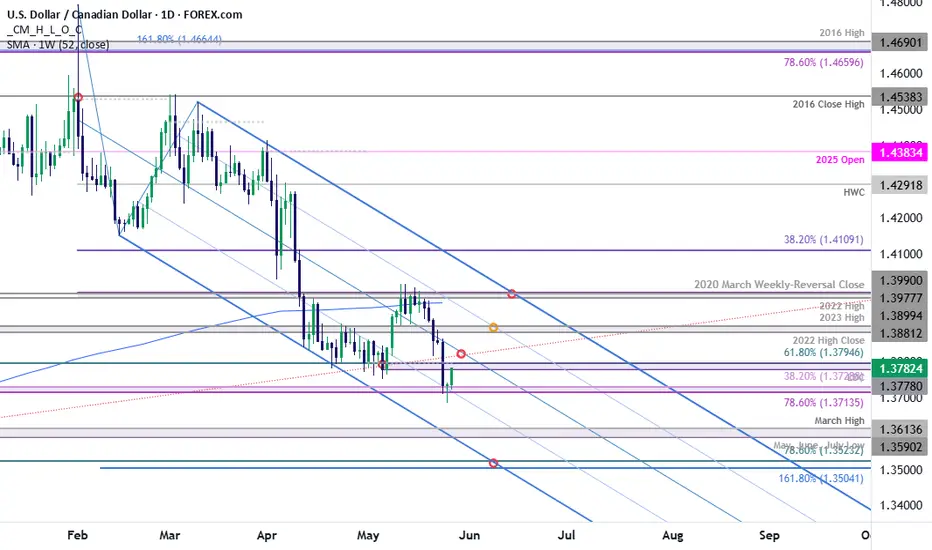
USD/CAD Bulls Emerge at Confluent SupportUSD/CAD has responded to confluent support at 1.3714/29 - a region defined by the 78.6% retracement of the September rally and the 38.2% retracement of the 2021 advance. Note that the 25% parallel of the descending pitchfork converges on this threshold over the next few days and a break / close below is needed to fuel the next leg of the decline / mark downtrend resumption.
Initial resistance is eyed with the 61.8% retracement of the late 2023 advance / May open at 1.3794/98 and is backed closely by the median-line. Rallies should be limited to this slope IF price is heading lower on this stretch with a break / close below this pivot zone exposing subsequent objectives at 1.3590- 1.3614 and 1.3504/23 . Broader bearish invalidation extends into the 200-day moving average at 1.3990-1.4019 .
-MB
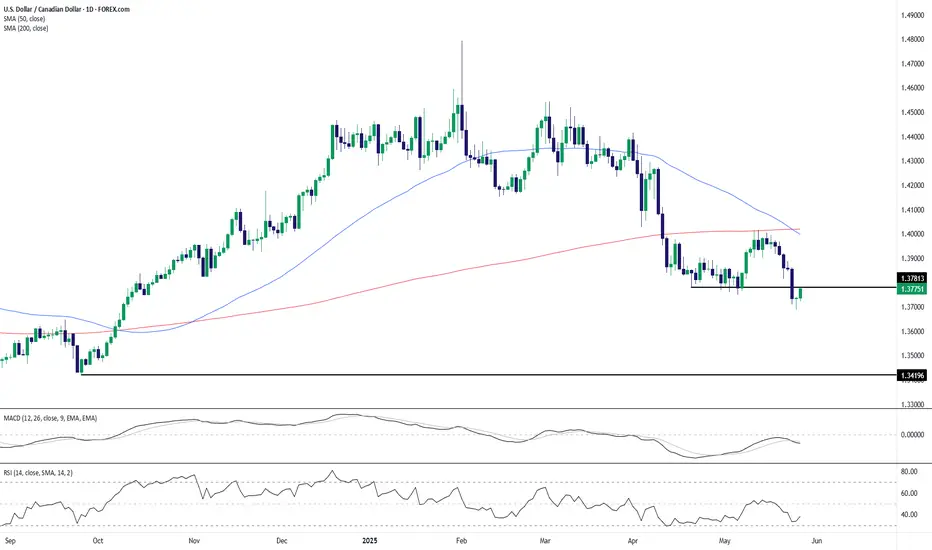
USD/CAD Defends Support but Bears Still LurkingUSD/CAD is clinging to key horizontal support around 1.3780 after a recent sharp decline:
Support Retest: Price briefly dipped below the 1.3780 area before buyers stepped in, forming a potential short-term base.
Downtrend Intact: Price remains well below both the 50- and 200-day SMAs, which are beginning to fan out—an increasingly bearish configuration.
Momentum Weak: MACD is negative and RSI is hovering just above oversold territory (~38), suggesting continued bearish pressure despite the bounce.
Critical Levels: A break below 1.3780 could open the door to 1.3420 (October support), while upside recovery would need a move above the 200-day (~1.40) to shift the broader tone.
The bounce may offer a short-term reprieve, but unless bulls reclaim trend-defining moving averages, the bears remain in control.
-MW
USDCAD: Strong Bearish Confirmation ?! 🇺🇸🇨🇦
I see an important sign of strength of the sellers on USDCAD
on an hourly time frame after a release of the today's US fundamentals.
The price violated a support line of a horizontal range and is retesting
that at the moment.
I believe that the price may drop at least to1.374 level soon.
❤️Please, support my work with like, thank you!❤️
I am part of Trade Nation's Influencer program and receive a monthly fee for using their TradingView charts in my analysis.
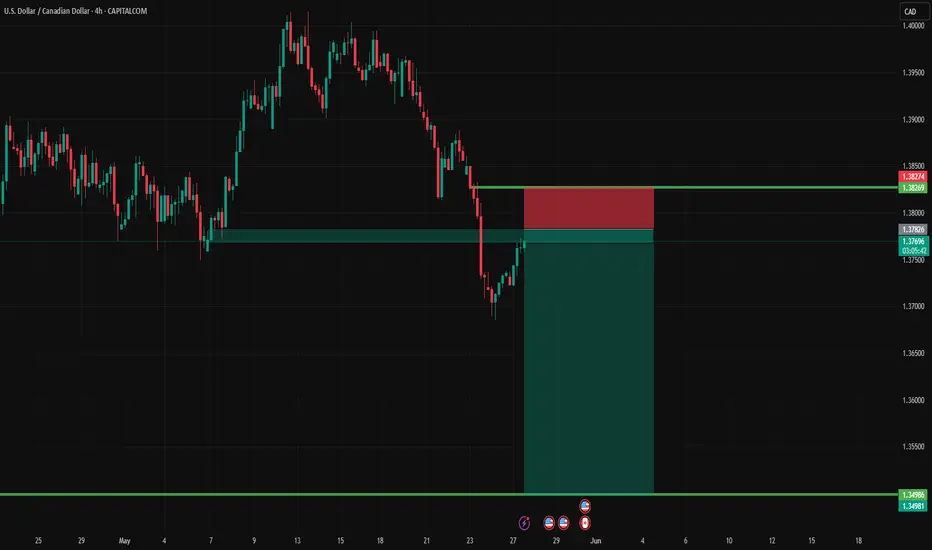
chakalaka @ Lap forex groupUSDCAD Potential selling continuation towards 1.34500 , fair entry with a good risk reward ratio is indicated on my analysis ...swing trading is the safest way to trade
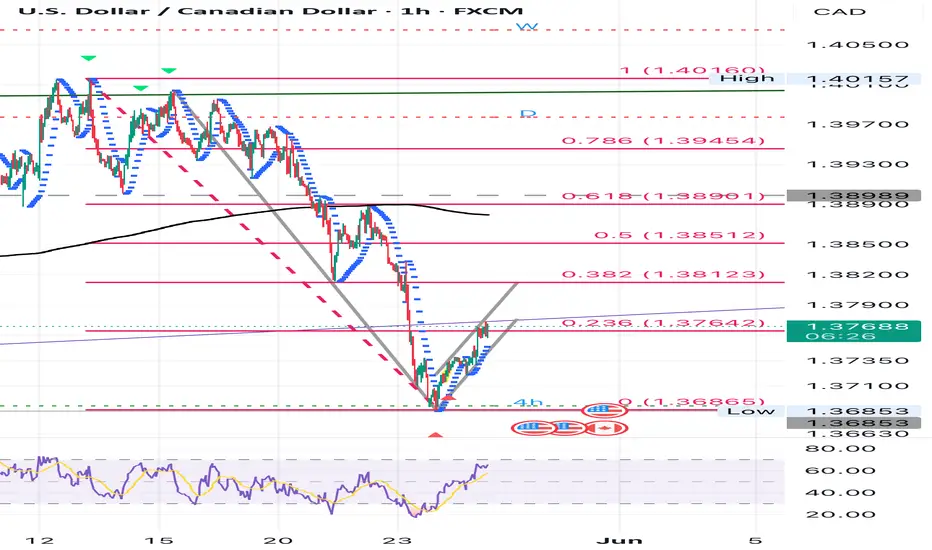
Hourly bearish retraceFibonacci tool pegged to a high and low where the retrace levels have confluence with previous swing support and resistances.
RSI getting close to overbought levels.
The recent higher lows and higher highs could be setting up for a bear flag.
How high will this bearish retrace go?
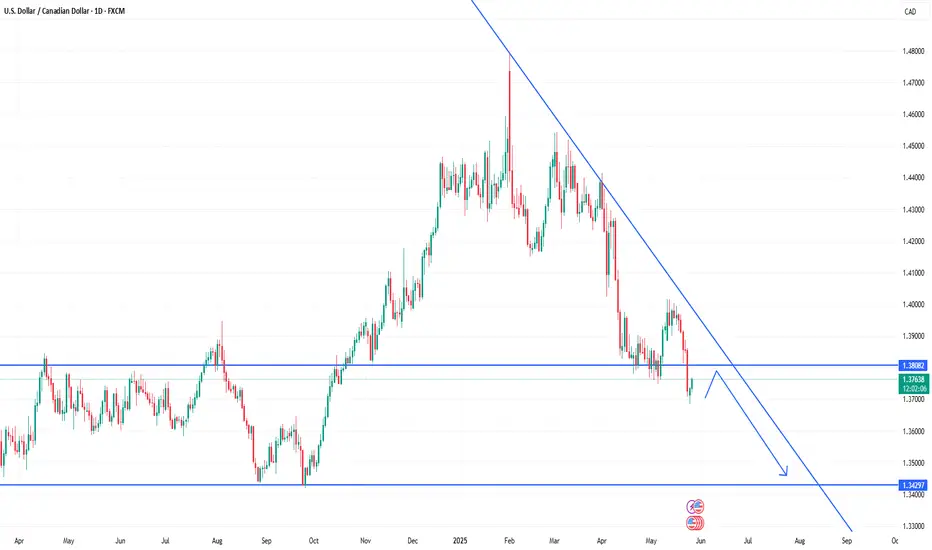
USD CAD Broken his important supportUSDCAD has broken its important support at 1.38082 and is looking for an opportunity to reach its next target at 1.34279.
Usdcad I had this position this morning we have a good counter trend trade is a high probability trade am on a buy too on usdcad
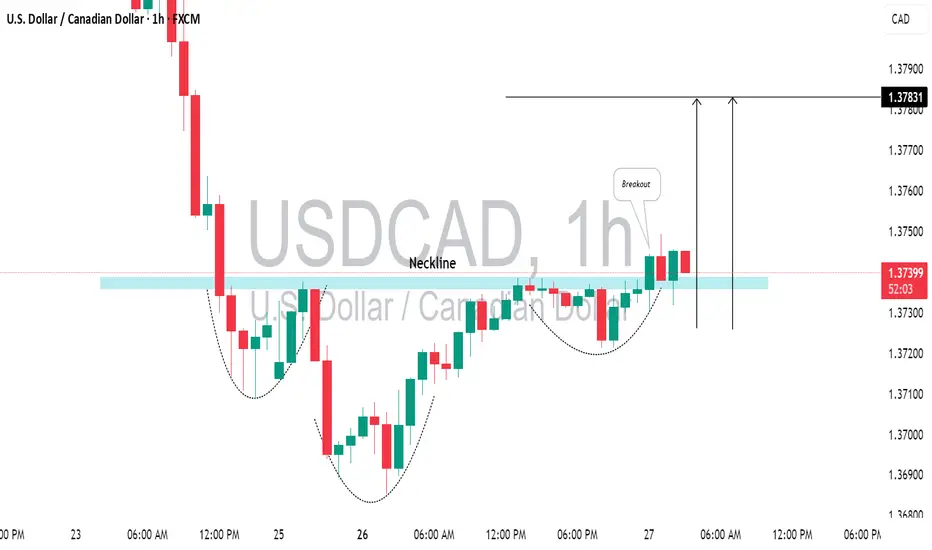
USDCAD: Bullish Reversal Confirmed?!The USDCAD formed an inverted head and shoulders pattern on hourly chart, indicating a strong bullish reversal with its neckline breakout.
This broken neckline now serves as important support, suggesting a potential rise to at least the 1.3783 level.
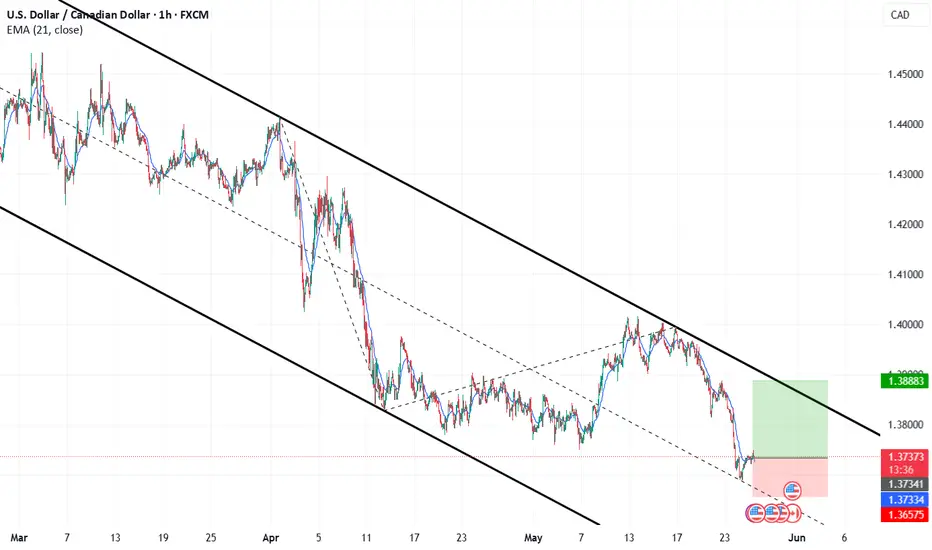
Trading Opportunity: USDCAD Long SetupGood morning All,
I've been analysing the USDCAD pair and noticed it's been oversold for some time. It just reached the midband of the falling channel yesterday, which suggests a potential long opportunity to me. I believe this setup offers a favourable risk-to-reward ratio of 1:2. Here are the details:
- Entry Point: 1.3734
- Take Profit (TP): 1.3888
- Stop Loss (SL): 1.3657
Wishing you all the best with your trades!
Ehsan