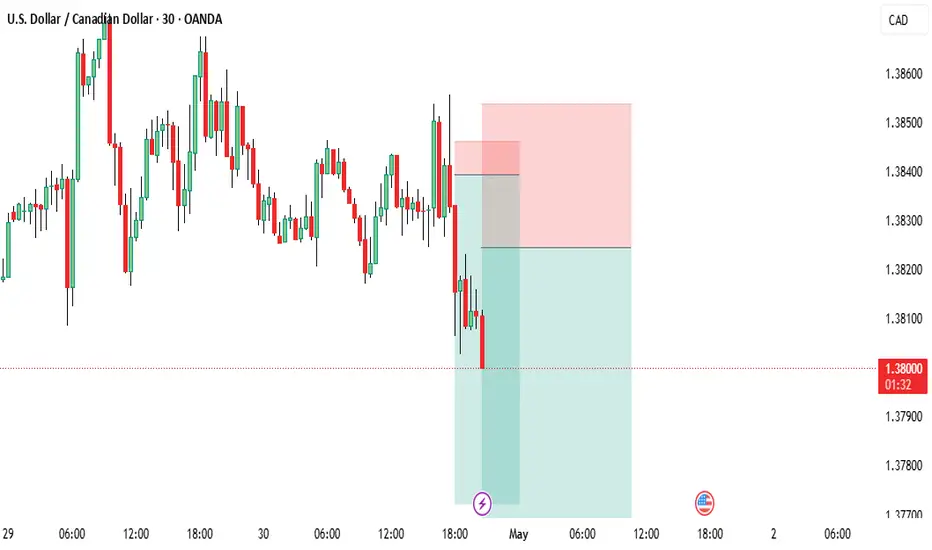
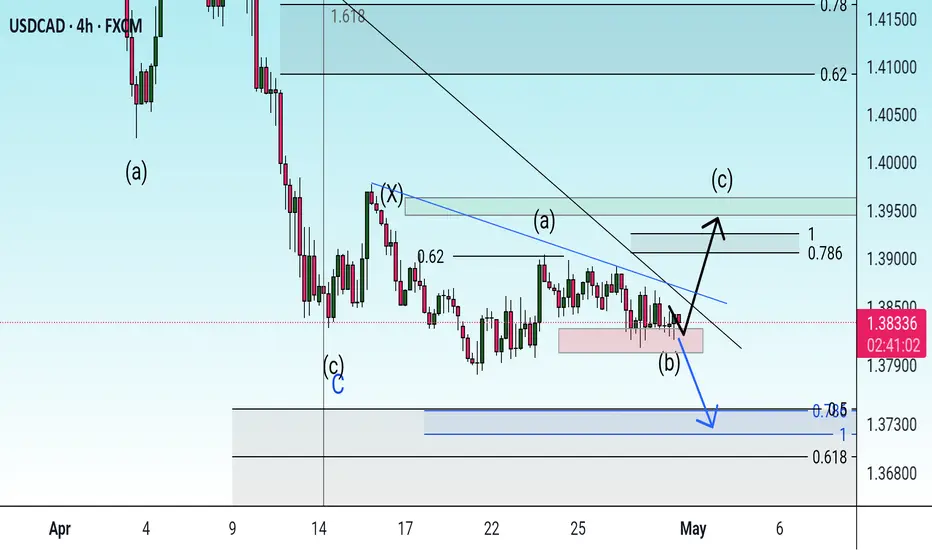
#usdcadYou can enter in two steps and the best entry is in the low-risk zone. The low-risk zone has a reward of 1 to 10, which can also be done risk-free, but I recommend being patient until you reach TP 10.
CADUSD trade ideas
USDCAD BUY LongTrade with patience on this pair as there was election in Canada on this week. It is just my analysis. Let us Check how it works.
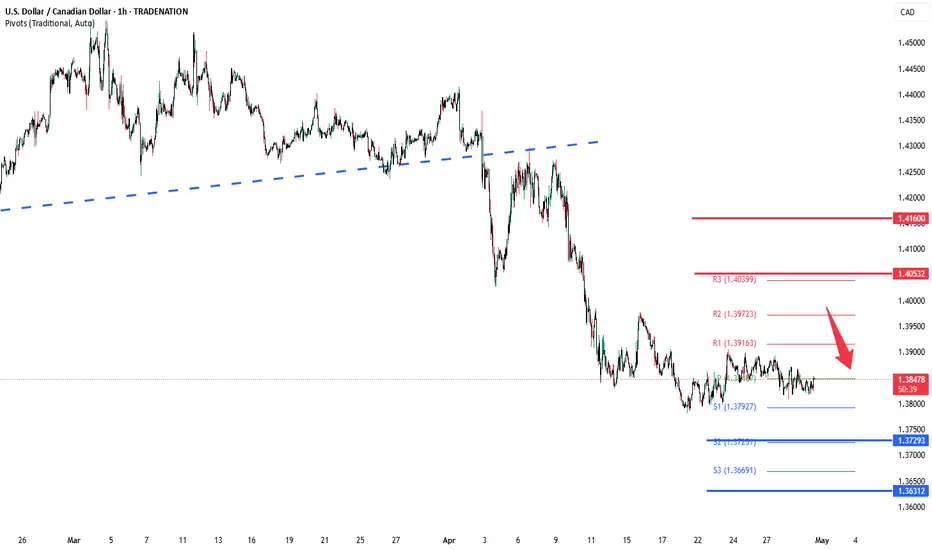
USDCAD INTRADAY sideways consolidationThe USDCAD pair is exhibiting a bearish sentiment, reinforced by the ongoing downtrend. The key trading level to watch is at 1.4060, which represents the current intraday swing low and the falling resistance trendline level.
In the short term, an oversold rally from current levels, followed by a bearish rejection at the 1.4060 resistance, could lead to a downside move targeting support at 1.3780, with further potential declines to 1.3730 and 1.3630 over a longer timeframe.
On the other hand, a confirmed breakout above the 1.4060 resistance level and a daily close above that mark would invalidate the bearish outlook. This scenario could pave the way for a continuation of the rally, aiming to retest the 1.4080 resistance, with a potential extension to 1.4160 levels.
Conclusion:
Currently, the USDCAD sentiment remains bearish, with the 1.4060 level acting as a pivotal resistance. Traders should watch for either a bearish rejection at this level or a breakout and daily close above it to determine the next directional move. Caution is advised until the price action confirms a clear break or rejection.
This communication is for informational purposes only and should not be viewed as any form of recommendation as to a particular course of action or as investment advice. It is not intended as an offer or solicitation for the purchase or sale of any financial instrument or as an official confirmation of any transaction. Opinions, estimates and assumptions expressed herein are made as of the date of this communication and are subject to change without notice. This communication has been prepared based upon information, including market prices, data and other information, believed to be reliable; however, Trade Nation does not warrant its completeness or accuracy. All market prices and market data contained in or attached to this communication are indicative and subject to change without notice.
USDCAD LongWe are in a support and we are in a support zone. hoping to purchase the pair at the current rate
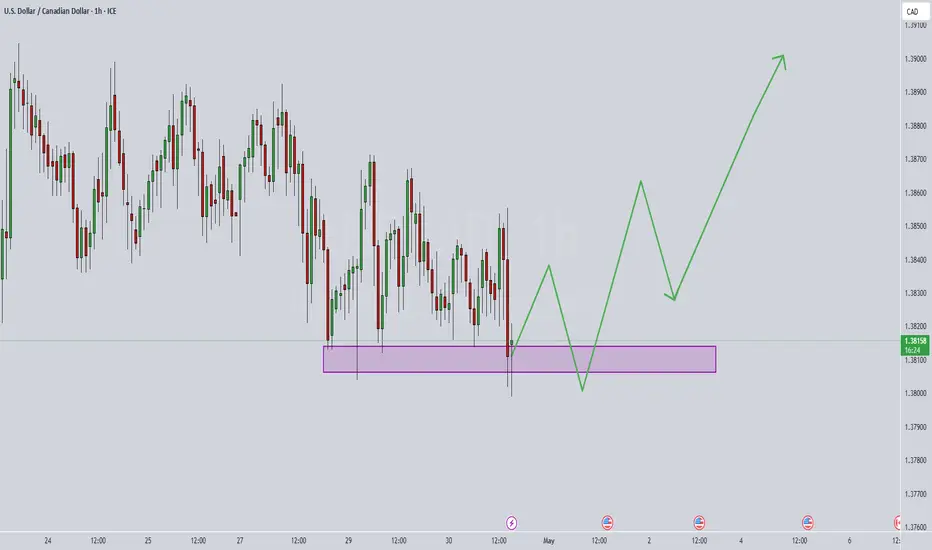
Possibility of uptrend The price is expected to consolidate above the support area, then if the resistance trend line is broken, a continuation of the uptrend is likely.
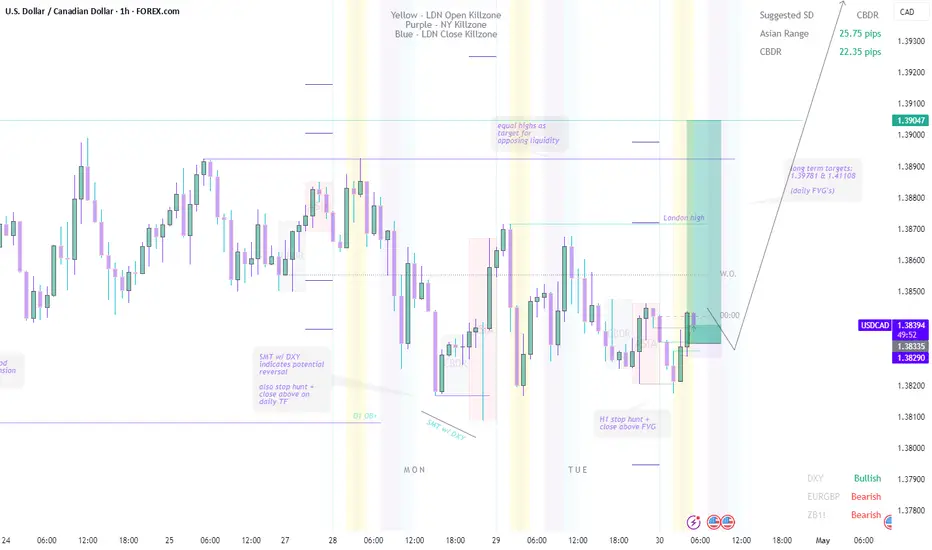
USDCAD swing longsFrom fundamental analysis on CAD futures derived from "barchart.com". Currently as of writing (Monday 30th April 2025), we can see the CAD futures price increasing from this day but the Open Interest has been decreasing steadily so we can anticipate a reversal soon for the futures price (to flip bearish), which means bullish PA for USDCAD (this could also give you a slight insight/confirmation to DXY’s potential price).
Technicals outlined in chart using price action.
USDCAD LONG FORECAST Q2 W18 D30 Y25 USDCAD LONG FORECAST Q2 W18 D30 Y25
Professional Risk Managers👋
Welcome back to another FRGNT chart update📈
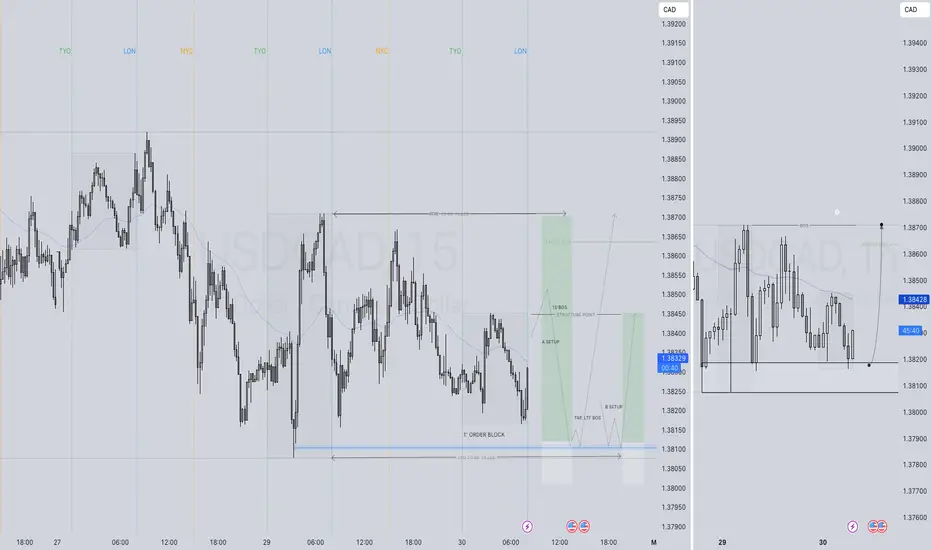
Diving into some Forex setups using predominantly higher time frame order blocks alongside confirmation breaks of structure.
Let’s see what price action is telling us today!
💡Here are some trade confluences📝
✅Intraday bullish breaks of structure
✅Tokyo ranges to be filled
✅Daily low rejection
✅1' order block identified
🔑 Remember, to participate in trading comes always with a degree of risk, therefore as professional risk managers it remains vital that we stick to our risk management plan as well as our trading strategies.
📈The rest, we leave to the balance of probabilities.
💡Fail to plan. Plan to fail.
🏆It has always been that simple.
❤️Good luck with your trading journey, I shall see you at the very top.
🎯Trade consistent, FRGNT X
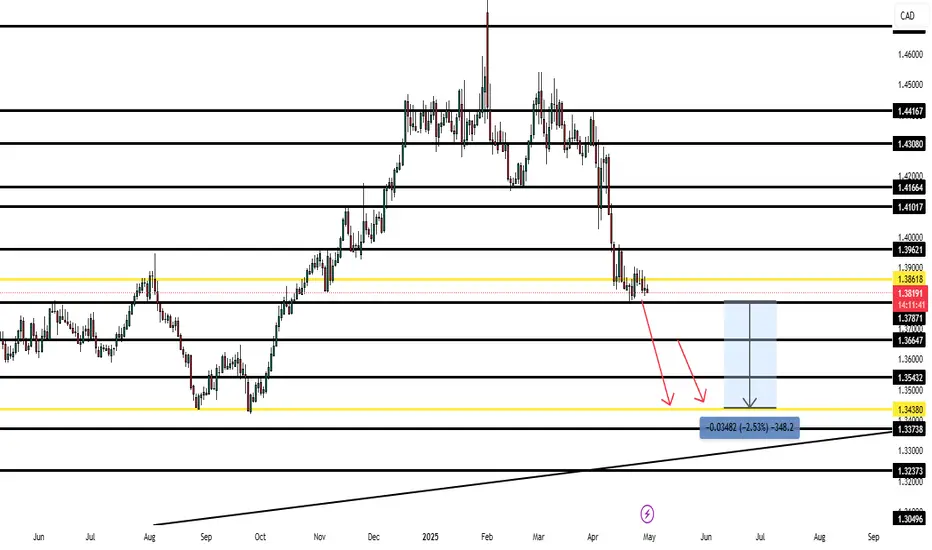
USDCAD – DAILY OUTLOOK – APRIL 29Looking at the daily chart, USDCAD hasn’t done much in terms of our longer-term target but continues to reject 1.38618, which adds confluence to the bearish bias.
That being said, the consistent failure to push higher makes me doubt we’ll see the deeper pullback to 1.39621—unless we get a strong fundamental catalyst. So for now:
📉 Current sell zones:
– 1.37871
– 1.36647
🎯 First target = 1.34380 (300+ pips available)
Will reassess if any news shifts the bias, but structure-wise we stay short.
USDCAD | Technical Rebound or Final Stop Before the Crash?USDCAD is currently in a highly delicate phase: the price has reached a key weekly demand zone between 1.3720–1.3820, which overlaps with a strong Fibonacci retracement cluster (0.705–0.78) of the previous bullish leg. So far, the reaction has been muted, but price compression and fading volatility suggest a potential short-term rebound.
However, looking at the bigger picture, the macro and positioning signals are flashing red for the US dollar:
📊 COT Report: Non-Commercials are significantly increasing short positions on USD and reducing shorts on CAD → bearish bias on USDCAD
🧠 Retail sentiment: Most retail traders are long on USDCAD → contrarian bearish bias
🗓️ Seasonality: May is historically negative for the USD and positive for the CAD → further confirms the short thesis
Only a structural recovery above 1.4150 on the weekly close would invalidate the bearish setup. Until then, any retracement towards 1.3980–1.4050 should be seen as an opportunity to sell strength.
🎯 Key Levels:
Sell zone: 1.3980–1.4050
Invalidation: Weekly close > 1.4150
Targets: 1.3720 – 1.3550
🔔 Critical note: When everyone is long, often the only direction left is down.

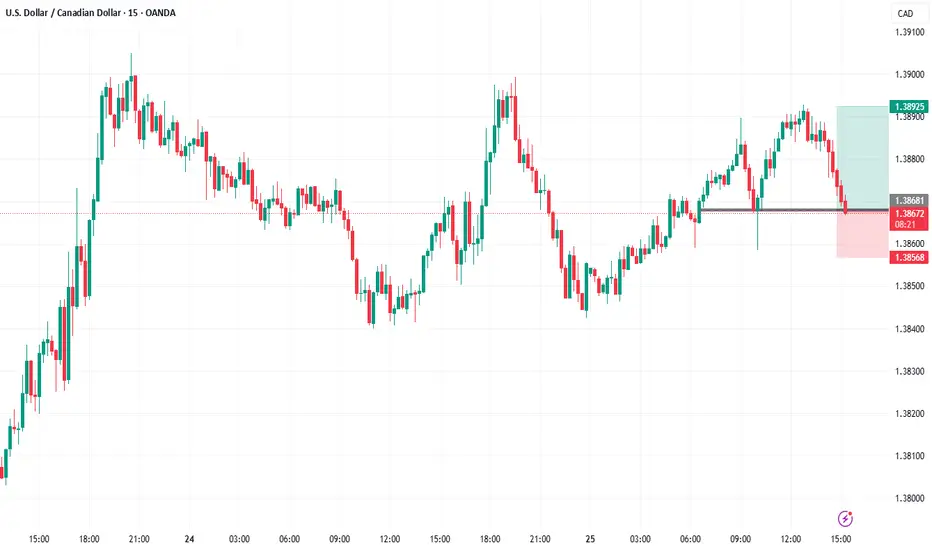
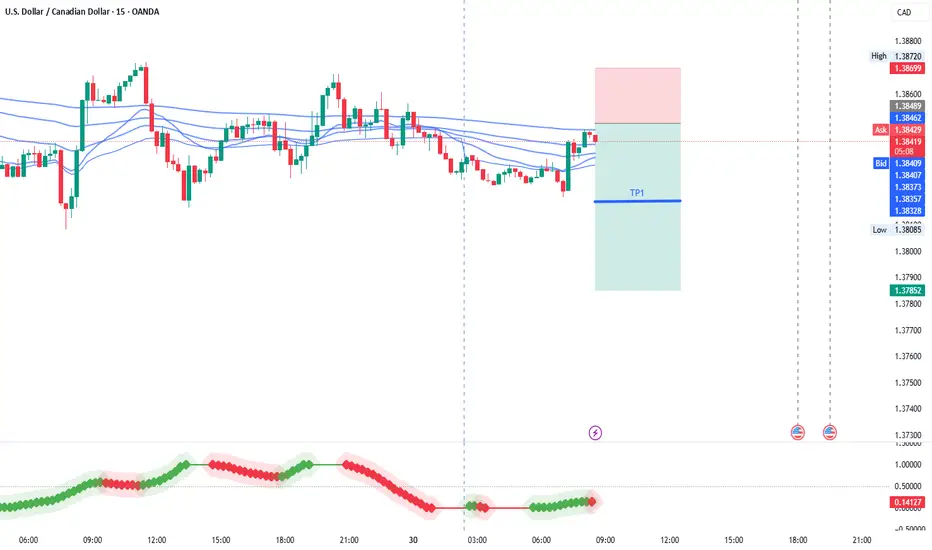
USDCAD SHORT IDEAUnder current market conditions, the area near 1.3849 has been identified as a critical resistance zone, where the AI model detects a high-probability trade setup.
From a technical perspective, a clear directional bias based on recent price action patterns. Suppose the market demonstrates increased volume and price stability above key moving averages in the 1.3849 area. In that case, traders are advised to monitor for trend-continuation entry opportunities in alignment with the prevailing momentum.
Profit targets are defined at 1.3819 and 1.3785, corresponding to logical technical support zones. These levels are designed for staged profit-taking across different trade management styles. Stop-loss should be strictly enforced at the designated level; once breached, the strategy is considered invalidated in order to limit potential downside.
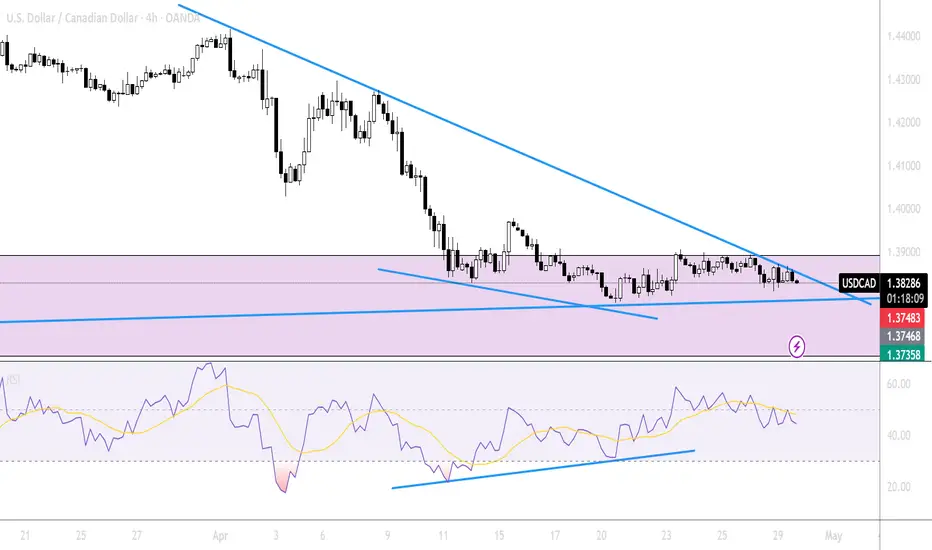
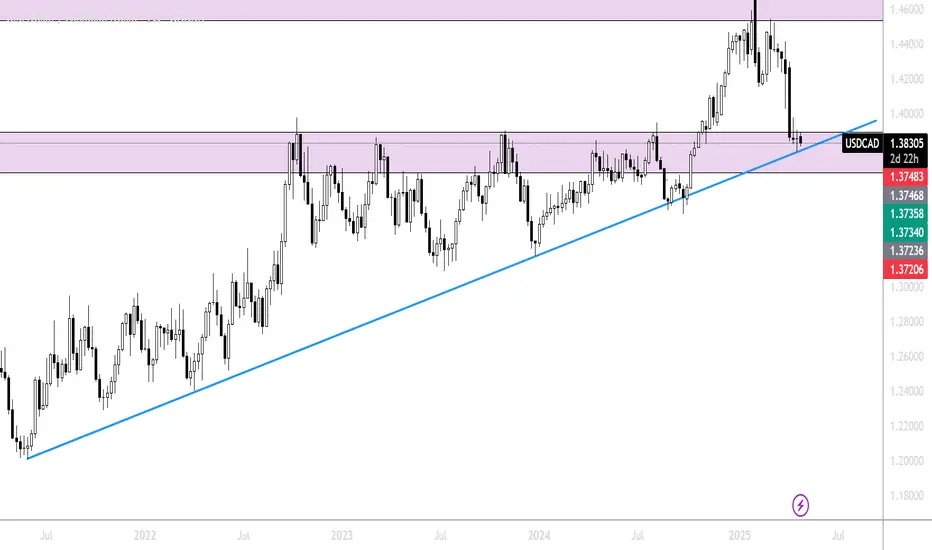
TOP DOWN ANALYSIS ON USDCAD 4HR ON THE 4HR TIMEFRAME, We established the key monthly zone + weekly trendline + wide divergence all signaling bullish and hence rhyming with the monthly, weekly and daily bullish bias. Our confirmation will be the break of the 4hr trend line for a possible quick entry long!!
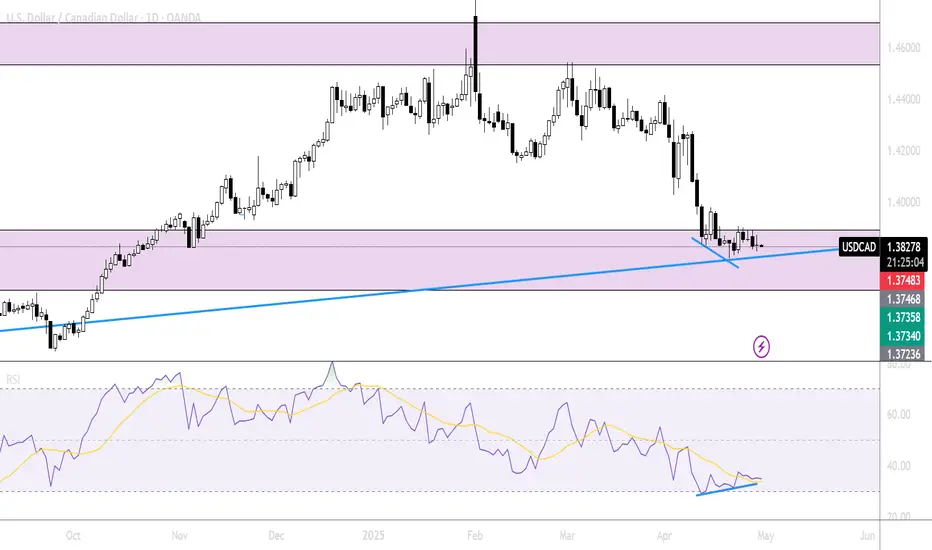
TOP DOWN ANALYSIS ON USDCAD DAILY TIMEFRAME ON THE DAILY TIMEFRAME, We established the major zone + the weekly trend line + momentum loss as price approached the key zone + tight divergence all signaling bullish!!
Top Down Analysis on USDCADOn the WEEKLY timeframe We were able to establish the monthly zone rhyming with the weekly zone + the weekly trendline right at the zone + Last week Candle formation which happened to close as doji right at the Zone which all signals bullish.
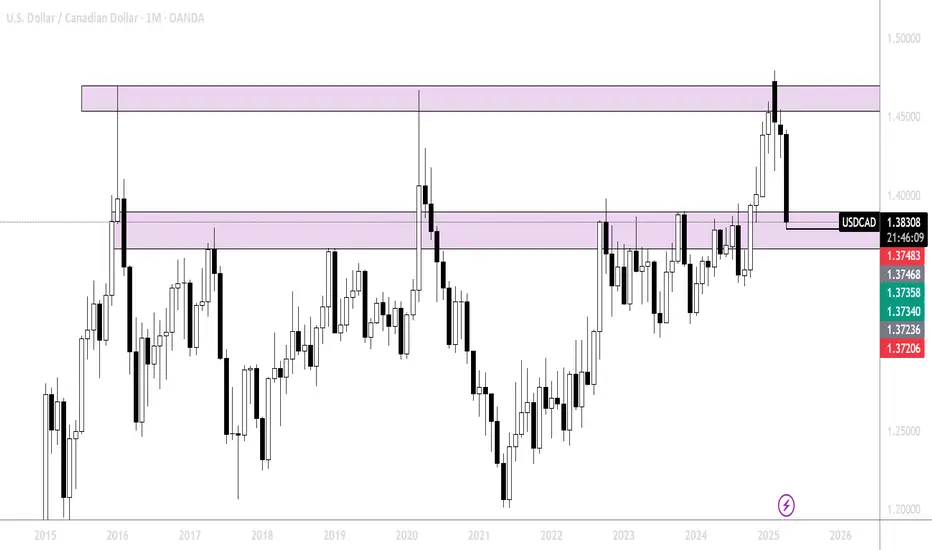
TOP DOWN ANALYSIS ON USDCADMONTHLY TIME FRAME : Price dropped from a major swing high monthly zone however price is currently on another major zone again but haven't reacted as the monthly candle is not closed yet hence we wait for the monthly candle close for a possible price action on the monthly timeframe.
Daily Price Action: USDCAD Tuesday 4/29/2025In this video, we will be looking into the potential price action USDCAD.

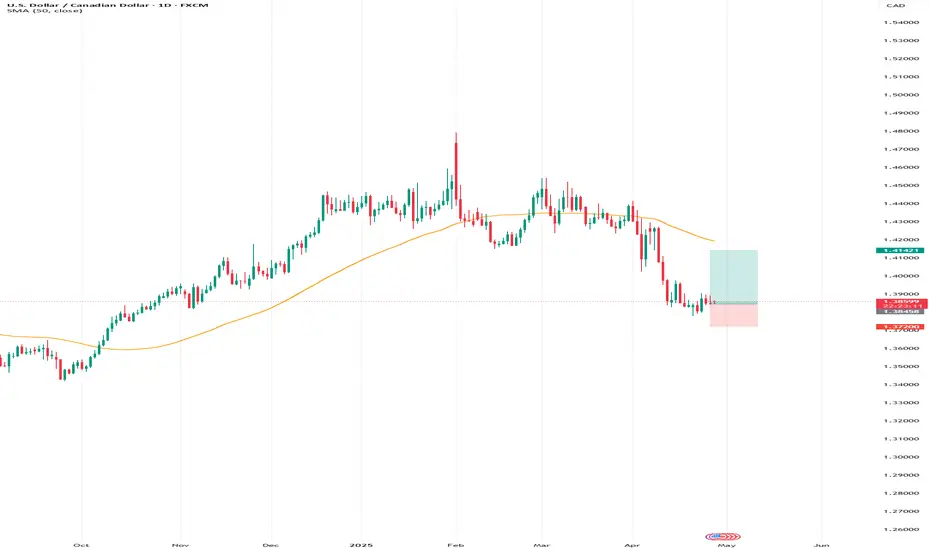
USDCAD Buy IdeaUSDCAD is bouncing off a major daily support level around 1.38100 after a strong bearish move. Price action shows early signs of bullish interest, with the potential for a correction toward the 50-day Simple Moving Average. My target is set slightly lower at 1.4142 to ensure profits are secured before major resistance hits.