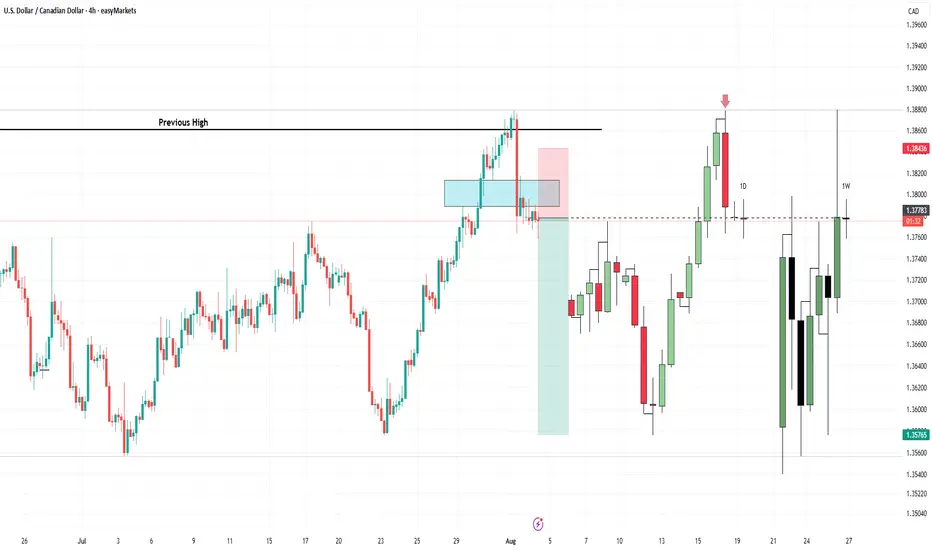
USDCAD IDEAConfluence of Previous weekly high with Daily EBP (Engulfing Bar Play), 4 hour entry after 4h Order block taken and 4H IFVG.
CADUSD trade ideas
USDCAD 4H chart bullish setup - 04 August 2025🔍 1. Market Overview
🔸 Technical Outlook (4H Chart)
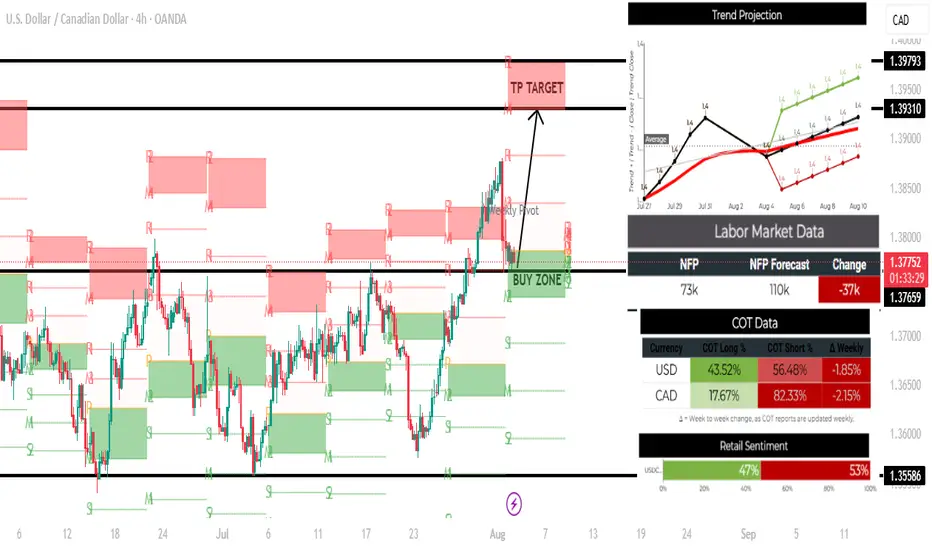
Price: Currently at 1.37792, just above a strong Buy Zone at 1.37659.
Structure: Bullish trend continuation with higher highs and higher lows.
Targets:
TP Target: Clearly marked at 1.39310 to 1.39793 resistance zone.
Support: Strong base near 1.37659; additional support at 1.35586.
Bias: Bullish, based on structure and rejection near support.
🔸 Trend Projection
The black average trend line shows price is likely to rebound upward starting August 4, aligning with the technical bullish zone.
Green projections suggest upside potential, supporting a long bias.
Red projections are possible but less likely based on current price structure and support strength.
📊 2. Fundamental Analysis
🔸 Labor Market (NFP Report)
Actual: 73k vs Forecast: 110k → -37k miss (Bearish for USD)
Impact: Weak U.S. labor data could temporarily weaken USD, but CAD is even weaker fundamentally (see below), making USDCAD likely to still rise.
🔸 COT (Commitment of Traders) Data
USD: Net short (43.52% long vs 56.48% short) → Slightly bearish.
CAD: Extremely bearish (17.67% long vs 82.33% short).
Net Positioning Bias: Bullish USDCAD (weaker CAD sentiment outweighs USD weakness).
🔸 Retail Sentiment
Retail is 53% Short vs 47% Long → Slightly more traders are betting against USDCAD.
Contrarian View: Retail traders are often wrong at turning points, which adds to bullish bias.
✅ 3. Trade Plan
🟢 Entry Plan
Entry Zone: Between 1.37659 and 1.37800 (buy zone, minor retracement area).
Confirmation: Look for a bullish candlestick reversal pattern (hammer, engulfing) on 1H/4H timeframe.
🎯 Take Profit (TP)
Primary TP: 1.39310 (strong resistance & marked TP target).
Extended TP: 1.39793 (monthly resistance level).
🛑 Stop Loss (SL)
Below support: 1.37250, just below the buy zone to avoid noise.
📌 4. Risk-Reward Ratio
Entry: ~1.3779
SL: 1.3725 (≈54 pips)
TP: 1.3931 (≈152 pips)
R:R ≈ 1:2.8 → Solid setup
⚠️ 5. Risk & News Events
Be aware of upcoming CAD data or USD CPI/inflation releases.
If risk sentiment worsens globally (e.g., oil prices rise → CAD strength), consider tightening stop or partial profits.
BULLS Cleared path for Buyers...A Buy Setup On USD/CAD..The 4H was significant enough to break both key levels 👌
USDCAD about to Burst soon!Consolidating in 1H and 30M.
Maybe something big is going to happen during the London Session.
We wait for a nice bearish candle to enter. Also, it will be nice to see price go below the blue line drawn, as it will give us further confirmation about the downwards move.

Potential Buy Opportunity on USDCADReasons I think this pair will rise
-Price gave us a triple bottom formation which tells us bears could not continue pushing the market down. Suggesting price will rise.
- RSI was oversold on the 4H
What do you think ?
My USDCAD bullish senarioAs dxy looks like it wants to retrace higher, I would expect the same outcome with USDCAD . Ive outlined what im looking for as price retrace from a key area back into 50% of daily fib to look for long side buys. Let's see how this pans out
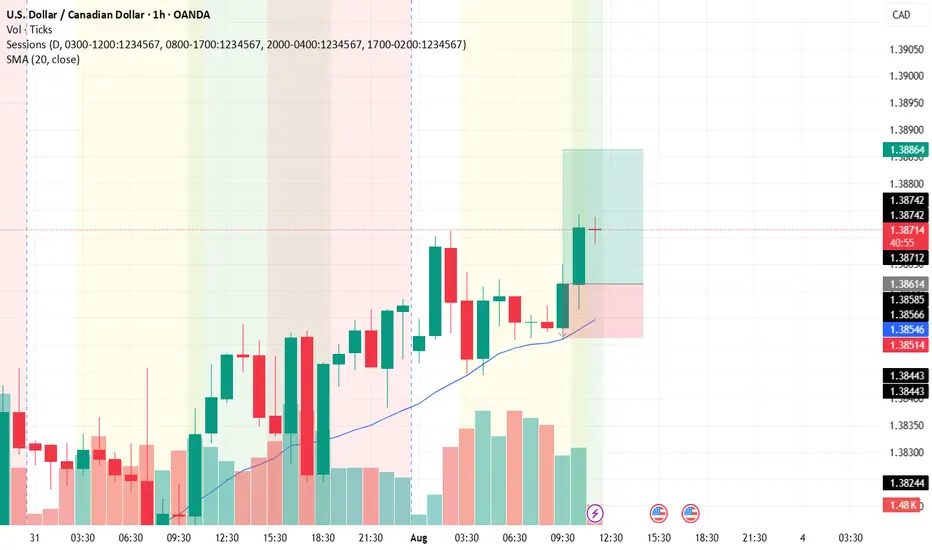
USD/CADThis is a trade setup for USD/CAD, based on volume and trend analysis.
Entry Price: 1.38614
Stop-Loss (SL): 1.38514
Take-Profit (TP): 1.38864
The trade is intended to be executed instantly at the mentioned price, in alignment with both volume behavior and the current trend direction.
Disclaimer: This setup is shared purely for backtesting purposes and to document trade ideas. It is not financial advice. Always perform your own analysis before making any trading decisions.
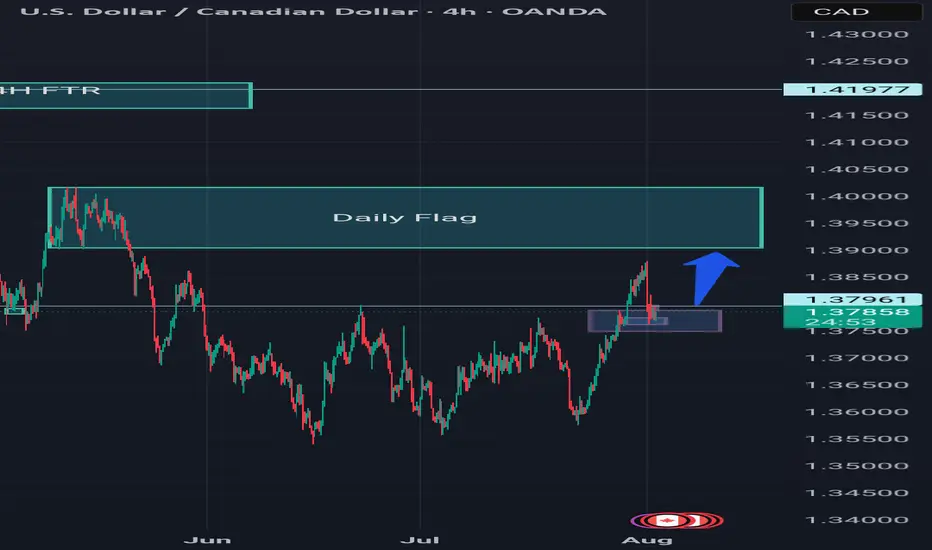
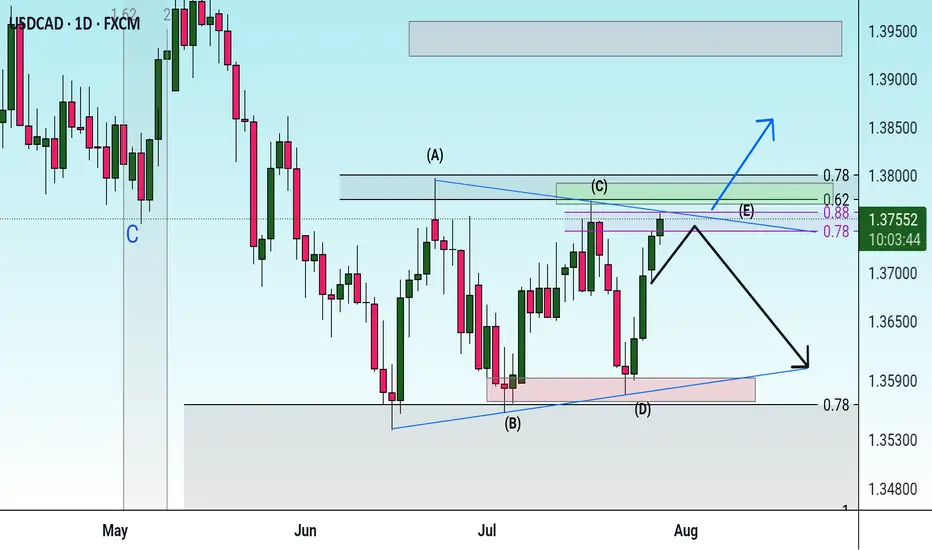
USD/CAD potential leg up setuppotential setup. Trade Plan following Road Map:
-wait for pull back zone to enter.
-pull trigger on reversal signal. monitor declining volume as confirmation- "a spike in volume for pull back ending
-target 1 zone - 1.40 area. SL lock in +/- 50% of gains at key areas of structure on 15 minute chart.
-target 2 zone - on route to T2Z use 14 ema and 34 ema as trend continuation on 5 minute and 15 minute chart - key structure: SL zone
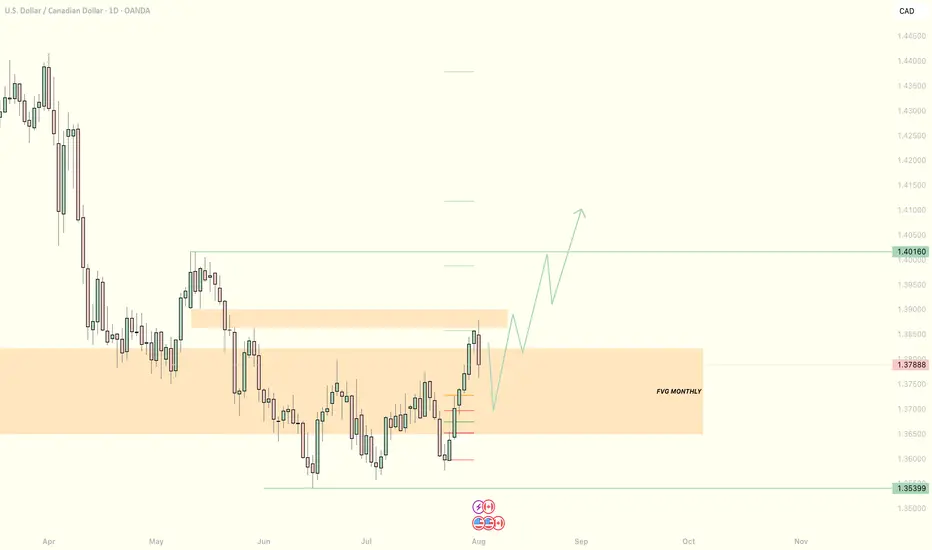
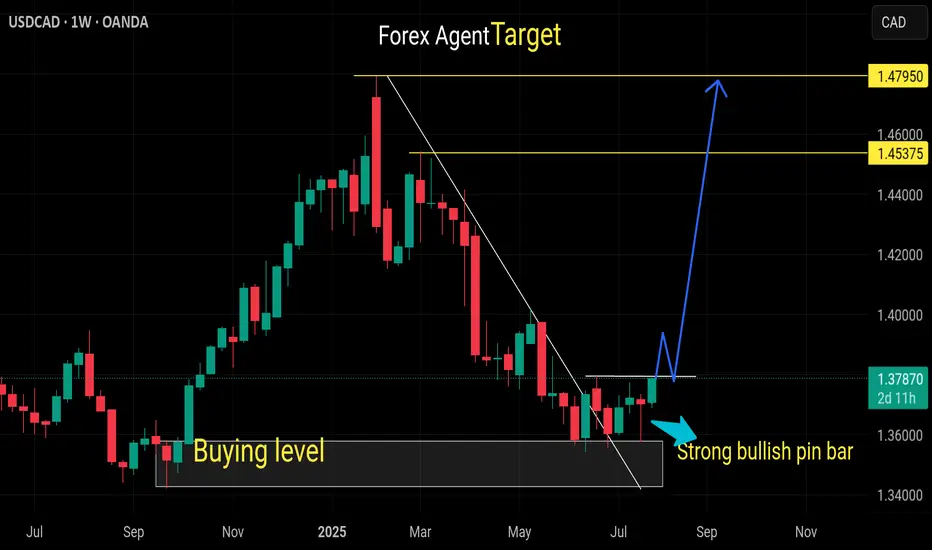
USDCAD Triple Bottom? Ready for long run?USDCAD formed a triple bottom on high time frame and is likely to Reach target of 1.4. the third bottom is also formed and is about finish soon the pattern. Enter the trade when the neck is broken or if the price come to 0.5 fib level from this bottom level.

USDCAD resistance breakout at 1.3767The USDCAD remains in a bullish trend, with recent price action showing signs of a corrective pullback within the broader uptrend.
Support Zone: 1.3730 – a key level from previous consolidation. Price is currently testing or approaching this level.
A bullish rebound from 1.3730 would confirm ongoing upside momentum, with potential targets at:
1.3830 – initial resistance
1.3860 – psychological and structural level
1.3890 – extended resistance on the longer-term chart
Bearish Scenario:
A confirmed break and daily close below 1.3730 would weaken the bullish outlook and suggest deeper downside risk toward:
1.3716 – minor support
1.3690 – stronger support and potential demand zone
Outlook:
Bullish bias remains intact while the WTI Crude holds above 1.3730. A sustained break below this level could shift momentum to the downside in the short term.
This communication is for informational purposes only and should not be viewed as any form of recommendation as to a particular course of action or as investment advice. It is not intended as an offer or solicitation for the purchase or sale of any financial instrument or as an official confirmation of any transaction. Opinions, estimates and assumptions expressed herein are made as of the date of this communication and are subject to change without notice. This communication has been prepared based upon information, including market prices, data and other information, believed to be reliable; however, Trade Nation does not warrant its completeness or accuracy. All market prices and market data contained in or attached to this communication are indicative and subject to change without notice.

Buy usdcadOur last buying idea already running 100+ pips in buy
In my view usdcad ready to break this resistance
It can be today and next month candel
Weekly and monthly already oversold pair
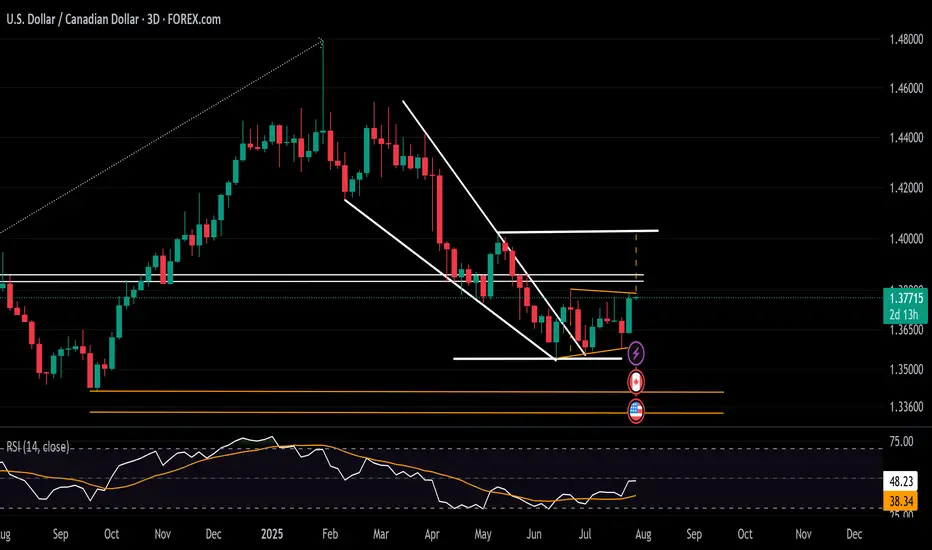
USDCAD Rebound Steadies Ahead of BOC and FOMC MeetingsAligned with the DXY holding above the 96 support and approaching the 100-resistance, the USDCAD is maintaining a rebound above the 1.3540 level.
It has maintained a hold beyond the boundaries of a contracting downtrend across 2025 and is aiming for the 1.38 resistance to confirm a steeper bullish breakout.
A sustained move above 1.38, which connects lower highs from June and July, while the RSI holds below the 50 neutral line, could extend gains toward the 1.40 level.
From the downside, should the breakout above 1.38 fail, the pair may remain trapped within the consolidation range extending from June, with initial support seen at 1.3580.
Written by Razan Hilal, CMT
USD/CAD LongLooking for a retest of 1.35600 zone for a bounce back up to 1.37650 supply zone
FX:USDCAD
Check the trend Given that there is a possibility of a triangle pattern forming, it is expected that the price will change direction at the current resistance level and a downtrend will begin. If the price consolidates above the green resistance level, the uptrend will likely continue.
USDCAD Bounce May Face Strong ResistanceUSDCAD is attempting to bounce back, supported by a stronger U.S. dollar index. The recent trade deals with Japan and the Eurozone have prompted traders to position more favorably toward the dollar. The sharp decline in EURUSD is also putting upward pressure on USDCAD.
This week will be crucial for both the U.S. and Canada, with a flood of economic data and major central bank events ahead. The Federal Reserve and the Bank of Canada are both expected to hold rates at tomorrow’s meetings. Although pressure from Trump is unlikely to sway FOMC members into a rate cut, the new trade deals do reduce policy uncertainty, which could increase the likelihood of a rate cut in September. Any minor hint of this scenario will likely be interpreted as dovish by the markets.
The Bank of Canada, in contrast, is expected to remain firmly dovish as tariffs continue to weigh heavily on growth. Meanwhile, Trump’s recent comments regarding Canadian tariffs are unlikely to boost economic confidence in Canada, although Carney is actively pushing for an improved trade agreement.
Aside from central bank meetings, both countries will release GDP data this week. Canada’s economy is expected to contract by 0.1% in May, with GDP figures arriving alongside employment change and the U.S. PCE report. A strong surprise from Canada could help limit the effect of the rising dollar index on USDCAD.
In the U.S., GDP, PCE, and payrolls data will make this one of the most unpredictable weeks for markets in recent months.
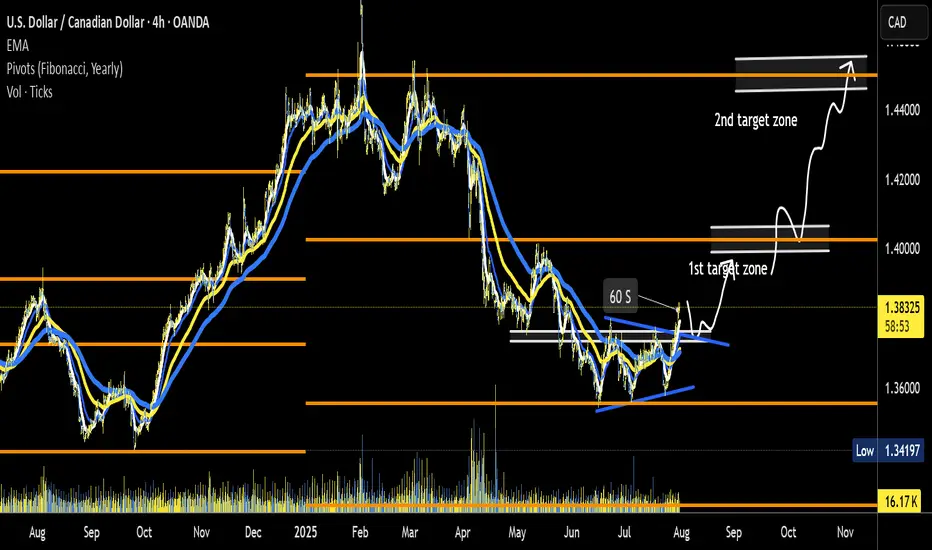
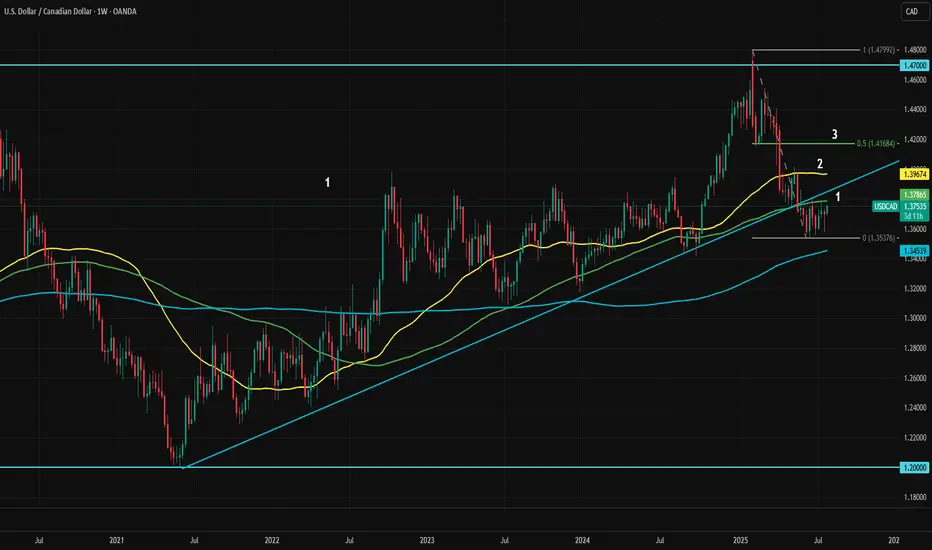
USDCAD is currently testing its 100-week moving average. The immediate resistance levels are 1.3786 and 1.3850, both marked as “1” in the chart as the first resistance area. If dollar index strength continues after the initial shock, the second resistance zone defined by the May top and the 50-week moving average will become the next target.
If dollar dominance persists in the medium term, the ultimate target would be 1.4170. This area is likely to act as strong resistance, as it includes the midpoint of the March to July pullback, the 23.6% Fibonacci retracement level of the 2021 to 2025 uptrend, and the February dip.
As long as this resistance holds, any upward moves can be considered potential selling opportunities. However, it remains uncertain which of the resistance levels will mark the top.
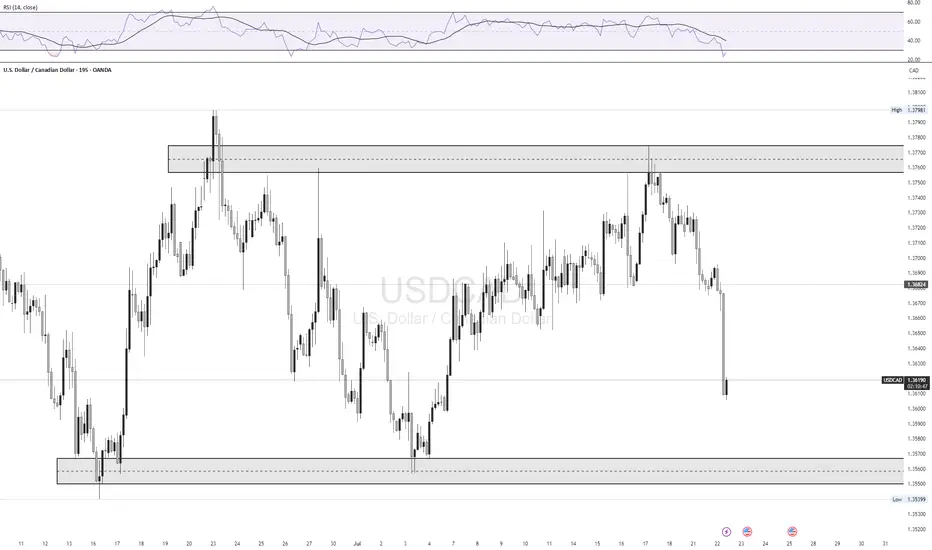
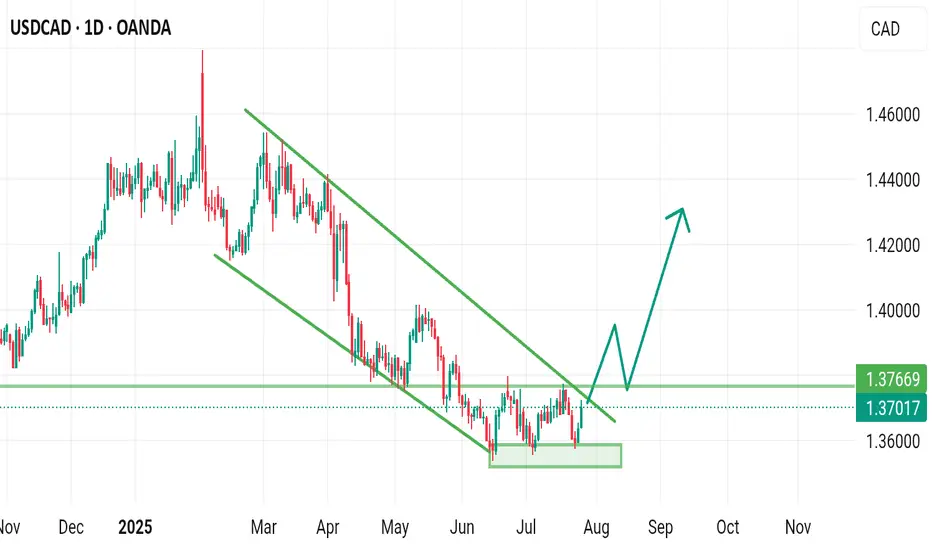
USDCAD USDCAD has entered a range since the start of June.
retesting very strong resistance levels again.
creating a rising wedge reversal at this key high level of resistance.
looking for a sell off


USDCAD 1H buyHello friends. If the price in USDCAD returns to the specified area on the 1h timeframe, it is suitable for a buy position.
This is just a theory

USDCAD Analysis week 31🌐Fundamental Analysis
The Canadian dollar continued to decline against the US dollar on Friday. Trump returned to threatening tariffs on Canada as trade deals remain limited. The August 1 deadline for tariffs is approaching and Canada has not made much of a move so far.
🕯Technical Analysis
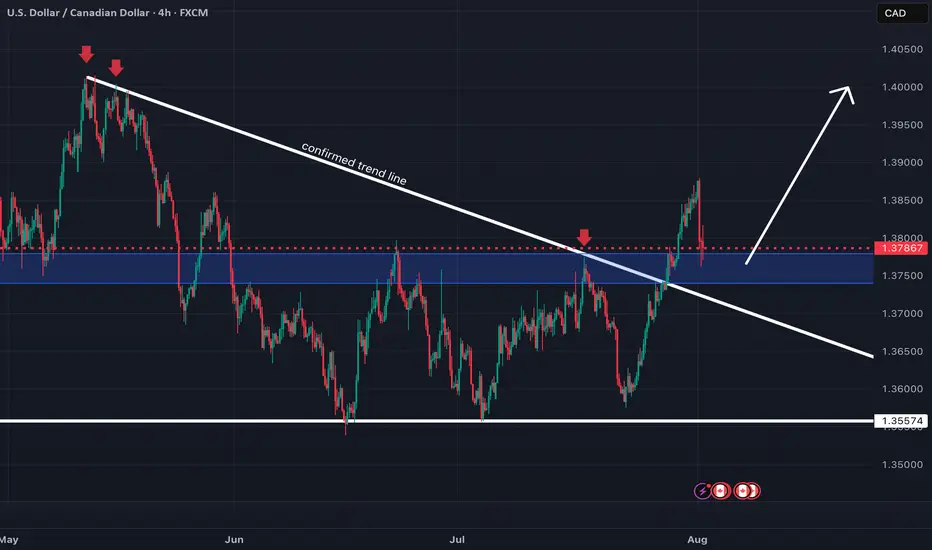
USDCAD continues to rally towards the 1.4000 resistance zone. A recovery of the pair to 1.365 is a good momentum for USDCAD to break the trendline and break 1.37700. The trading strategy for next week is mainly to look for BUY points when there is a recovery of the wave structure. If the important support of the week 1.357 is broken, the uptrend will reverse.
📈📉Trading Signals
BUY USDCAD 1.365-1.363 Stoploss 1.360
BUY Break out 1.37700

Buy usdcadWe have seen how price create a reversal pattern Wich is triple bottom advisable we are to wait for breaking of the above resistant (and retest) before buying
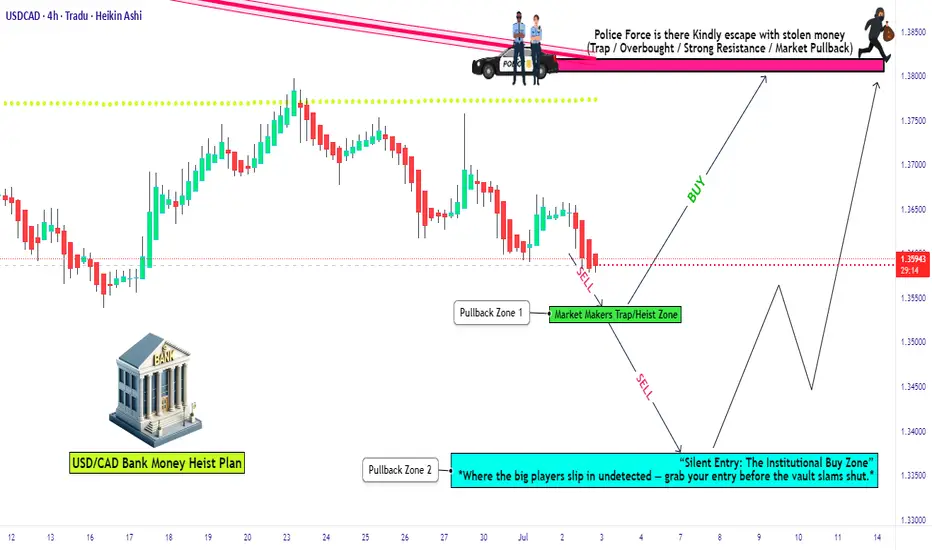
USD/CAD Institutional Buy Zone – Thief Trading Alert!🔥 USD/CAD "LOONIE BANK HEIST" 🔥 – THIEF TRADING STYLE (BULLISH SNIPER PLAN)
💸 ATTENTION: Market Robbers & Profit Pirates!
"Steal Like a Pro – Escape Before the Cops Arrive!"
🎯 MASTER TRADE PLAN (Based on Thief Trading Tactics):
Entry Zone (Pullback Heist):
📌 Pullback-1: Market Maker Trap Zone (1.35400+) – Wait for retest!
📌 Pullback-2: Institutional Buy Zone (1.33500+) – Confirm bullish momentum!
"Patience = Perfect Heist Timing. Don’t rush—ambush the trend!"
🎯 Profit Target: 1.38100 (or escape earlier if momentum fades).
🛑 Stop Loss (Escape Route): Nearest 4H Swing Low (wick/close) – Adjust based on risk & lot size!
🚨 SCALPERS’ WARNING:
"Only snipe LONG! Big pockets? Strike now. Small stack? Join swing robbers & trail your SL!"
📉 WHY THIS HEIST? (Bullish Triggers):
Technical + Fundamental alignment (COT, Macro, Sentiment).
Overbought but institutional demand holding strong.
"Bears are trapped—time to rob their stops!"
⚠️ CRITICAL ALERT:
News = Volatility = Police Ambush!
Avoid new trades during high-impact news.
Trailing SL = Your Getaway Car! Lock profits before reversals.
💥 BOOST THIS HEIST!
"Hit 👍, 🔔 Follow, and 🚀 Boost to fuel our next robbery! Let’s drain the banks together!"
🔮 NEXT HEIST COMING SOON… Stay tuned, partner! 🎭💰
USDCAD – Bullish OutlookThe US Dollar continues to show strength against the Canadian Dollar. Price closed firmly at 1.3700, signaling strong bullish momentum and potential continuation.
📈 Trade Idea: Long USDCAD
🔹 Entry: 1.3700
🔹 Targets:
First Target: 1.3800
Second Target: 1.3900
Extended Target: 1.4000+
Strong USD fundamentals, coupled with technical strength on higher timeframes, support further upside in this pair. Watching for bullish follow-through and potential breakout above recent resistance.

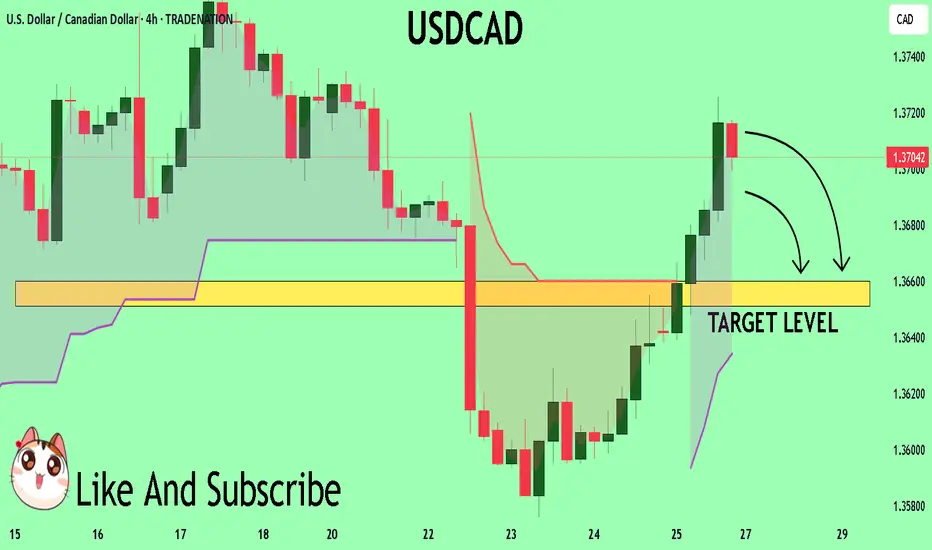
USDCAD Buyers In Panic! SELL!
My dear subscribers,
This is my opinion on the USDCAD next move:
The instrument tests an important psychological level 1.3704
Bias - Bearish
Technical Indicators: Supper Trend gives a precise Bearish signal, while Pivot Point HL predicts price changes and potential reversals in the market.
Target - 1.3660
About Used Indicators:
On the subsequent day, trading above the pivot point is thought to indicate ongoing bullish sentiment, while trading below the pivot point indicates bearish sentiment.
Disclosure: I am part of Trade Nation's Influencer program and receive a monthly fee for using their TradingView charts in my analysis.
———————————
WISH YOU ALL LUCK