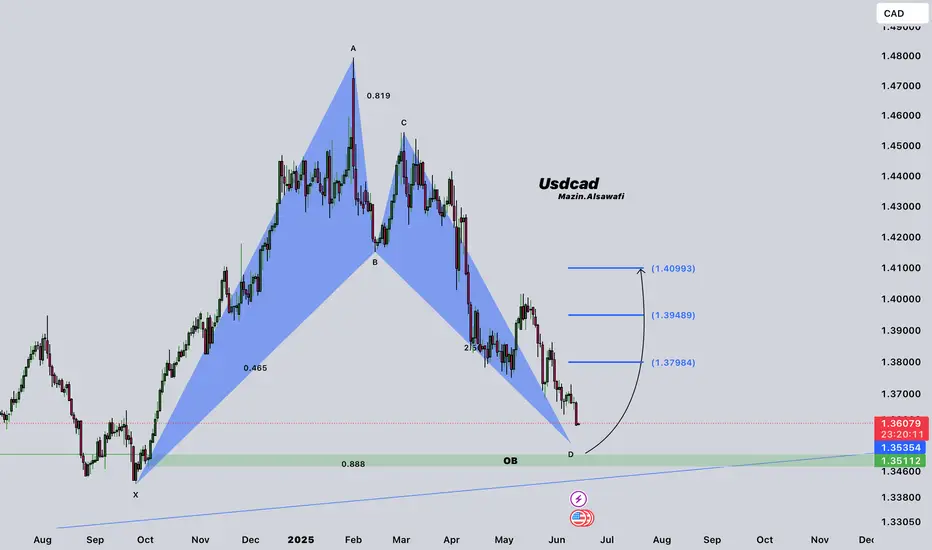
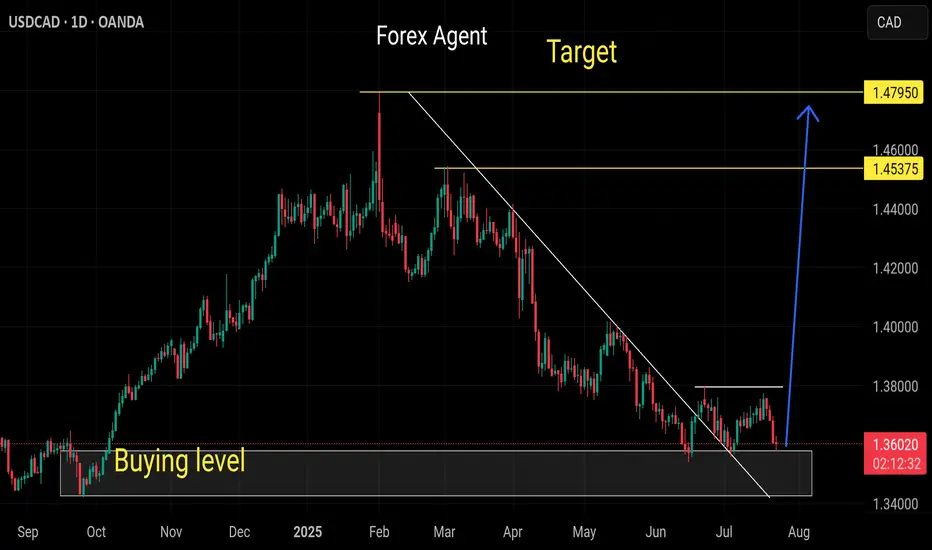
USDCAD analysis 1day frame We have bat 🦇 pattern and also ob ..I expect from this area 1.35114-1.34500 go buy for long to the targets in the chart
CADUSD trade ideas
USDCAD Wave Analysis – 25 July 2025
- USDCAD rising inside sideways price range inside
- Likely to reach resistance level 1.3800
USDCAD currency pair recently reversed from the key support level 1.3575 (which is the lower boundary of the sideways price range inside which the price has been trading from June).
The upward reversal from the support level 1.3575 created the daily Japanese candlesticks reversal pattern Morning Star.
USDCAD currency pair can be expected to rise to the next resistance level 1.3800 (upper border of this sideways price range, top of wave (2)).

USDCAD SELLUSD/CAD rallies to 1.3680 as the market focuses on a hawkish Fed
The US Dollar extends its recovery for the second consecutive day, supported by strong US data. Upbeat US business activity and Jobless Claims support the Fed's "wait and see" rhetoric. In Canada, the weak Retail Sales data keep hopes for a BoC rate cut alive.
The year will be politically marked by Trump’s return to the White House. A Republican government is seen as positive for financial markets, but Trump’s pledge to cut taxes and impose tariffs on foreign goods and services may introduce uncertainty to both the political and economic landscape.
Canada’s political crisis peaked in late 2024 with a no-confidence vote against Prime Minister Justin Trudeau, leading to snap elections and a weakened Liberal minority government. Policy uncertainty and economic challenges dominate 2025’s outlook, raising concerns over market stability and investor confidence.
The BoC is set to continue easing interest rates through 2025, at least at a faster pace than the Fed is expected to, which could apply pressure on CAD’s already-rising rate differential.
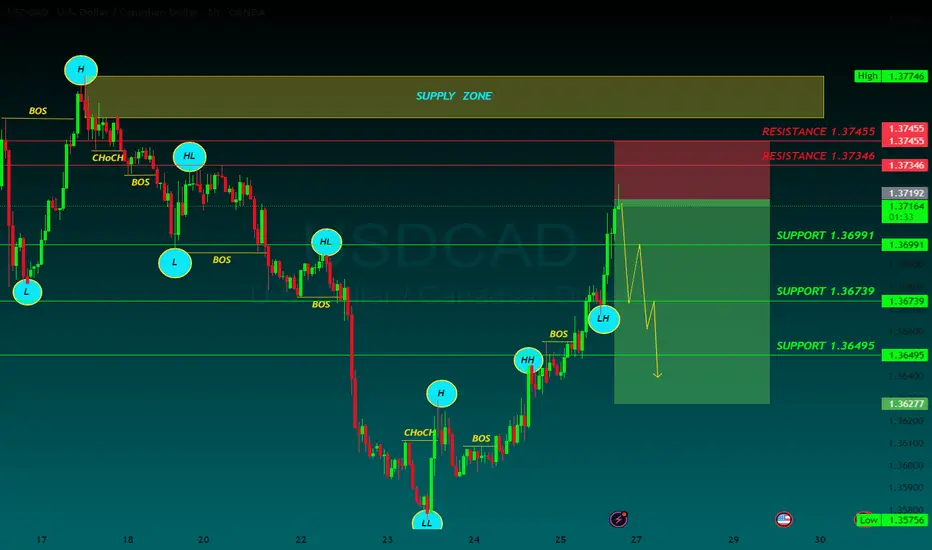
SUPPORT 1.36991
SUPPORT 1.36739
SUPPORT 1.36495
RESISTANCE 1.37346
RESISTANCE 1.37455
Long USDCADUCAD has showed good candlestick formation, rejects on trendline. I am going to buy this, targeting to fibo 4.23.

usdcad swing trade long3 bull points
Rsi div
Trend reversal
Double bottom at 1D timeframe
RRR 1:2
hold for more longer but with proper risk management..
USDCAD, we can see a pullbackUSDCAD is in Range in Daily, and daily range is enough to capture 200-250 pips. So keeping that in mind we can plan a buy trade USDCAD from the Daily Demand Area 1.3500 - 1.3550 Area.
And 1H Trend is Bearish So we can also look for the Sell from the 1.3650 aka Resistance Zone (4H), but after this selling move it is risky to sell at current price i.e. 1.3580 So wait for fib area or look for buys only from Demand Zone.
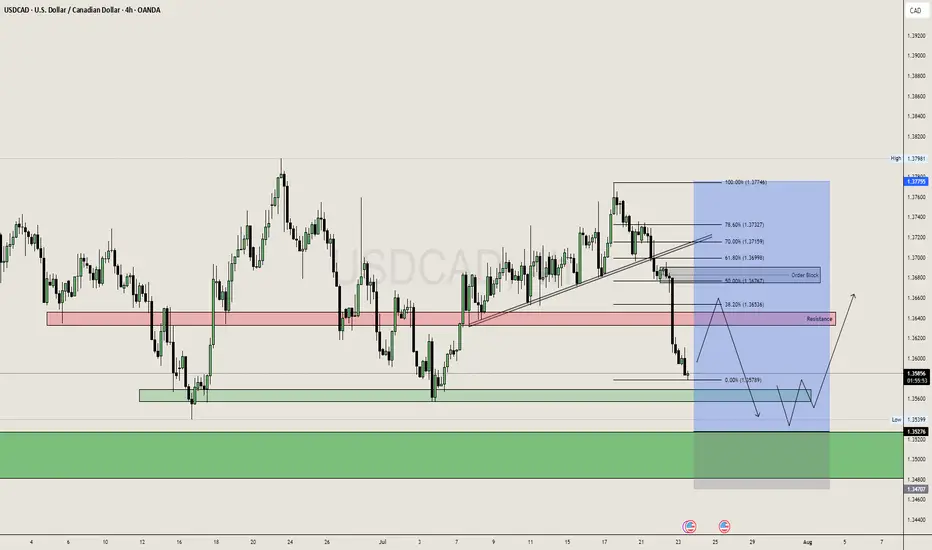
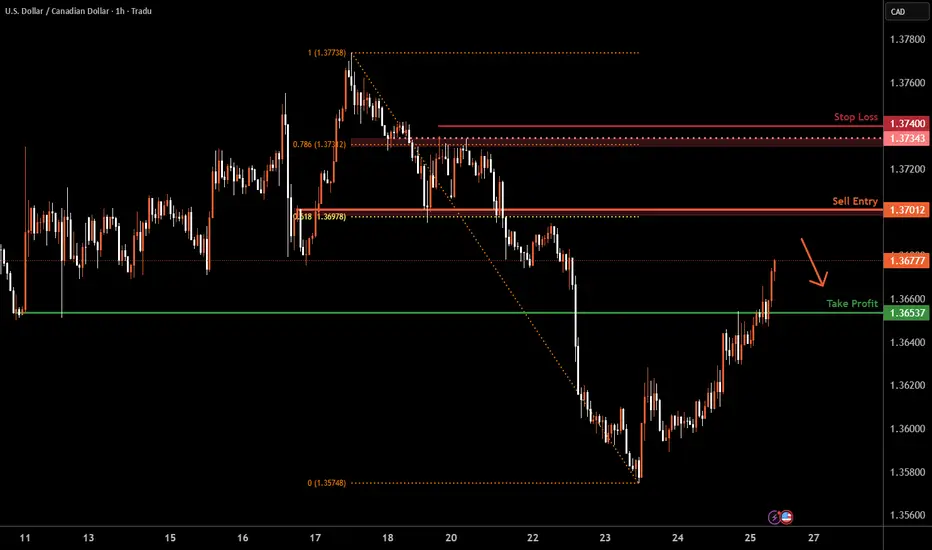
SELL USDCADIn todays session we are monitoring USDCAD for selling opportunities, we have our first entry at 1.36719 and our target is 1.36080 our stop is above 1.3700 , use proper risk management and risk what you can afford. Cheers fam.

USD/CAD H4 | Potential bearish reversalUSD/CAD is rising towards an overlap resistance and could potentially reverse off this level to drop lower.
Sell entry is at 1.3701 which is an overlap resistance that aligns with the 61.8% Fibonacci retracement.
Stop loss is at 1.3740 which is a level that sits above the 78.6% Fibonacci retracement and an overlap resistance.
Take profit is at 1.3653 which is a pullback support.
High Risk Investment Warning
Trading Forex/CFDs on margin carries a high level of risk and may not be suitable for all investors. Leverage can work against you.
Stratos Markets Limited (tradu.com ):
CFDs are complex instruments and come with a high risk of losing money rapidly due to leverage. 66% of retail investor accounts lose money when trading CFDs with this provider. You should consider whether you understand how CFDs work and whether you can afford to take the high risk of losing your money.
Stratos Europe Ltd (tradu.com ):
CFDs are complex instruments and come with a high risk of losing money rapidly due to leverage. 66% of retail investor accounts lose money when trading CFDs with this provider. You should consider whether you understand how CFDs work and whether you can afford to take the high risk of losing your money.
Stratos Global LLC (tradu.com ):
Losses can exceed deposits.
Please be advised that the information presented on TradingView is provided to Tradu (‘Company’, ‘we’) by a third-party provider (‘TFA Global Pte Ltd’). Please be reminded that you are solely responsible for the trading decisions on your account. There is a very high degree of risk involved in trading. Any information and/or content is intended entirely for research, educational and informational purposes only and does not constitute investment or consultation advice or investment strategy. The information is not tailored to the investment needs of any specific person and therefore does not involve a consideration of any of the investment objectives, financial situation or needs of any viewer that may receive it. Kindly also note that past performance is not a reliable indicator of future results. Actual results may differ materially from those anticipated in forward-looking or past performance statements. We assume no liability as to the accuracy or completeness of any of the information and/or content provided herein and the Company cannot be held responsible for any omission, mistake nor for any loss or damage including without limitation to any loss of profit which may arise from reliance on any information supplied by TFA Global Pte Ltd.
The speaker(s) is neither an employee, agent nor representative of Tradu and is therefore acting independently. The opinions given are their own, constitute general market commentary, and do not constitute the opinion or advice of Tradu or any form of personal or investment advice. Tradu neither endorses nor guarantees offerings of third-party speakers, nor is Tradu responsible for the content, veracity or opinions of third-party speakers, presenters or participants.

USD/CAD(20250725)Today's AnalysisMarket news:
The European Central Bank announced that it would maintain the three key interest rates unchanged, reiterated data dependence, warned that the external environment is highly uncertain, and President Lagarde did not rule out the possibility of future rate hikes. Traders reduced their bets on ECB rate cuts.
Technical analysis:
Today's buying and selling boundaries:
1.3626
Support and resistance levels:
1.3689
1.3666
1.3651
1.3602
1.3587
1.3563
Trading strategy:
If the price breaks through 1.3651, consider buying, with the first target price of 1.3666
If the price breaks through 1.3626, consider selling, with the first target price of 1.3602
USDCAD Break the trendline resistance USDCAD has brokend the trendline resistance is likely to to go next resistance as shown in the chart. The set up is valid till the uptrend trendline is respected by the price.
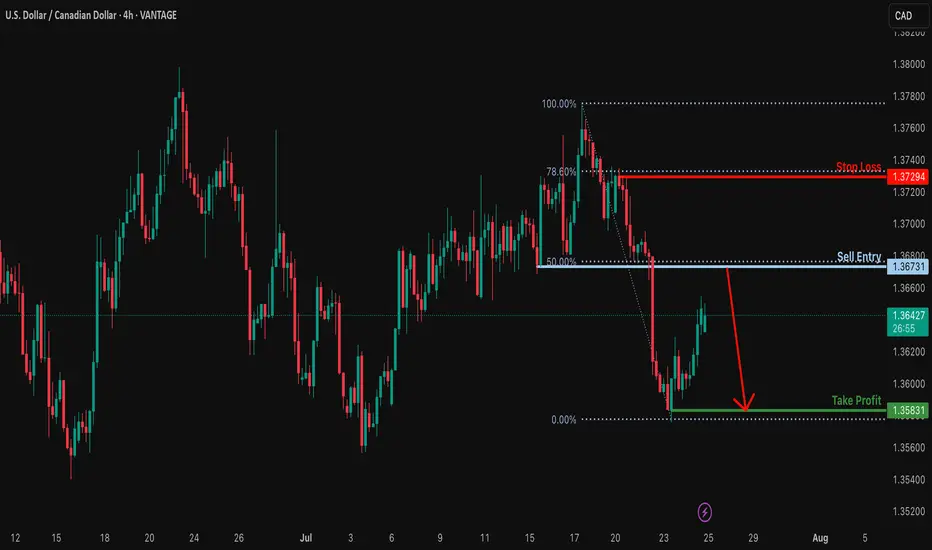
Heading into 50% Fibonacci resistance?USD/CAD is rising towards the resistance level, which serves as a pullback resistance that aligns with the 50% Fibonacci retracement and could reverse from this level to our take-profit target.
Entry: 1.3673
Why we like it:
There is a pullback resistance that lines up with the 50% Fibonacci retracement.
Stop loss: 1.3729
Why we like it:
There is a pullback resistance that lines up with the 78.6% Fibonacci retracement.
Take profit: 1.3583
Why we like it:
There is a swing low support.
Enjoying your TradingView experience? Review us!
Please be advised that the information presented on TradingView is provided to Vantage (‘Vantage Global Limited’, ‘we’) by a third-party provider (‘Everest Fortune Group’). Please be reminded that you are solely responsible for the trading decisions on your account. There is a very high degree of risk involved in trading. Any information and/or content is intended entirely for research, educational and informational purposes only and does not constitute investment or consultation advice or investment strategy. The information is not tailored to the investment needs of any specific person and therefore does not involve a consideration of any of the investment objectives, financial situation or needs of any viewer that may receive it. Kindly also note that past performance is not a reliable indicator of future results. Actual results may differ materially from those anticipated in forward-looking or past performance statements. We assume no liability as to the accuracy or completeness of any of the information and/or content provided herein and the Company cannot be held responsible for any omission, mistake nor for any loss or damage including without limitation to any loss of profit which may arise from reliance on any information supplied by Everest Fortune Group.
USDCAD...potential further upside expectedHey Hey TradingView fam! Hope you guys are doing absolutely amazing today...hope your trading weeks are off to an amazing start and hopefully this post can be helpful for the remainder of this week for you! Let's dive in!
OK so for USDCAD this is a post to piggyback off of the previous swing position post I did for USDCAD longs a couple weeks ago...those positions played out well and now wanted to revisit this currency pair because it is giving another potential opportunity to mover to the upside and so wanted to break down what I see here. Let's make it simple
1. Weekly demand zone
2. Strong momentum from buyers on Daily timeframe
3. Higher low formed WITH STRENGTH (big clue of interest)
4. Fib extension lining up with daily supply zone
5. Higher low forming would then now expect a new higher high to form
OK hope that made sense! I want to make these posts as simple as possible so hopefully this added some value for you guys!
Please boost and follow my page for more highly accurate setups! Cheers!

Is USDCAD staring at a new low for 2025?FX_IDC:USDCAD ready for a lower low? Let's see.
MARKETSCOM:USDCAD
Let us know what you think in the comments below.
Thank you.
75.2% of retail investor accounts lose money when trading CFDs with this provider. You should consider whether you understand how CFDs work and whether you can afford to take the high risk of losing your money. Past performance is not necessarily indicative of future results. The value of investments may fall as well as rise and the investor may not get back the amount initially invested. This content is not intended for nor applicable to residents of the UK. Cryptocurrency CFDs and spread bets are restricted in the UK for all retail clients.

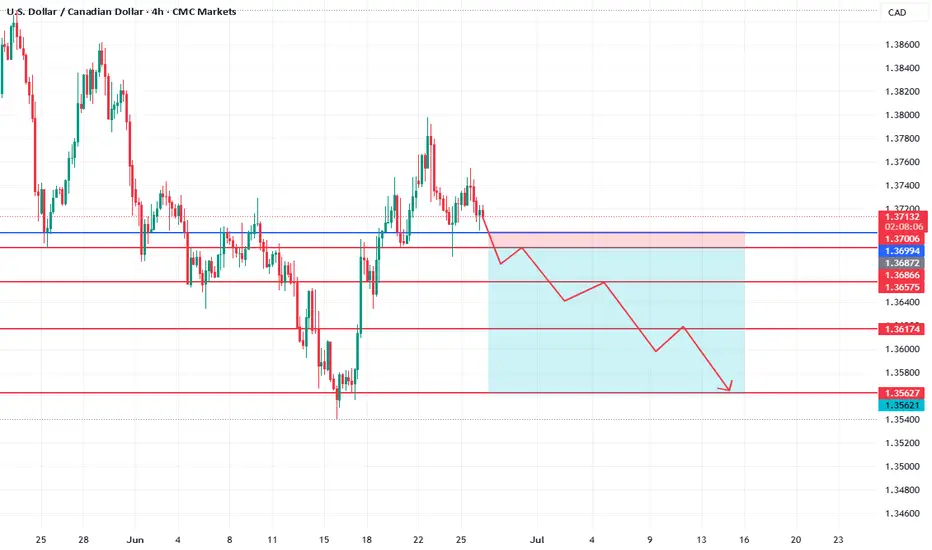
USDCAD Bearish Continuation Setup📉 USDCAD Bearish Continuation Setup
🗓 Published: June 26, 2025
🕒 Timeframes: 4H & 1D
📍 Instrument: USD/CAD
📊 Technical Bias: Bearish
🧠 Analysis Summary
USDCAD has recently rejected from the 1.3713–1.3700 resistance zone (highlighted in red/pink box) after a corrective bullish move. This area served as a strong supply zone where price was previously rejected.
The price is now forming a clear lower high, and the recent failure to break above 1.3713 confirms short-term bearish control. The structure on both the 4H and Daily charts supports a continuation move lower, aligning with a potential bearish swing leg developing.
📍 Key Levels
Level Description
1.3713 Major resistance (top of supply zone)
1.3700 Round number & resistance confirmation
1.3687 Minor S/R flip
1.3666 Short-term support
1.3657 Next target support
1.3617 Key swing low
1.3562 Final target (major support zone)
🔁 Trade Setup
Entry Zone:
🔴 Enter on a 15M/1H retracement to 1.3700–1.3713 (ideal R:R)
🔄 or market sell confirmation below 1.3686
Take Profit Targets:
✅ TP1: 1.3657
✅ TP2: 1.3617
✅ TP3: 1.3562
Stop Loss:
❌ SL above 1.3730
📦 Confluence Factors
Daily & 4H trend turning bearish
Bearish engulfing rejection at previous supply
Lower high structure building up
No major demand zone until 1.356x
⚠️ Risk Note
Wait for confirmation before entering, especially on lower timeframes (1H/15M), such as bearish engulfing candles or break–retest of 1.3686 level. Avoid trading if price breaks above 1.3730 – structure would be invalidated.
💬 Let me know in the comments how you’re trading USDCAD today, and don’t forget to set alerts at key zones!
📉 Good luck and manage risk wisely.
Rendon1
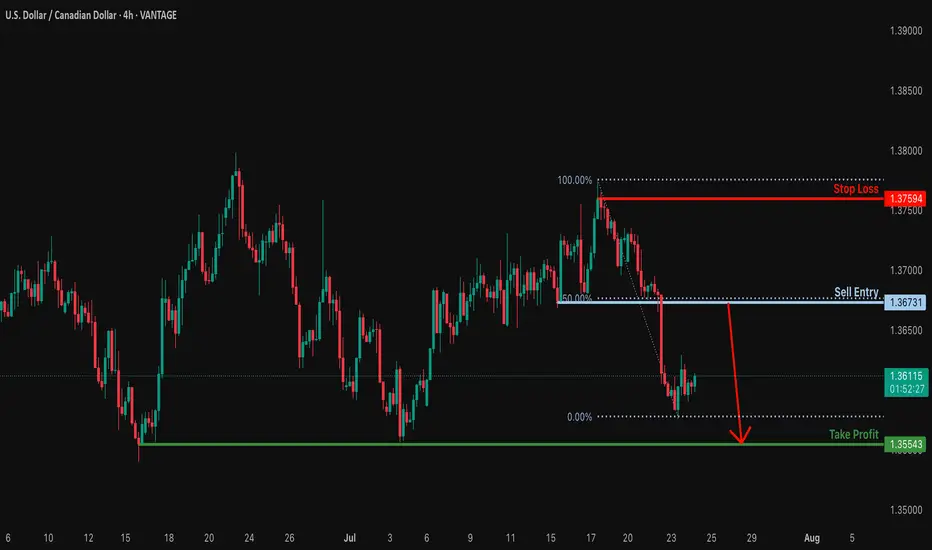
Heading into 50% Fibonacci resistance?USD/CAD is rising towards the resistance which is a pullback reistance that lines up with the 50% Fibonacci retracement and could reverse from this level to our take profit.
Entry: 1.3673
Why we like it:
There is a pullback resistance that lines up with the 50% Fibonacci retracement.
Stop loss: 1.3759
Why we like it:
There is a swing high resistance.
Take profit: 1.3554
Why we like it:
There is a multi swing low support.
Enjoying your TradingView experience? Review us!
Please be advised that the information presented on TradingView is provided to Vantage (‘Vantage Global Limited’, ‘we’) by a third-party provider (‘Everest Fortune Group’). Please be reminded that you are solely responsible for the trading decisions on your account. There is a very high degree of risk involved in trading. Any information and/or content is intended entirely for research, educational and informational purposes only and does not constitute investment or consultation advice or investment strategy. The information is not tailored to the investment needs of any specific person and therefore does not involve a consideration of any of the investment objectives, financial situation or needs of any viewer that may receive it. Kindly also note that past performance is not a reliable indicator of future results. Actual results may differ materially from those anticipated in forward-looking or past performance statements. We assume no liability as to the accuracy or completeness of any of the information and/or content provided herein and the Company cannot be held responsible for any omission, mistake nor for any loss or damage including without limitation to any loss of profit which may arise from reliance on any information supplied by Everest Fortune Group.
Strong buy usdcadStrong bullish wave expected from this buy zone
Wait to sweep low then buy with short time confirmation
Weekly and monthly still oversold pair

USDCAD: Long Trading Opportunity
USDCAD
- Classic bullish pattern
- Our team expects retracement
SUGGESTED TRADE:
Swing Trade
Buy USDCAD
Entry - 1.3618
Stop - 1.3586
Take - 1.3685
Our Risk - 1%
Start protection of your profits from lower levels
Disclosure: I am part of Trade Nation's Influencer program and receive a monthly fee for using their TradingView charts in my analysis.
❤️ Please, support our work with like & comment! ❤️

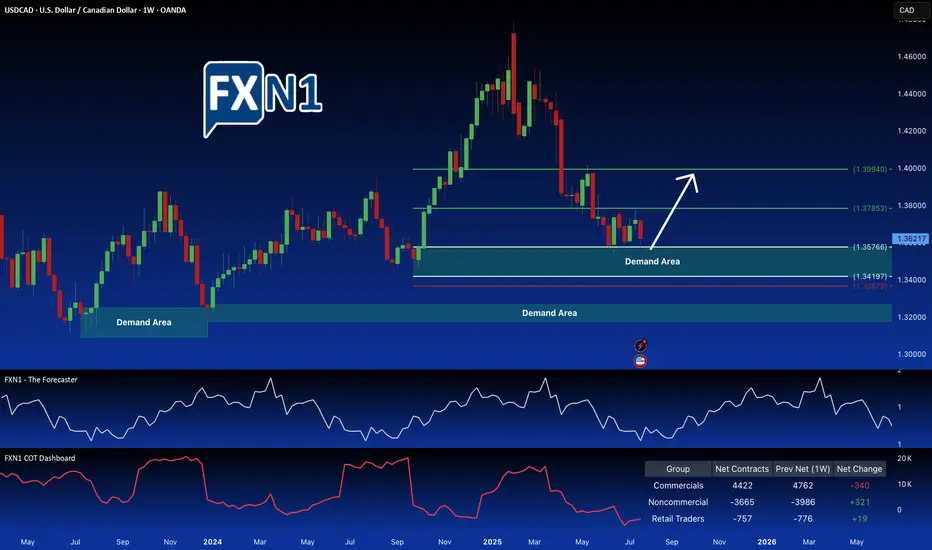
USDCAD Trade Idea: Potential for Further GainsI've initiated a long position on USDCAD at the retest of the key demand zone at 1.35766. Positive indicators support this trade: non-commercial traders are also accumulating long positions, and a notable shift is observed in the CAD futures market, with commercials moving from a bearish to a potentially bullish stance. Furthermore, seasonal trends favor a USD strengthening against the CAD. A further drop in price could present another attractive entry point at a lower demand zone.
✅ Please share your thoughts about USD/CAD in the comments section below and HIT LIKE if you appreciate my analysis. Don't forget to FOLLOW ME; you will help us a lot with this small contribution.
Buy usdcad Buy usdcad and gbpcad. You can set tp 1 at 1.37. Feel free to add Eurcad if daily candle closes as bullish on IDC chart. I'll keep you updated

USDCAD BUYUSD/CAD returns below 1.3600, with YTD lows, at 1.3540 coming into view
The US Dollar extends its decline for the fourth consecutive day, with the Canadian Dollar supported by a brighter market mood, as the trade deal between the US and Japan provided some certainty about the outlook of global trade and boosted hopes of more such deals.
In the USD/CAD 2025 Forecast, FXStreet analyst Joshua Gibson suggests uncertainty and risk-off sentiment could strengthen the US Dollar (USD) early in 2025, while the Canadian Dollar (CAD) is expected to weaken in the first quarter. However, CAD investors may reassess prospects as the year progresses, focusing on the Federal Reserve (Fed) - Bank of Canada (BoC) policy dynamics.
From a technical point of view, USD/CAD could face a technical ceiling near the 1.4400 level after the Canadian Dollar's sharp 8.5% decline in 2024 sent the pair to 56-month highs. However, technical indicators like the MACD suggest caution, as short positions may only become viable once clear sell signals emerge, likely during the first quarter.
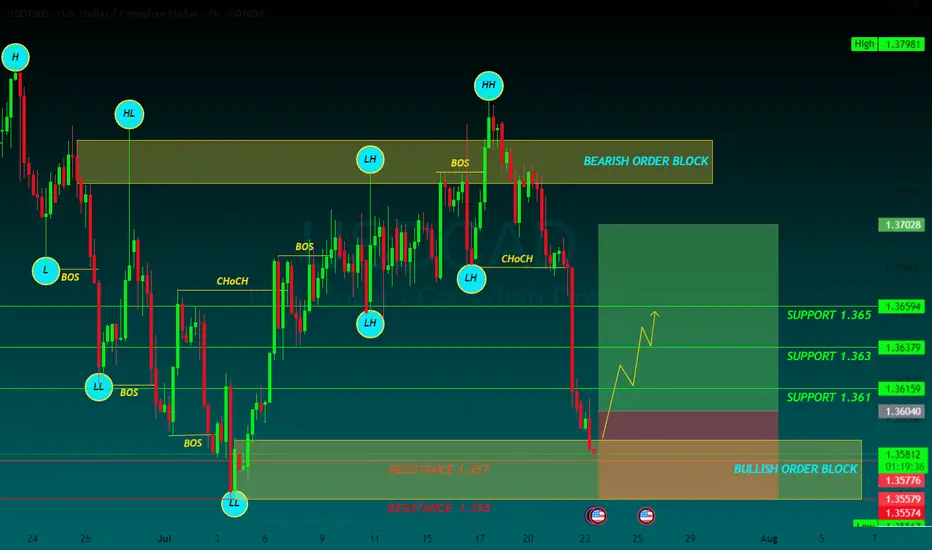
SUPPORT 1.361
SUPPORT 1.353
SUPPORT 1.361
RESISTANCE 1.357
RESISTANCE 1.355