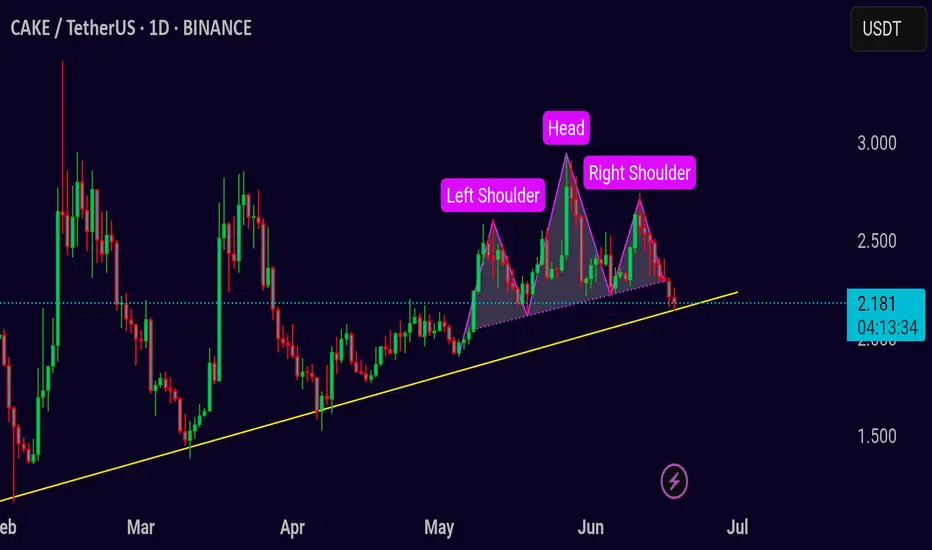
CAKE/USDT – Head & Shoulders Breakdown in Play Pair: CAKE/USDT 💱
Timeframe: 1D 📅
Pattern: Head and Shoulders Top 🧠
CAKE is developing a clear head and shoulders pattern on the daily chart, often seen as a bearish reversal setup. Price is currently testing the neckline support around 2.18, which also aligns with an ascending trendline. A breakdo
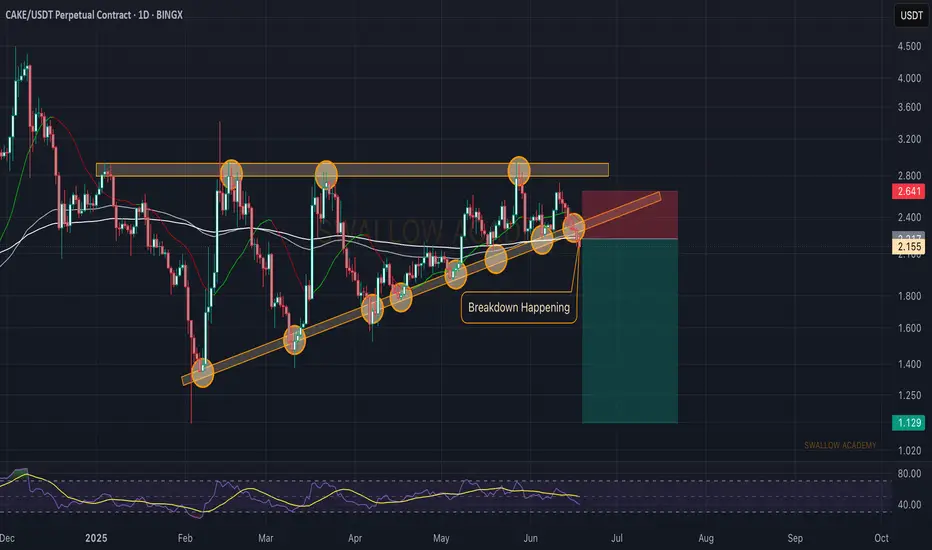
Pancake (CAKE): Breakdown From Bullish Support Trend | BEARISHWell, we had a nice ride since last time, where price reached the pressure point and now is showing downside dominance, where sellers are dominating and resulting in a breakdown from the local support trend.
We are looking for further sell-side dominance and possibly a good ride to lower zones her
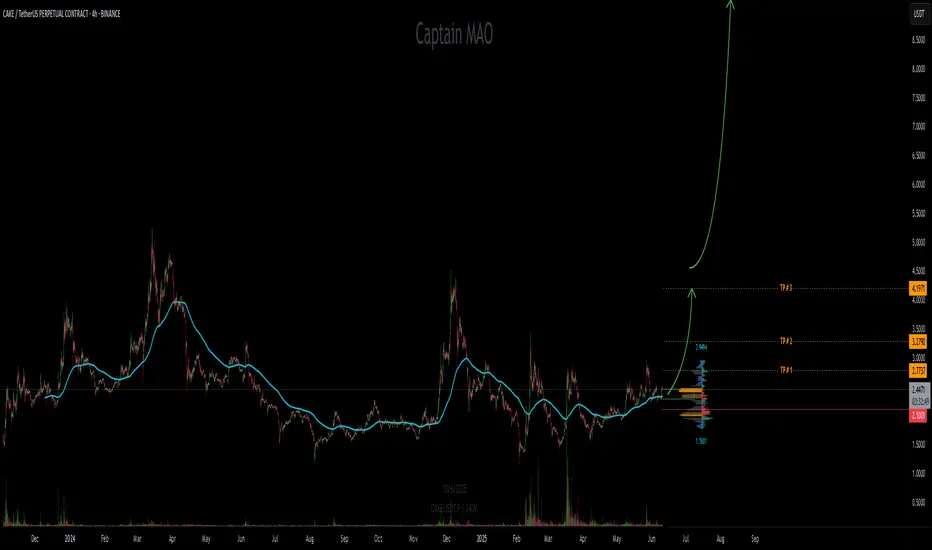
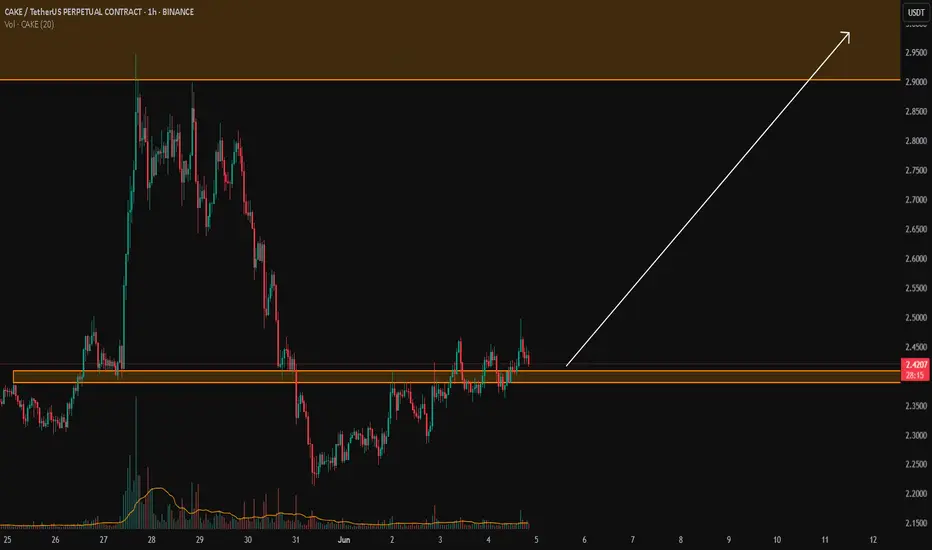
CAKE/USDT R/R:6CAKE is holding strong above the key $2.20 level. For over 550 days, it has been consolidating within a gigantic box structure — a powerful pattern indicating potential for a major breakout.
This extended accumulation phase suggests significant strength, and any sustained move above the upper bound
CAKE long "@members CAKE long up to Monday high than yearly open"
Swing long CAKE play form 200EMA 4h, PA looks like slow accumulation holding MO aiming for red boxes, trade taken 7th June
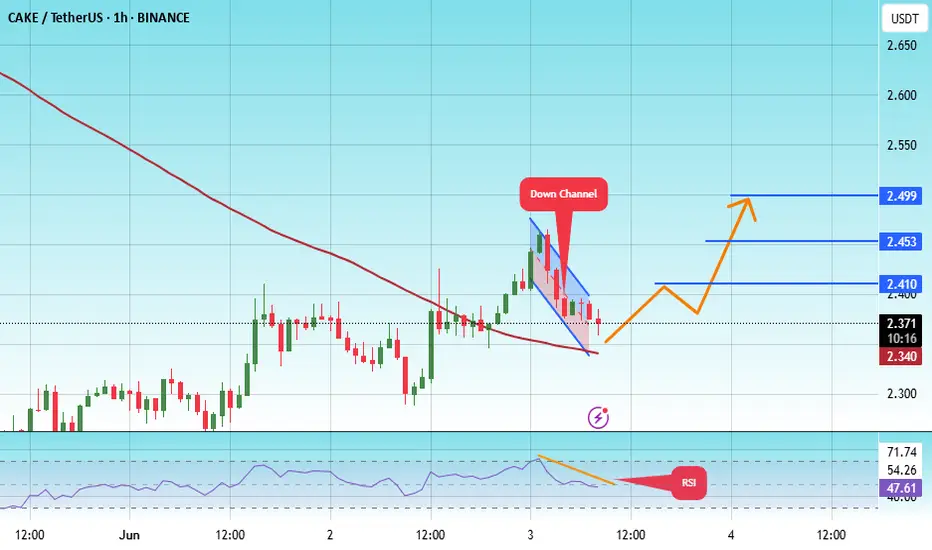
#CAKE/USDT#CAKE
The price is moving within a descending channel on the 1-hour frame and is expected to break and continue upward.
We have a trend to stabilize above the 100 moving average once again.
We have a downtrend on the RSI indicator that supports the upward move with a breakout.
We have a support
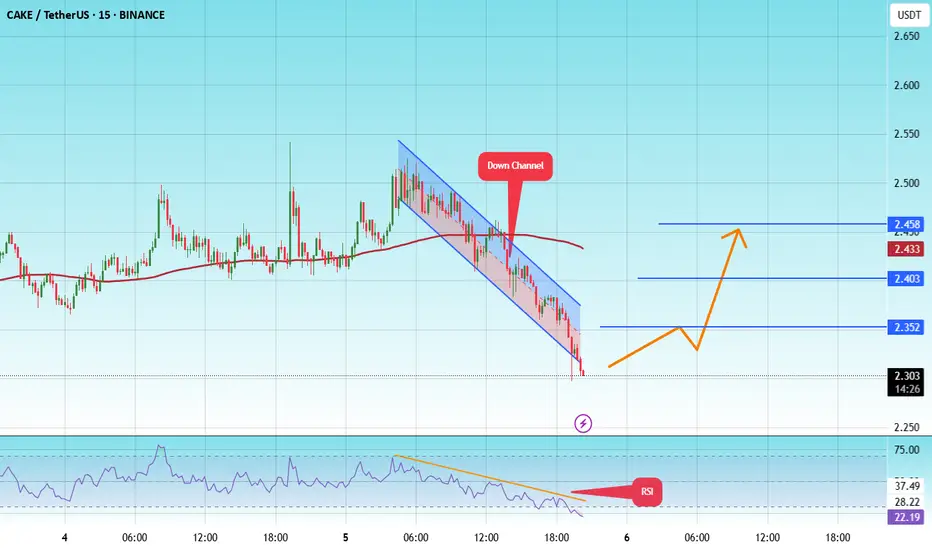
#CAKE/USDT#CAKE
The price is moving within a descending channel on the 1-hour frame, adhering well to it, and is heading towards a strong breakout and retest.
We are experiencing a rebound from the lower boundary of the descending channel, which is support at 2.35.
We are experiencing a downtrend on the RSI
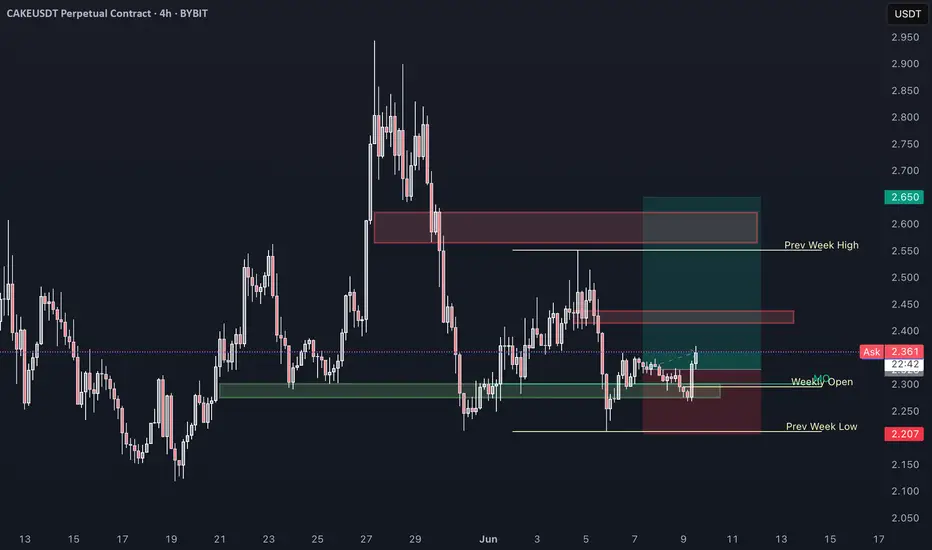
CAKE 4H Analysis: Preparing for Breakout or More Rejection?🍰 CAKEUSDT
In the 4-hour timeframe, CAKE has printed a red candle at key resistance, signaling short-term selling pressure. However, if this doesn’t lead to a deeper move down, it could indicate that overhead supply has been cleared, potentially setting the stage for an upside breakout.
---
🟢 Lon

CAKE/USDTKey Level Zone: 2.3880 - 2.4080
HMT v8.1 detected. The setup looks promising, supported by a previous upward/downward trend with increasing volume and momentum, presenting an excellent reward-to-risk opportunity.
HMT (High Momentum Trending):
HMT is based on trend, momentum, volume, and market str
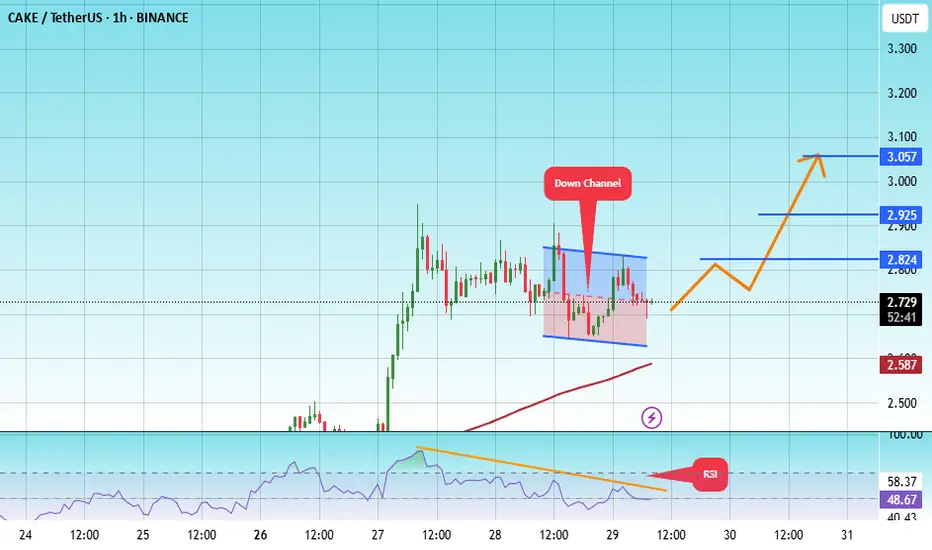
#CAKE/USDT#CAKE
The price is moving within a descending channel on the 1-hour frame, adhering well to it, and is heading for a strong breakout and retest.
We are seeing a bounce from the lower boundary of the descending channel, which is support at 2.65.
We have a downtrend on the RSI indicator that is abou
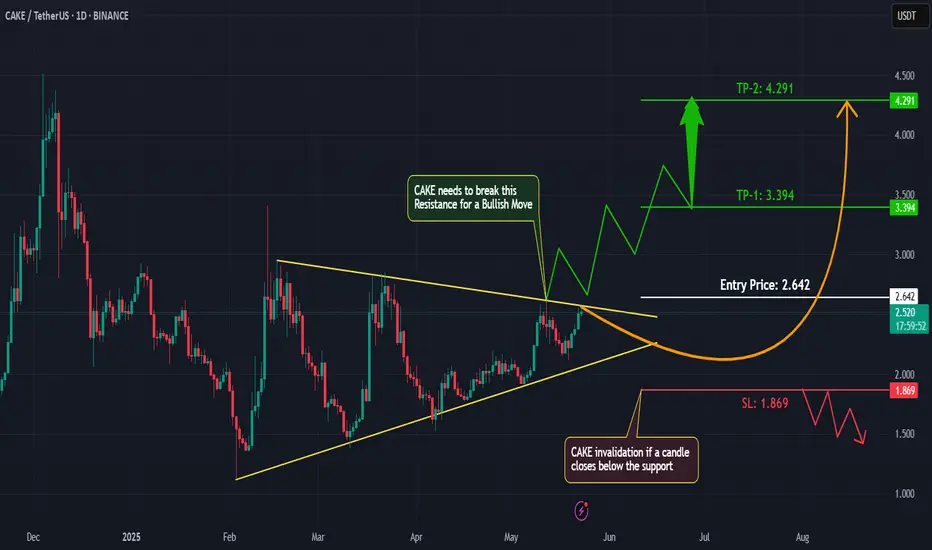
CAKE – Triangle Pattern Forming: Breakout Incoming?Hey traders! 👋
#CAKE is currently consolidating within a symmetrical triangle – a classic setup that often precedes a big move! The price action is tightening, and momentum is building. 📈
🔍 What We're Watching:
Pattern: Symmetrical Triangle
Bias: Bullish, with potential for upside breakout
Key Re
See all ideas
Summarizing what the indicators are suggesting.
Oscillators
Neutral
SellBuy
Strong sellStrong buy
Strong sellSellNeutralBuyStrong buy
Oscillators
Neutral
SellBuy
Strong sellStrong buy
Strong sellSellNeutralBuyStrong buy
Summary
Neutral
SellBuy
Strong sellStrong buy
Strong sellSellNeutralBuyStrong buy
Summary
Neutral
SellBuy
Strong sellStrong buy
Strong sellSellNeutralBuyStrong buy
Summary
Neutral
SellBuy
Strong sellStrong buy
Strong sellSellNeutralBuyStrong buy
Moving Averages
Neutral
SellBuy
Strong sellStrong buy
Strong sellSellNeutralBuyStrong buy
Moving Averages
Neutral
SellBuy
Strong sellStrong buy
Strong sellSellNeutralBuyStrong buy
Displays a symbol's price movements over previous years to identify recurring trends.
Curated watchlists where CAKEUSDT.P is featured.

Smart contracts: Make the smart decision
36 No. of Symbols
See all sparks