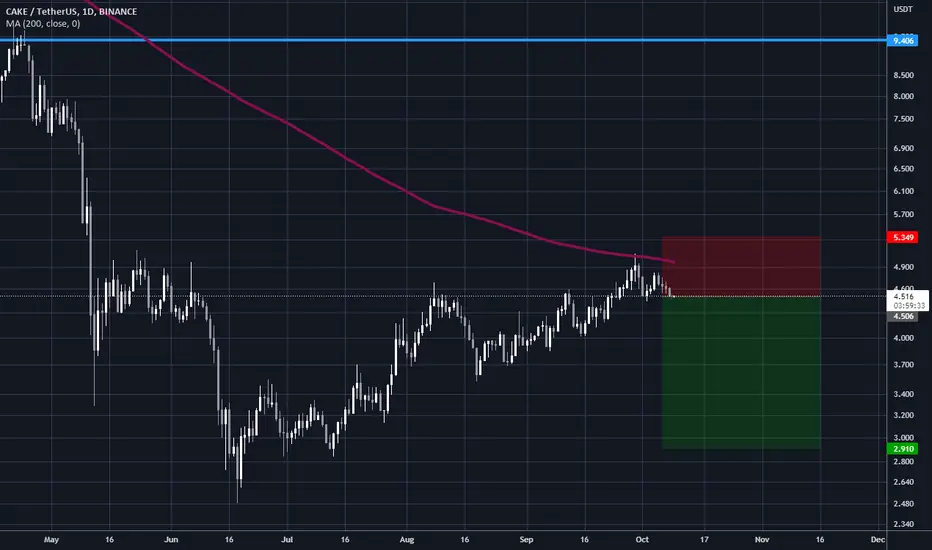
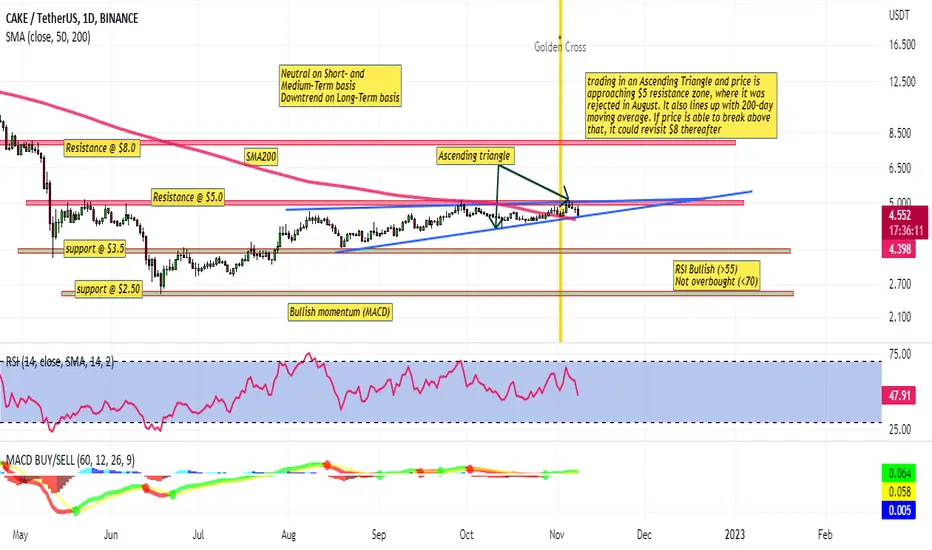
#CAKEUSDT Ascending Triangle BreakoutTrade setup: Trading in an Ascending Triangle and price is approaching $5 resistance zone, where it was rejected in August. It also lines up with 200-day moving average. If price is able to break above that, it could revisit $8 thereafter. (set a price alert).
Pattern: Ascending Triangle which is a continuation pattern (it typically breaks out in the direction of existing trend). Most traders wait for a breakout.
Trend: Uptrend across all time horizons (Short- Medium- and Long-Term).
Momentum is Bullish ( MACD Line is above MACD Signal Line and RSI is above 55).
OBV (On Balance Volume): is flat, indicating that volume on Up days is equal to volume on Down days. Hence, demand from buyers and supply from sellers are in equilibrium
Support and Resistance: Nearest Support Zone is $3.50 (previous resistance), then $2.50. The nearest Resistance Zone is $5.00, then $8.00.
CAKEUSDT.P trade ideas
CAKEUSD ❕ holds the uprend lineCAKE is trading above liquidity.
RSI chart is testing the support level (4H TF)
A bullish divergence has been formed (30m TF)
I believe that the asset may resume growth after securing above the trend line.

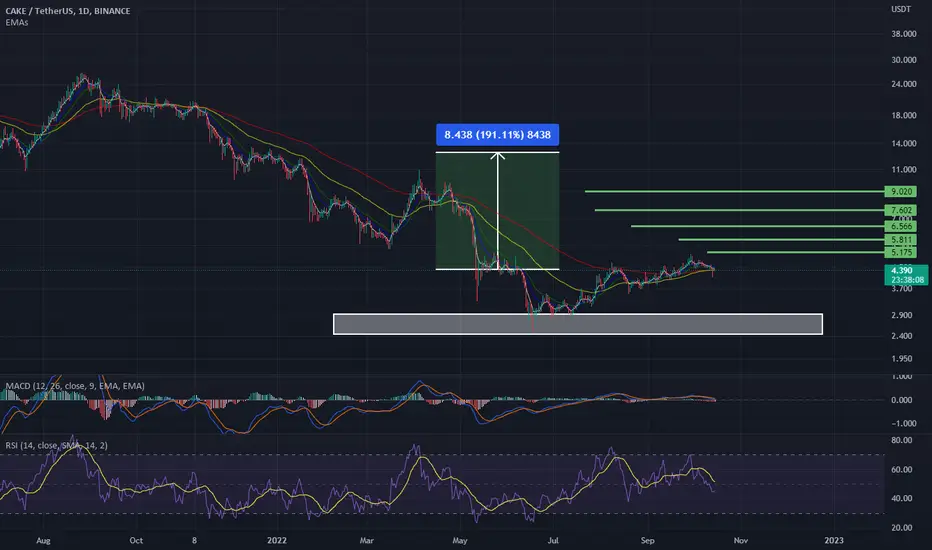
Cakeusdt DailyIf the resistance zone is broken, it is suitable for profit.
Target 10
BINANCE:CAKEUSDT
CAKE BEST SUPPLY AREAThis symbol has a great area for shorts. I don't buy or buy position and I wait if it reaches the entry zone, I will short it. Put this symbol in the watch list.

CAKEUSDTcrypto market heating up
bnb up in a big way vs btc
cake is the main dex on bsc
u do the math :)
nice simple invalidation here
way down since euphoria cycle
quality product
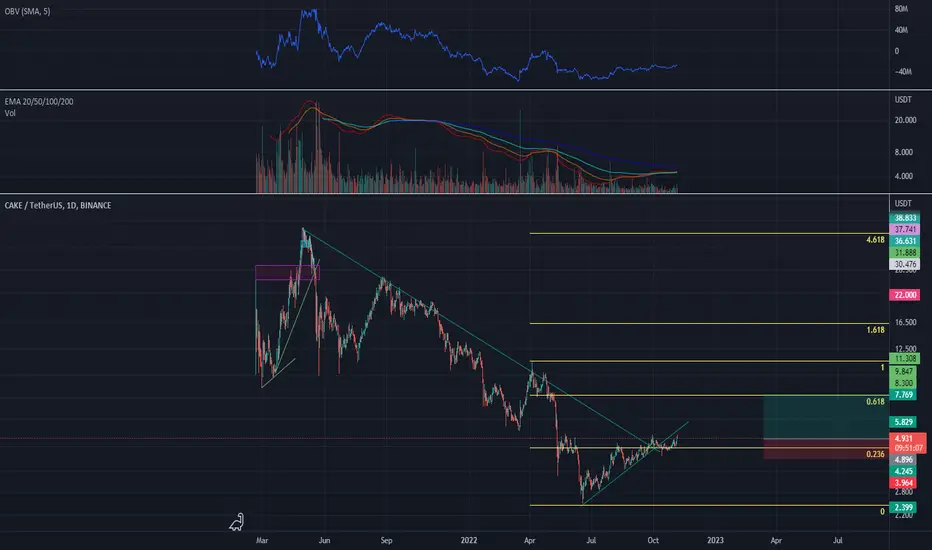
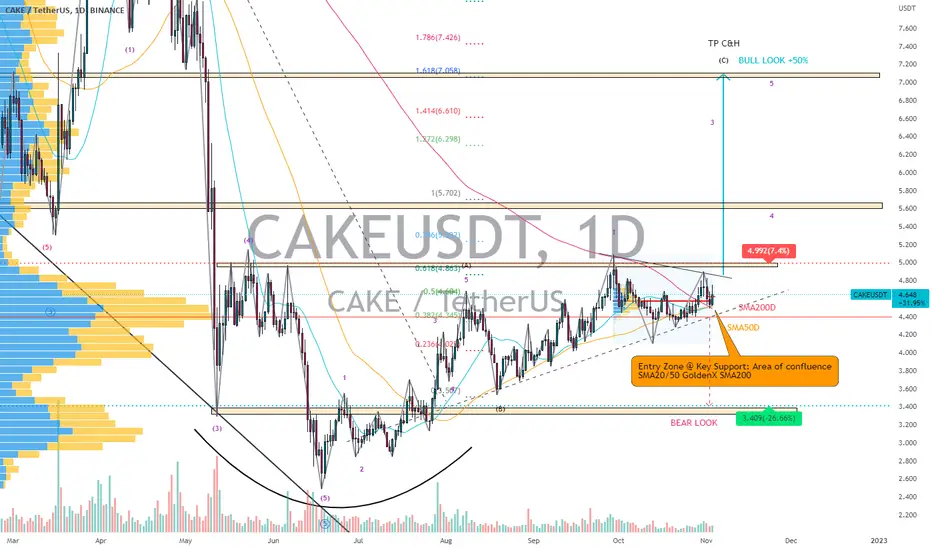
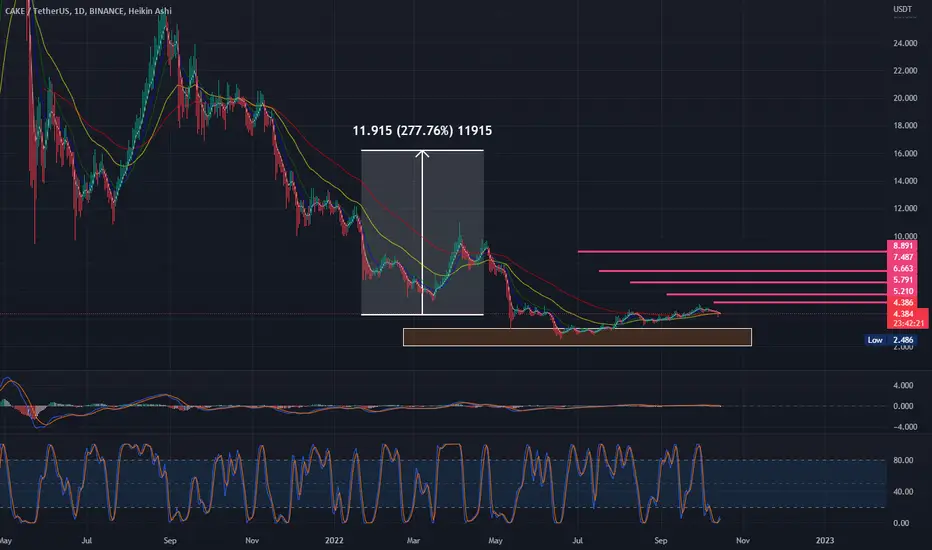
CAKEUSDT | Wave Projection | Bull Look SMA20 GoldenX 200 TP+50%Price action and chart pattern trading:
> The leading diagonal wave with a possible bullish explosive move +50% based on CUP & HANDLE pattern
> The current ENTRY ZONE is considered a strong support at the channel with SMA 20 / 50 golden cross SMA200
> Target CUP & Handle @ 1.618 Fibonacci extension from A diagonal uptrend wave $7.000++ zone.
> RSI bullish above 50 and MA line, MACD above base and signal line
> Watch out for dump & pump move
Always trade with affordable risk and respect your stoploss, nothing is 100%!
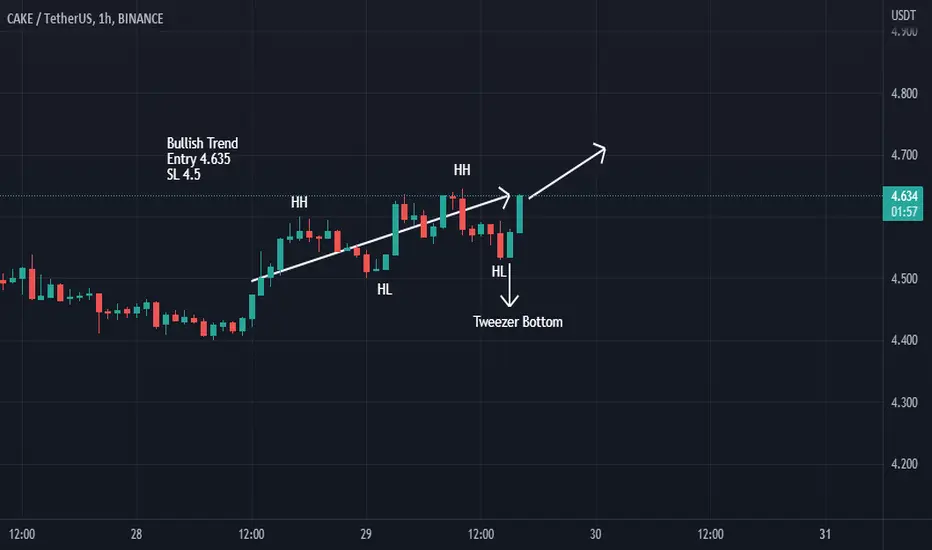
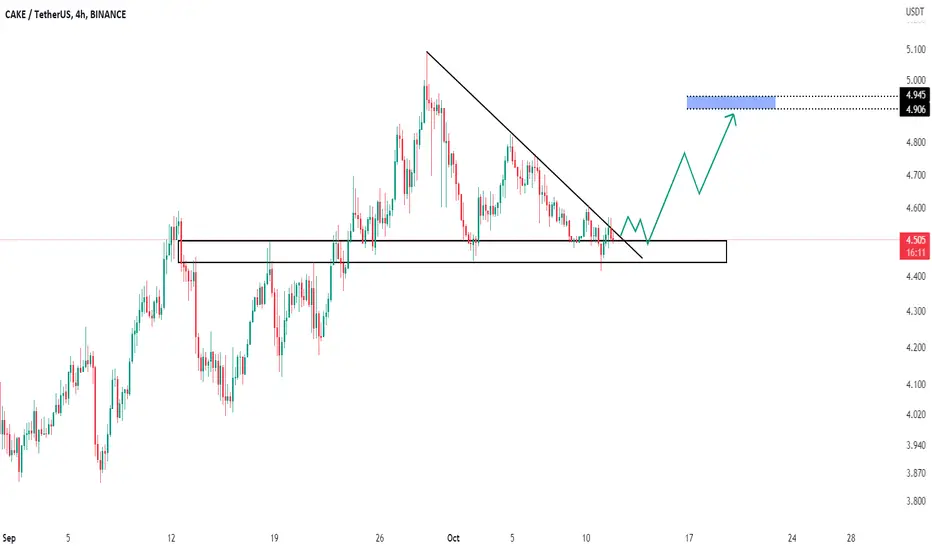
CAKE longCAKE broke trough the descending trendline. Asset broke trough the resistance level. Bullish movement to resistance level at 4.9 is expected to happen.
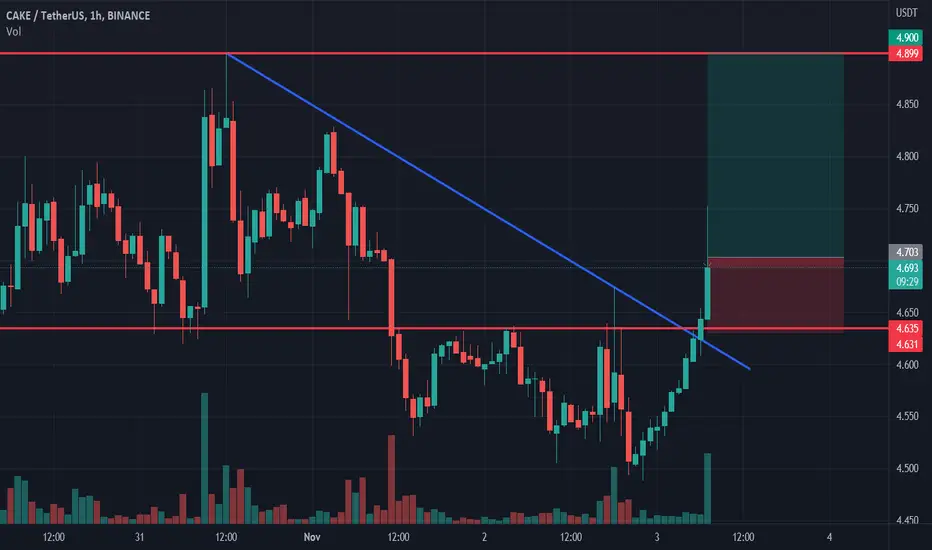
Cakebroadeninig wedge broken
bulish flag broken
now testing ascending triangle incase of this breakout expecting quick 2x profit
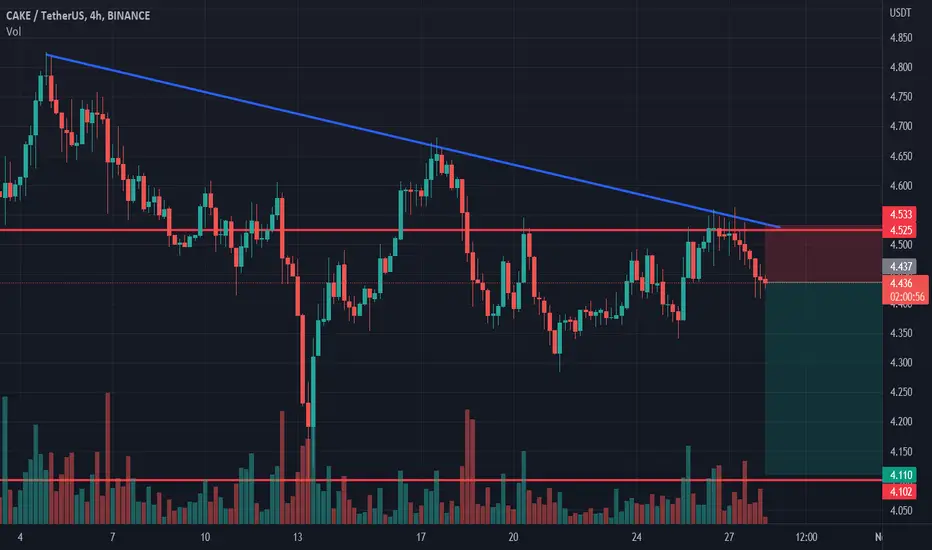
CAKE shortCAKE bounced off the resistance level. Asset bounced down off the bearish trendline. Decline to support level at 4.11 is expected to happen.
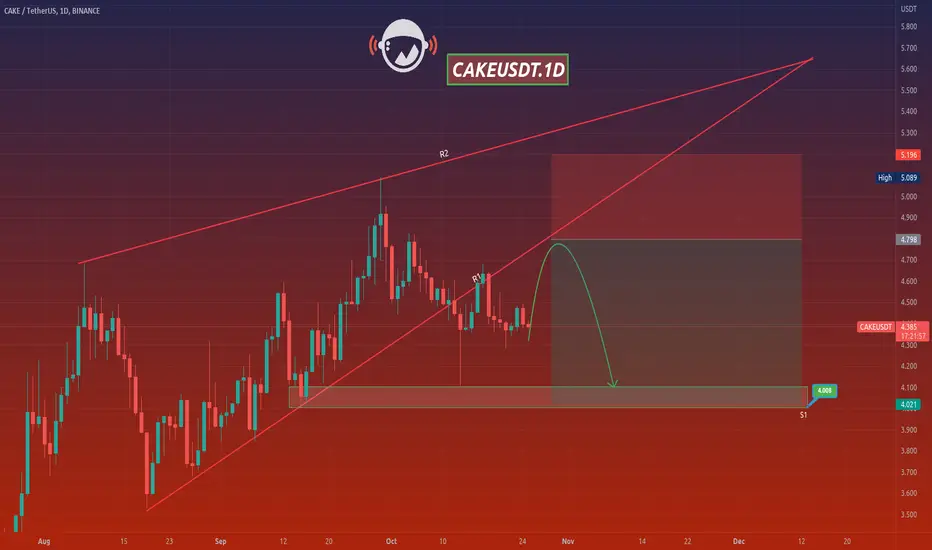
CAKEUSDTHello Crypto Lovers,
Mars Signals team wishes you high profits.
This is a one-day-time frame analysis for CAKEUSDT
As we analyzed on October 9, we expected a falling trend to happen and at the moment, this is truly happening. Here you see R2 as the resistance line that expresses the price was unable to rise at different points. R1 used to be a support line and S1 is a our support area at the bottom of this chart. At the moment, we have the price fluctuating below R1 area and our prediction would be a rise up to R1 (as it used to do in its past behavior) and then we must wait for some falling signs. Via having these confirmation candles, we will predict a decline for the price and our short position is activated. Please keep moving with us and follow our updates.
Warning: This is just a suggestion and we do not guarantee profits. We advise you to analyze the chart before opening any positions.
Wish you luck
CAKE fluctuated wildly last week!CAKE fluctuated wildly last week. The price of this currency showed a negative reaction after leaving the medium-term ascending channel by hitting the resistance of $4.8 again. The decline continued to the $4.08-$4.23 range, and this support was also met with a positive reaction. CAKE currency trend can range between these two support and resistance ranges. A resistance range in the price of 4.62 to 4.73 dollars is considered for this currency. It is a very important area to change the trend in the 4-hour time frame.
Therefore, buyers must return the price above this resistance for the price trend to rise in the 4-hour time frame. If the selling pressure in the market increases and the specified support is broken, the sharp decline in the price could continue to the range of $3.46-$3.65. As you can see, the price trend has not yet increased in the daily time frame. But the two defined blue support areas can prevent the price from falling further and returning to the bottom of the long-term descending channel. Observing signs of return and support in the lower time frames can make the trend upward for a short time.
CAKE WAS FUN BUT NOW ITS DONE! Multi Year Correction IncomingPancakeSwap CAKE/USD is showing some real weakness. The selling pressure is astronomical and its going to consolidate for a while maybe a few years if it sticks around. These types of projects will more than likely be weeded out by new regulation over the years. Unless Cake can move with the regulation coming then its more than likely going to tank. It had a nice run but many of these new crypto's and other crap coins/project are going to fizzle away in the next few years. This is not trading or financial advice just my opinion. Comment and like if you appreciate this content. Follow me for more frequent updates. Thank you

CAKEUSDT#CAKEUSDT
MACD is showing bullish
EMAs showing a bullish move
RSI is neutral
targets set at the chart
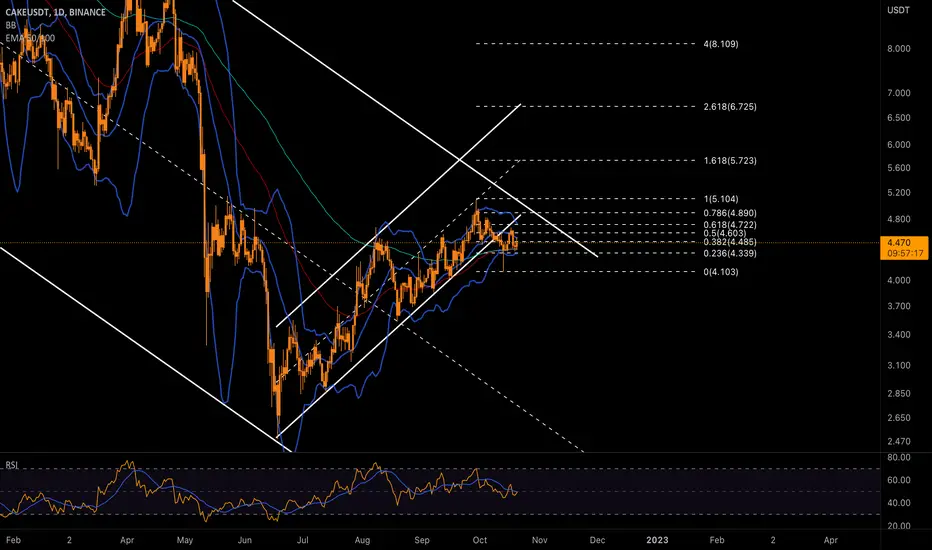
in daily chart time we have a falling wedge pattern and we are in over sold area and the price fall down from 44$ in 04/2021 i expect there will be uptrend move and bounced from the support area buy and hold it to the next targets at the chart
CAKEUSDTin daily chart time we have a falling wedge pattern and we are in over sold area and the price fall down from 44$ in 04/2021 i expect there will be uptrend move and bounced from the support area buy and hold it to the next targets at the chart
CAKEUSDT 4H ❌These analyzes are just to give a better perspective for you dear ones
Do not base on buying and selling❌
CAKE/USDT #SCALP #SIGNAL
#CAKE/USDT Looks good but if you're taking this trade so use very tight SL because the market condition isn't good, good Luck
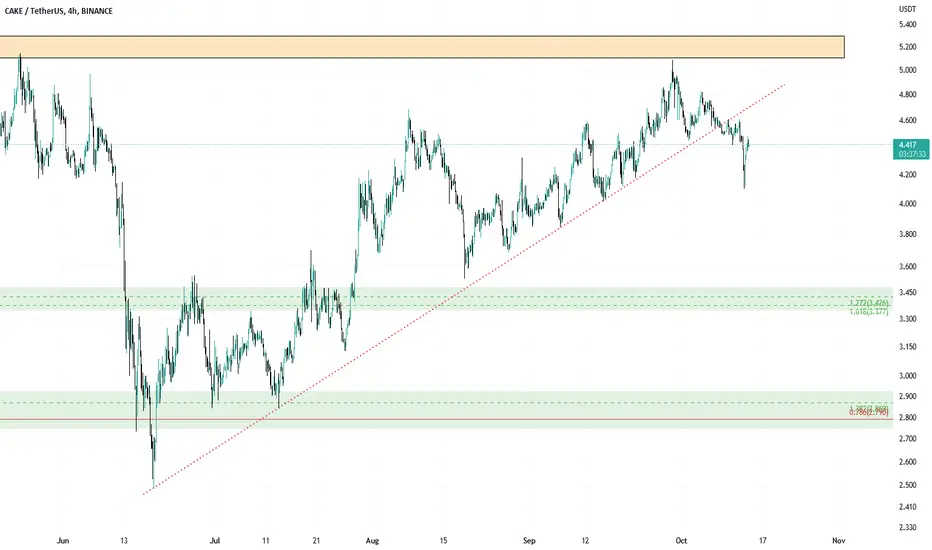
$CAKE - Pancakeswap SR Set-UpTake a look at that beautiful clean and easily defined SR level on the H4. Hold or strong reaction off the topside and im long into $4.60-$4.8. Short if underside, targets at $3.6 $2.8

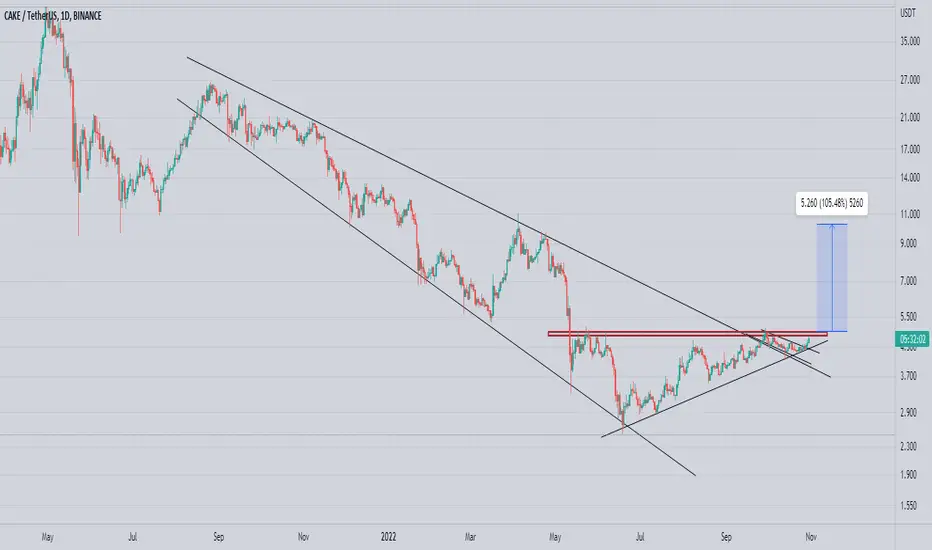
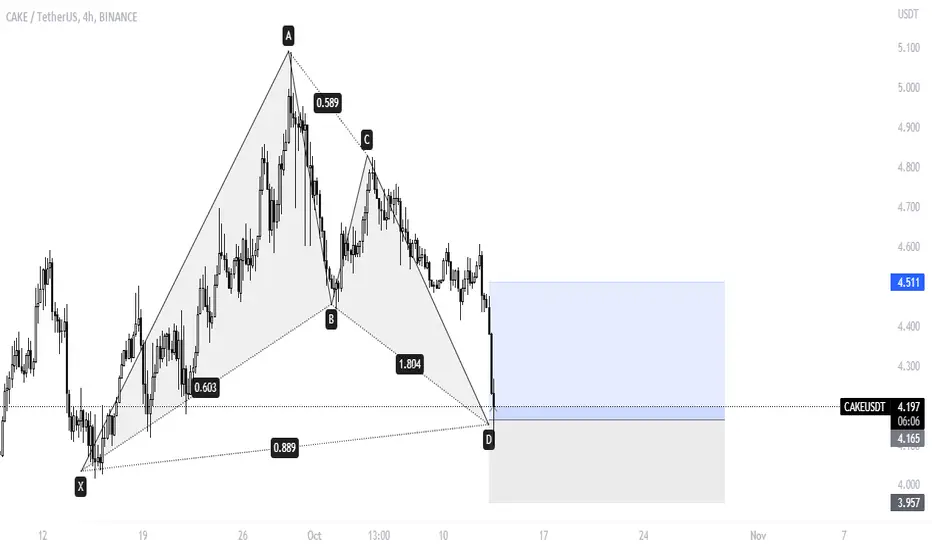
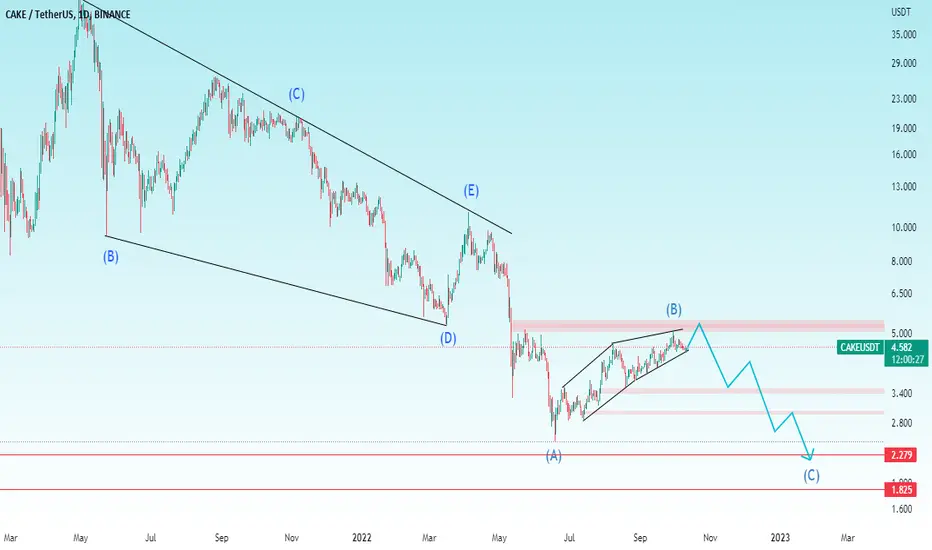
another winter is comingcake is shaping an ABC pattern that can fall 50% from 5.3 dollar with close stop loss this is very profitable position
cake / usdtRemember, this is just my analysis and I am not your investment advisor, so if you want to trade, be sure to analyze it yourself.
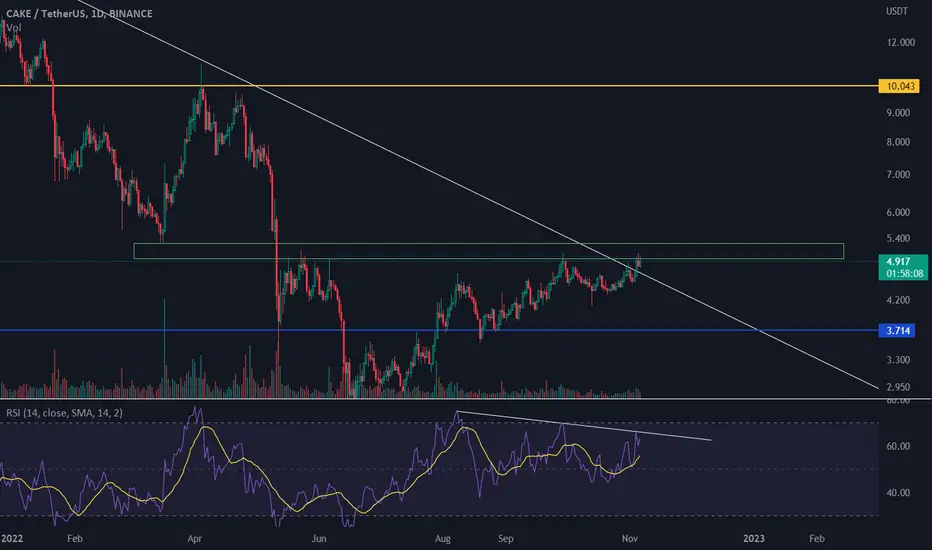
CAKEUSDT Price predictionCake has been respecting the above trendline from a long time and now it looks like its ready for a breakout.
In shorter timeframe we can see price is taking rejection from the blue zone which is a good resistance zone. If broken and sustains above the blue level we can see good move upside.

Cake.Usdt Daily chart RR 1-2"If you can't beat the fear, do it scared!"
"Be fearful when others are greedy, and greedy when others are fearful!" - Warren Buffet.
"Markets are a device for transferring money from the impatient to the patient. - Warren Buffet
"Show me the charts, and I'll tell you the news." - Bernard Baruch
"The secret to investing/trading is figuring out how rich you want to be and how poor you're willing to become."
"If you want to live like the 5% of the population who are hugely successful, then don't act like the 95%!"