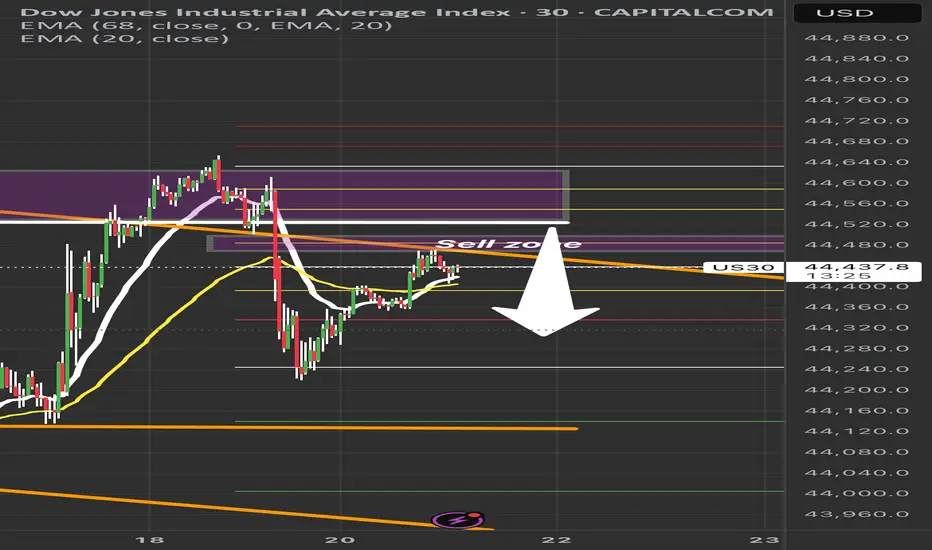
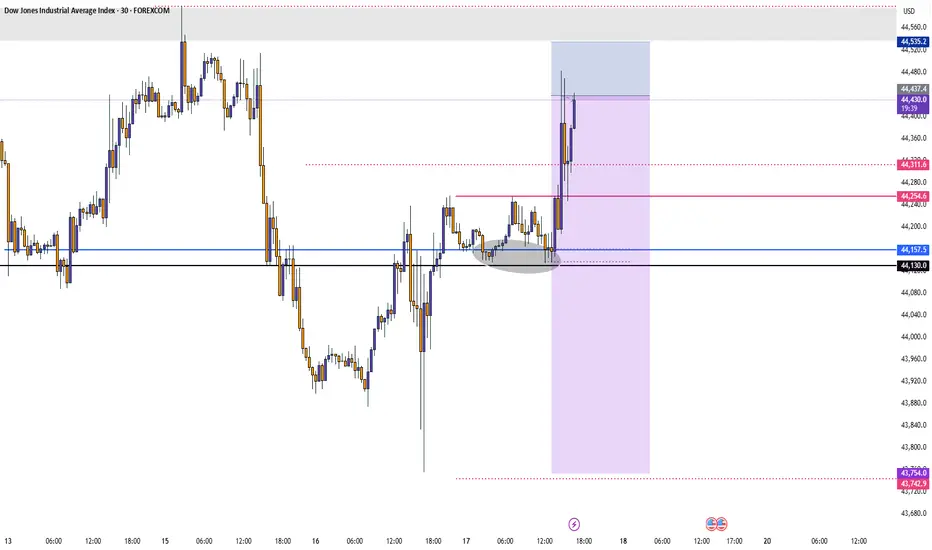
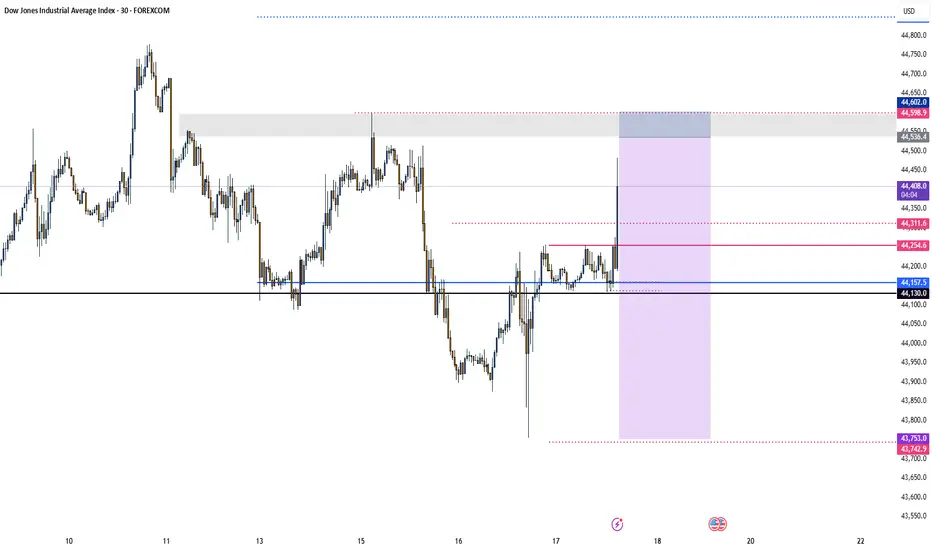
US30 Sell Setup – Watching Key Retracement ZonePrice is pulling back into a key sell zone (44,480–44,550) after a strong bearish move.
✅ Confluences:
• Previous liquidity zone
• 50–61.8% Fib retracement
• EMA rejection overhead
Plan: Waiting for bearish confirmation before short entry.
🎯 Targets:
TP1: 44,300
TP2: 44,150
TP3: 44,000
❌ Invalidation: Break above 44,600.
Patience = Precision. No confirmation, no trade.
#US30 #DowJones #TradingSetup #SmartMoneyConcepts #PriceAction #LiquidityZones #ForexTrading #DayTrading #IndicesTrading #SupplyAndDemand #TechnicalAnalysis #Fibonacci #MarketStructure #ScalpSetup #SwingTrade #RiskManagement #TradingEducation
US30 trade ideas
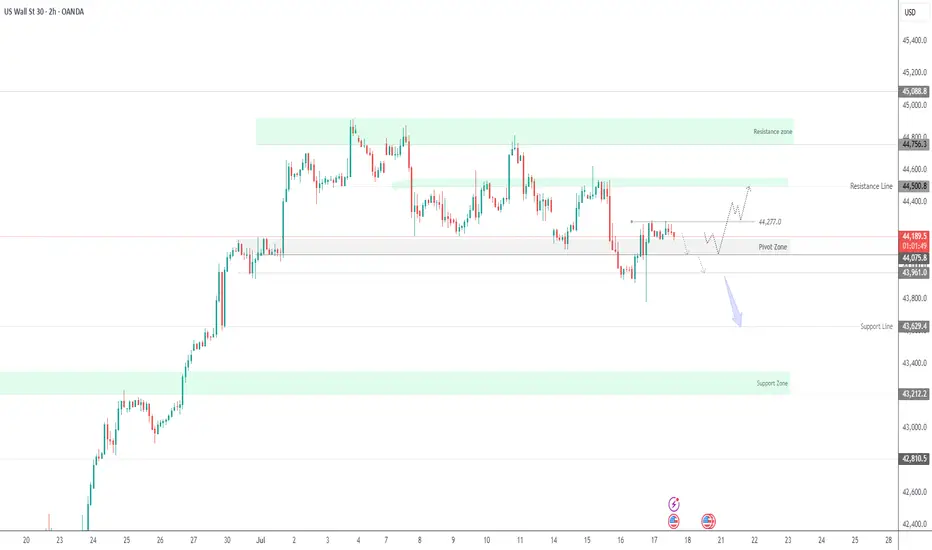
US30 Update – 07/21/2025📍 US30 Update – 07/21/2025
Sideways chop continues on US30 🌀
We’re still range-bound between 44,285 and 44,867, with price currently hovering mid-range around 44,470. Structure remains indecisive — buyers tried to push higher but got faded near the 44,600 level again.
EMA structure is flat on the 1H — confirmation that we’re consolidating.
📊 Market Structure:
🔄 Consolidation Zone: 44,285 → 44,867
📉 Failed to hold above 44,600
📈 Bulls defending 44,285 zone (demand still active)
📊 1H EMAs flat — neutral/slightly bullish
🔑 Key Levels:
🔼 Resistance: 44,600 → 44,867
🔽 Support: 44,285 → 43,929
🧠 Market Bias:
Neutral short term ⚖️
➡️ Clear breakout above 44,867 = trend continuation
⬇️ Breakdown below 44,285 = bearish structure confirmed
💡 Trade Scenarios:
📈 Range Buy (Support Play):
Entry: 44,300–44,285
TP1: 44,500
TP2: 44,700
SL: Below 44,200
📉 Range Sell (Resistance Fade):
Entry: 44,600–44,650
TP1: 44,400
TP2: 44,300
SL: Above 44,700
⚔️ Breakout Setup:
Long above 44,870 (confirmation)
Short below 44,280 with volume
📵 No trade in the middle of the range unless scalp — wait for edges to act.

Dow Jones -> A breakout rally of +40%!🐂Dow Jones ( TVC:DJI ) will create new highs:
🔎Analysis summary:
Since the April lows, the Dow Jones already rallied about +25%. This was simply the expected rejection away from a strong confluence of support. Now, the Dow Jones is sitting at the previous all time highs and about to break out, leading to a massive rally.
📝Levels to watch:
$45.000, $60.000
🙏🏻#LONGTERMVISION
Philip - Swing Trader

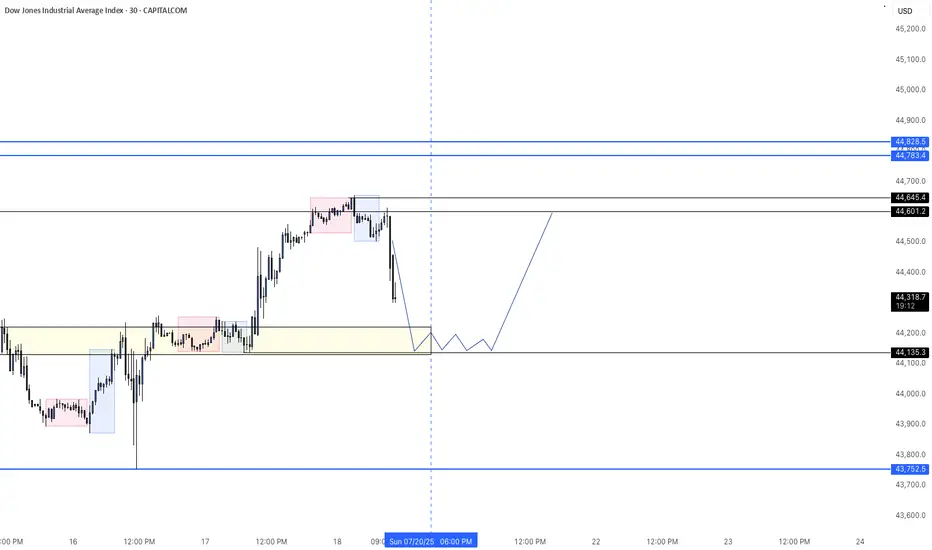
US30 - LONGBearish Friday after price hit a key level high. Price will continue to the downside the remainder of today. Expecting a jump back to today's highs come Monday morning.
US30: Move Up Expected! Long!
My dear friends,
Today we will analyse US30 together☺️
The price is near a wide key level
and the pair is approaching a significant decision level of 44,325.14 Therefore, a strong bullish reaction here could determine the next move up.We will watch for a confirmation candle, and then target the next key level of 44,425.56.Recommend Stop-loss is beyond the current level.
❤️Sending you lots of Love and Hugs❤️
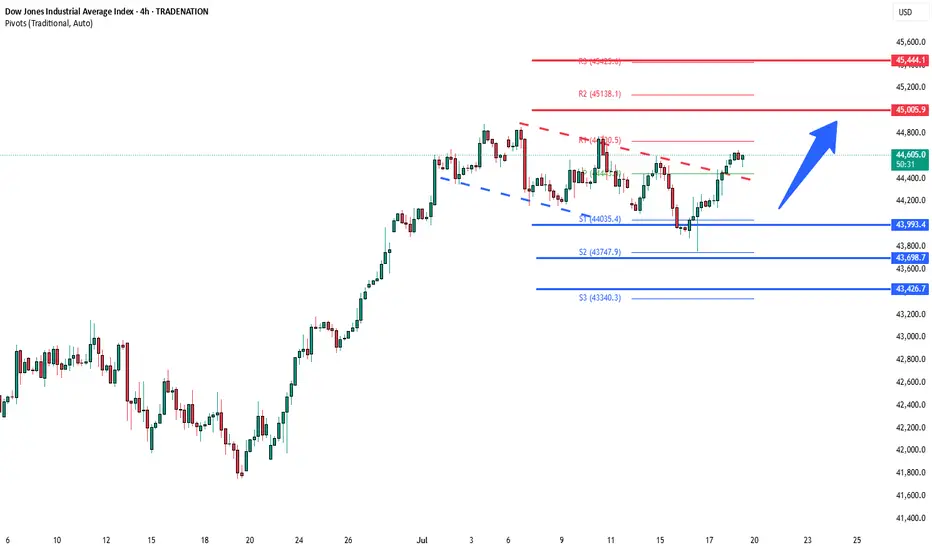
DowJones bullish continuation breakout support at 43990Key Support and Resistance Levels
Resistance Level 1: 45000
Resistance Level 2: 45440
Resistance Level 3: 46000
Support Level 1: 43990
Support Level 2: 43700
Support Level 3: 43420
This communication is for informational purposes only and should not be viewed as any form of recommendation as to a particular course of action or as investment advice. It is not intended as an offer or solicitation for the purchase or sale of any financial instrument or as an official confirmation of any transaction. Opinions, estimates and assumptions expressed herein are made as of the date of this communication and are subject to change without notice. This communication has been prepared based upon information, including market prices, data and other information, believed to be reliable; however, Trade Nation does not warrant its completeness or accuracy. All market prices and market data contained in or attached to this communication are indicative and subject to change without notice.
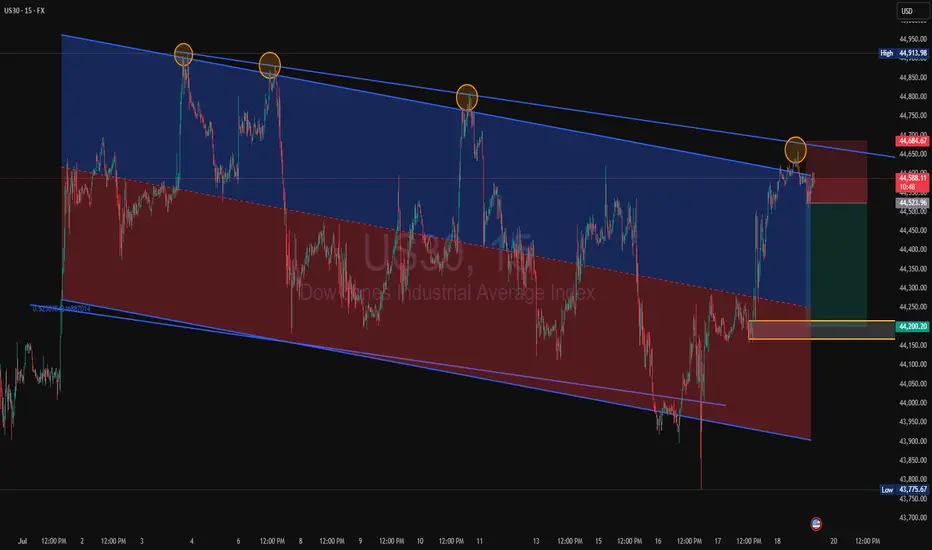
US30 Rejection at Channel Resistance US30 is showing a repeated pattern of rejection at the upper boundary of the descending channel. Price has now tapped this trendline for the fourth time, forming a consistent bearish structure.
Price rejected again at the top of the descending channel (marked by orange circles)
Clear sell setup with stop above the most recent swing high, targeting the lower channel boundary around 44,200, aligning with past demand.
Short below 44,685
Target: 44,200
Stop: Above recent highs near 44,913
Risk/Reward: Favourable if structure holds. If this pattern plays out as before, we can expect another push to the downside within the channel.
A break and retest of the midline could add extra confirmation.
#US30 #DowJones #PriceAction #SellSetup #BearishRejection #ChannelTrading #TechnicalAnalysis
EURUSD & US30 Trade Recaps 18.07.25A long position taken on FX:EURUSD for a breakeven, slightly higher in risk due to the reasons explained in the breakdown. Followed by a long on OANDA:US30USD that resulted in a loss due to the volatility spike that came in from Trump.
Full explanation as to why I executed on these positions and the management plan with both.
Any questions you have just drop them below 👇

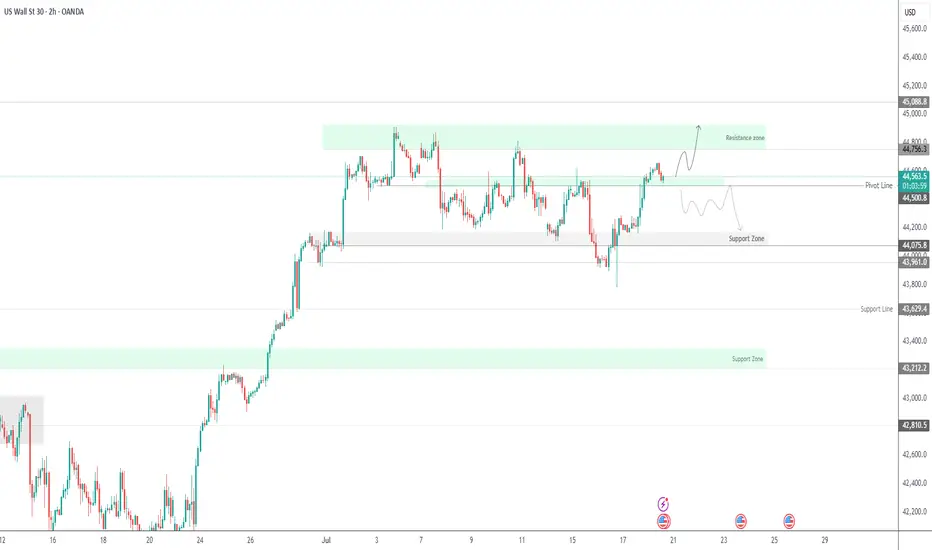
US30 Holds Above 44500 – Bullish Momentum in PlayUS30 | Technical Overview
The price action continues to reflect a bullish bias, supported by strong earnings reports and solid U.S. economic data. As long as the index trades above 44500, the upward momentum is expected to continue.
Technical Outlook:
Price remains bullish above 44500, with upside targets at 44640 and 44760.
A confirmed 1H close below 44500 would shift momentum to the downside, exposing support levels at 44350 and 44215.
Key Levels:
• Pivot: 44500
• Resistance: 44640 / 44760 / 44920
• Support: 44350 / 44215 / 44075
US30 UNCERTAINTY We could see a possible bounce on 4465. or price could break below and target 43700
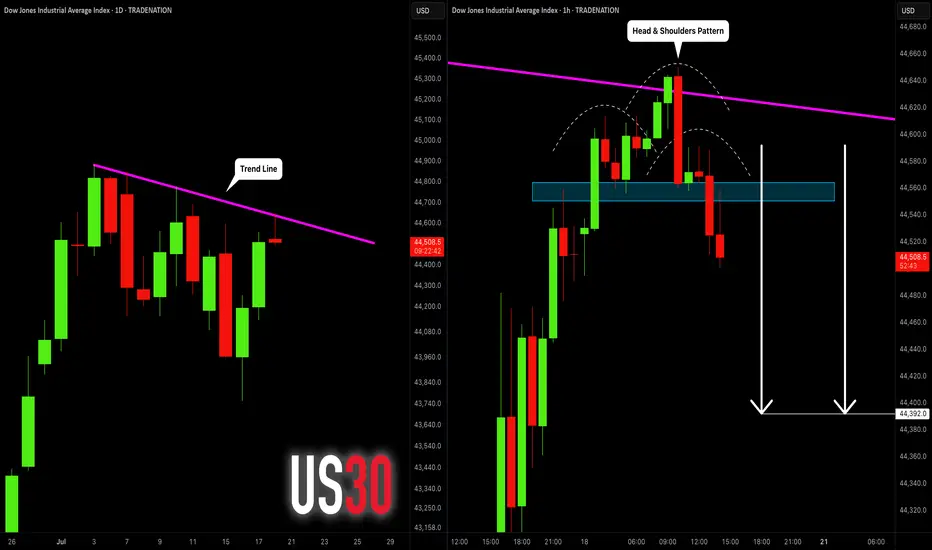
DOW JONES INDEX (US30): Bearish Move From Trend Line
I see a test of a strong trend line on US30.
The price formed a head & shoulders pattern on that
and a breakout of its neckline on an hourly time frame.
I expect a retracement to 48390
❤️Please, support my work with like, thank you!❤️
I am part of Trade Nation's Influencer program and receive a monthly fee for using their TradingView charts in my analysis.
Quick take on DJIACurrently, the Dow Jones Industrial Average TVC:DJI is trading within a short-term downside channel. However, could it just be part of a correction, before another possible leg of buying? Let's dig in.
MARKETSCOM:US30
Let us know what you think in the comments below.
Thank you.
75.2% of retail investor accounts lose money when trading CFDs with this provider. You should consider whether you understand how CFDs work and whether you can afford to take the high risk of losing your money. Past performance is not necessarily indicative of future results. The value of investments may fall as well as rise and the investor may not get back the amount initially invested. This content is not intended for nor applicable to residents of the UK. Cryptocurrency CFDs and spread bets are restricted in the UK for all retail clients.

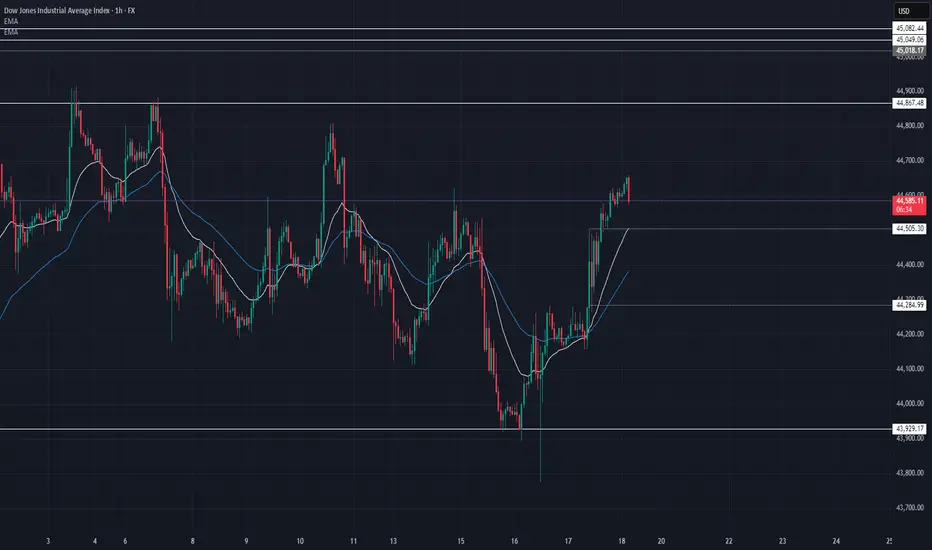
US30 Update – 07/18/2025📍 US30 Update – 07/18/2025
Massive recovery off 43,929 👀
US30 has broken above the 44,500 resistance and is holding strong around 44,590. The EMAs are now sloping bullish on the 1H — this is the first solid bullish structure since the early July top.
If buyers hold above 44,500, we could see a run to retest 44,867, the local high.
📊 Market Structure:
🔄 Bear trend possibly shifting → early signs of reversal
📈 Higher lows forming — EMAs crossed bullish
🔼 Break of 44,505 confirmed strength
🧭 Eyes now on 44,700–44,867 zone
🔑 Key Levels:
🔼 Resistance: 44,700 → 44,867
🔽 Support: 44,505 → 44,285 → 43,929
🧠 Market Bias:
Short-term bullish — but buyers must defend 44,500.
A drop below 44,285 would invalidate this move.
💡 Trade Ideas:
🔼 Long Setup – Continuation:
Entry: Pullback to 44,505–44,530
TP1: 44,700
TP2: 44,850
SL: Below 44,450
🔻 Short Setup – Fade Rejection:
Entry: Rejection at 44,700–44,850
TP1: 44,500
TP2: 44,300
SL: Above 44,900
⚠️ Patience — wait for clean retests or candle rejections at key levels. No need to force entries.
Dow Jones: Shaking amid rumors of Powell’s dismissalIon Jauregui – Analyst at ActivTrades
The main Wall Street indices closed Thursday’s session with mixed results. Comments from Trump stating he had no plans to fire Powell but “doesn’t rule anything out” except in cases of fraud, along with Powell’s declaration that he will serve his full term until mid-2026, pressured the market. The U.S. market has been dealing with these dismissal tensions for seven months, which made the Dow Jones appear weaker, while the S&P 500 and Nasdaq managed to stay in positive territory, supported by strong earnings from key companies. At the session’s start, the Dow Jones fell 0.09% to 44,202 points, while the S&P 500 rose 0.04% to 6,266 points and the Nasdaq gained 0.17% to 20,777 points. However, the Dow Jones closed at 44,484.49 points (+0.52%), the S&P 500 at 6,297.36 points (+0.54%), and the Nasdaq at 20,885.65 points (+0.75%). The day was marked by rumors from the White House, where an official stated that Trump would “probably soon” fire Jerome Powell. The news triggered an intraday drop of over 260 points in the Dow Jones, although markets later moderated losses after clarifications from the former president himself.
An early dismissal of Powell would likely impact the market very negatively and generate significant chaos. Trump’s interest in pressuring the Fed for rate cuts, although he cannot legally dismiss the central bank’s president, has been on the table since the start of his term. This has caused pronounced volatility movements. Meanwhile, the 10-year U.S. Treasury yield fell to 4.449%, as the market reduced the probability of a rate cut in September from 66% to 55% (CME FedWatch).
On the macroeconomic front, June retail sales rose 0.6%, far exceeding the expected 0.1%. Weekly jobless claims stood at 221,000, also below expectations. With these results, Trump has little leverage to challenge the Fed.
Notable corporate results:
PepsiCo surprised positively with EPS of $2.12 (vs. $2.03 expected) and rose 5.7% at the open.
United Airlines advanced 3.6%, beating earnings expectations with EPS of $3.87, although revenues slightly disappointed.
GE Aerospace raised its 2025 EPS forecast to a range of $5.60–5.80, driven by strong aftermarket demand.
Netflix reported after the close, with expectations of $7.09 EPS and $11.06 billion in revenue.
TSMC led chip sector gains, rising more than 3% after announcing record profits thanks to AI. AMD, NVIDIA, and Super Micro also traded higher.
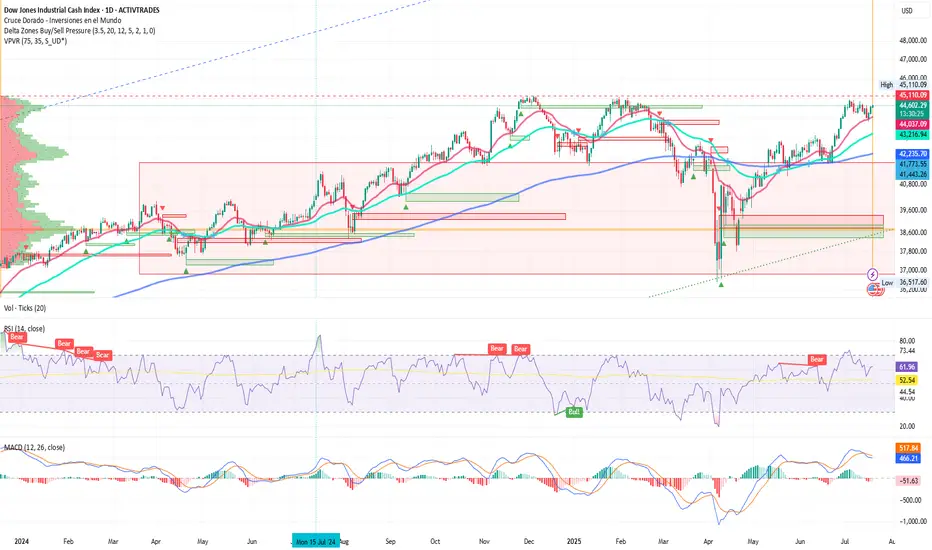
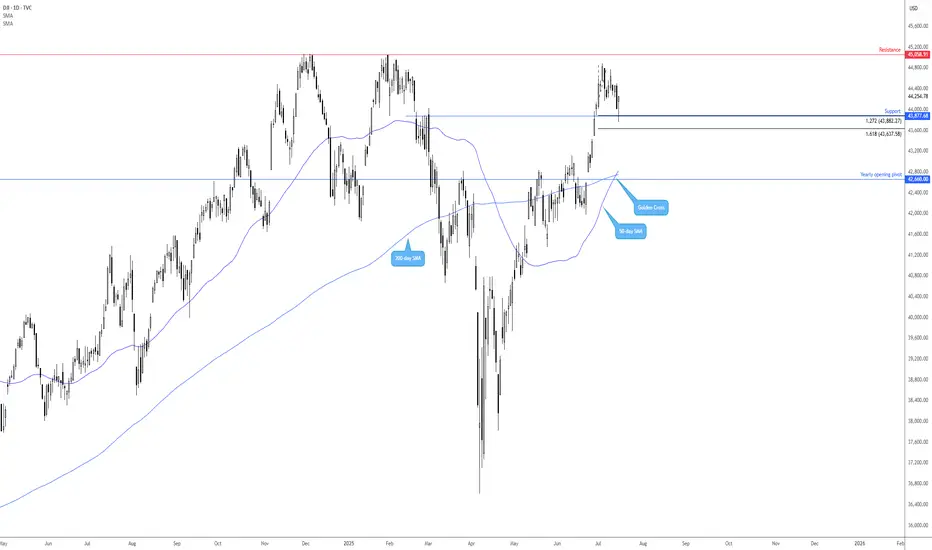
Technical Analysis
Observing the Dow Jones daily chart (Ticker AT: USAIND), since late April the index has moved upward toward its long-term control zone around 42,230 points, where the Point of Control (POC) acts as support for the current rally. In recent days, candles have used the 50-day moving average as support. The price expansion that began on June 6 with a golden cross appears solid. The bullish delta pressure zones from February and last year’s Christmas rally coincide with the current trading zone, suggesting a potential fourth attempt to break the current all-time highs at 45,110.09 points in pursuit of 46,000. If this price area is not breached, a pullback toward the POC zone could occur, and if that level fails to hold, a drop toward 39,600 points may follow.
*******************************************************************************************
La información facilitada no constituye un análisis de inversiones. El material no se ha elaborado de conformidad con los requisitos legales destinados a promover la independencia de los informes de inversiones y, como tal, debe considerarse una comunicación comercial.
Toda la información ha sido preparada por ActivTrades ("AT"). La información no contiene un registro de los precios de AT, o una oferta o solicitud de una transacción en cualquier instrumento financiero. Ninguna representación o garantía se da en cuanto a la exactitud o integridad de esta información.
Cualquier material proporcionado no tiene en cuenta el objetivo específico de inversión y la situación financiera de cualquier persona que pueda recibirlo. La rentabilidad pasada y las estimaciones no sinónimo ni un indicador fiable de la rentabilidad futura. AT presta un servicio exclusivamente de ejecución. En consecuencia, toda persona que actúe sobre la base de la información facilitada lo hace por su cuenta y riesgo. Los tipos de interés pueden cambiar. El riesgo político es impredecible. Las acciones de los bancos centrales pueden variar. Las herramientas de las plataformas no garantizan el éxito.
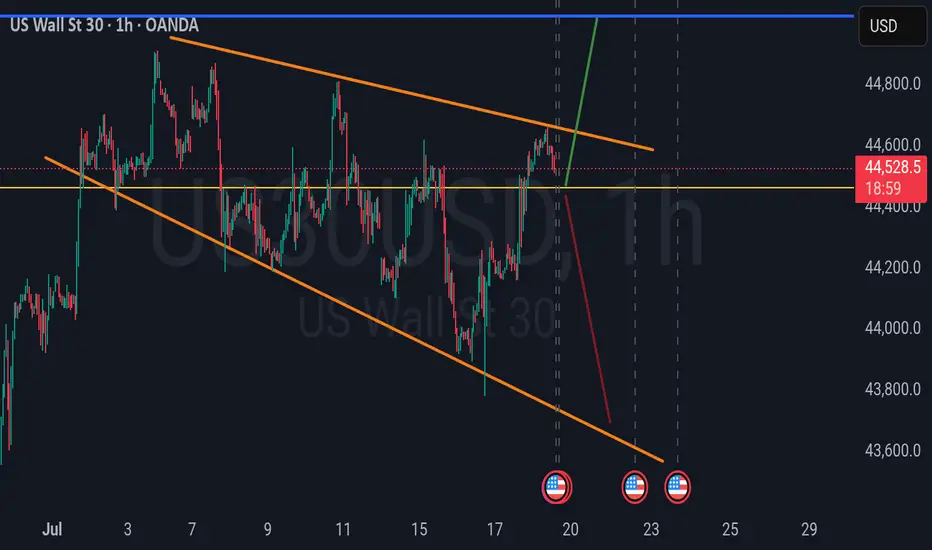
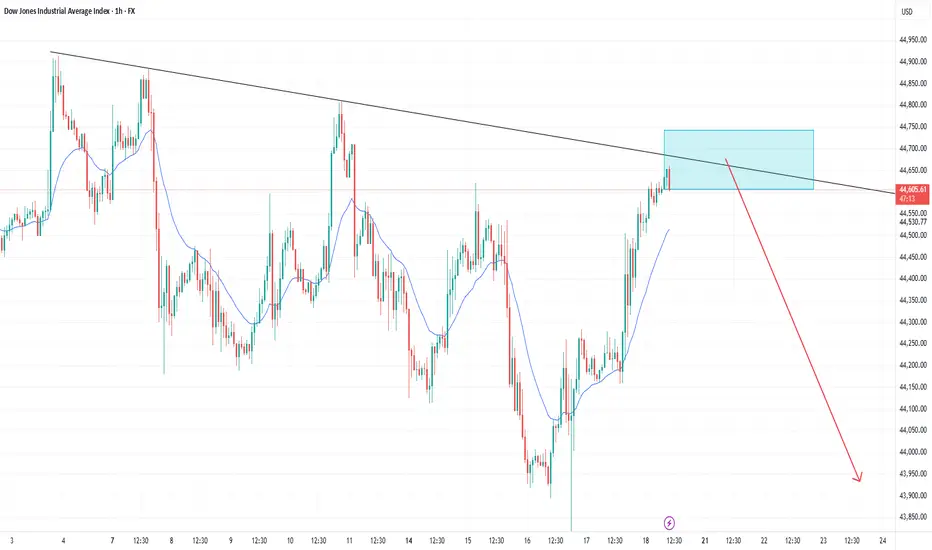
US30"Given the downward trend line formed on the one-hour chart, I expect the price to react in the area I’ve marked in blue and then move downward."
Dow Eyes 45000 After Bullish BreakoutThe U.S. 30 contract has broken topside from a short-term bull flag, reinforcing the broader uptrend and putting 45000 resistance back in focus.
Traders looking to play a continuation can consider longs with a tight stop beneath for protection. A break of 45000 may trigger a fresh burst of upside momentum, putting big figures above in play.
Bullish price momentum is also building again, adding to the case for upside.
Good luck!
DS
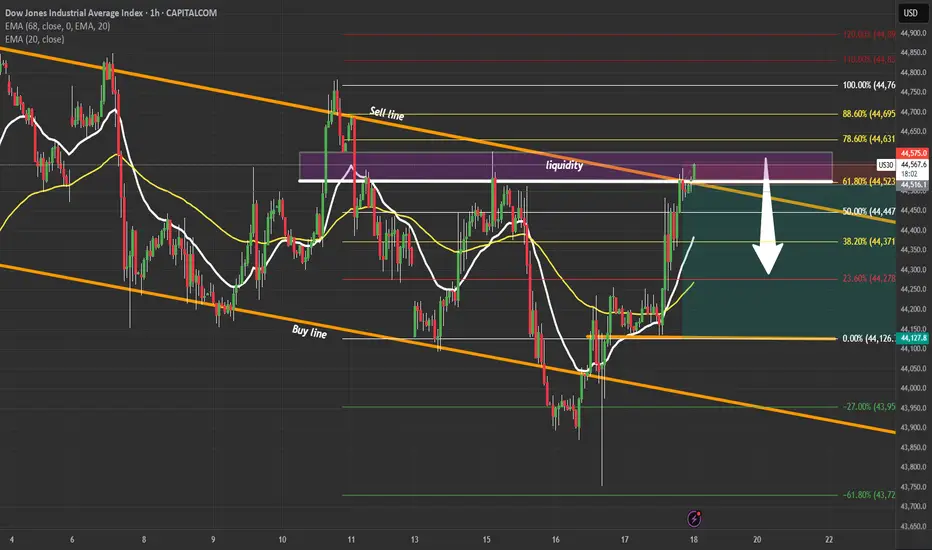
US30 High-Probability Short SetupUS30 | Liquidity Grab at 61.8% Fib 🔍
Price tapped a major liquidity zone inside the descending channel near the 61.8% Fibonacci level.
Plan: Waiting for confirmation to short toward 44,150.
Breakout or rejection? Drop your thoughts below!
Part 2 Overview of Market Week 13-19Thanks for tuning in guys, giving my knowledge to you guys free cause. AU,UJ,EU market overview mixing in a lot of fundamental confirmation.

SellRejection Level
Daily Volume
Market Structure Shift
London Session
Trend Line Break
Untapped Order Point
SellRejection Level
Daily Volume
Market Structure Shift
London Session
Trend Line Break
Untapped Order Point
US30 | Bearish Pressure Builds Below 44,170 — Breakout or BounceUS30: Eyes on Earnings and News
US stocks edged higher pre-market after Trump denied plans to fire Fed Chair Powell, easing market concerns. With corporate earnings in focus, sentiment remains cautiously optimistic.
Technical View:
The price holds bullish momentum above 44170, targeting 44280 and 44500.
A 1H close below 44170 may lead to a drop toward 44075, and breaking below that would open the path to 43960 and 43630.
A 1H close above 44280 strengthens the bullish case toward 44500.
Key Levels:
Resistance: 44280, 44410, 44500
Support: 44075, 43960, 43630
previous idea:
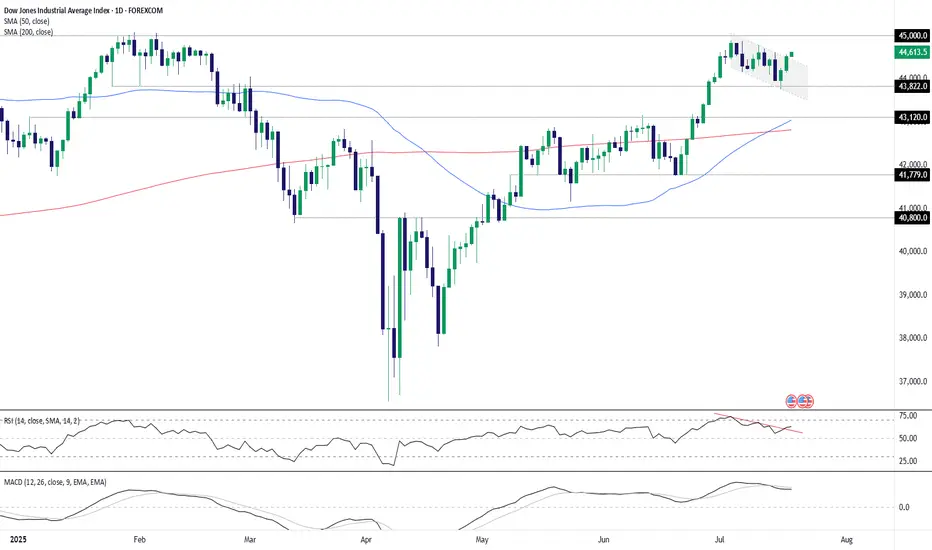
Dow offering buyers much to work with!The Dow Jones Industrial Average (DOW) is clearly trending higher, pencilling in a series of higher highs and higher lows. Supporting this trend is the 50-day simple moving average (SMA) at 42,816 crossing above the 200-day SMA at 42,749; this is referred to as a ‘Golden Cross’ and suggests a longer-term uptrend may be on the table.
This, coupled with the recent ‘alternate’ AB=CD bullish formation (1.272% Fibonacci projection ratio) completing at support from 43,877, has already seen buyers step in (with stops potentially located south of the 1.618% Fibonacci projection ratio of 43,637). The next upside objective from here rests around resistance at 45,058, closely shadowed by the all-time high of 45,073.
Written by the FP Markets Research Team
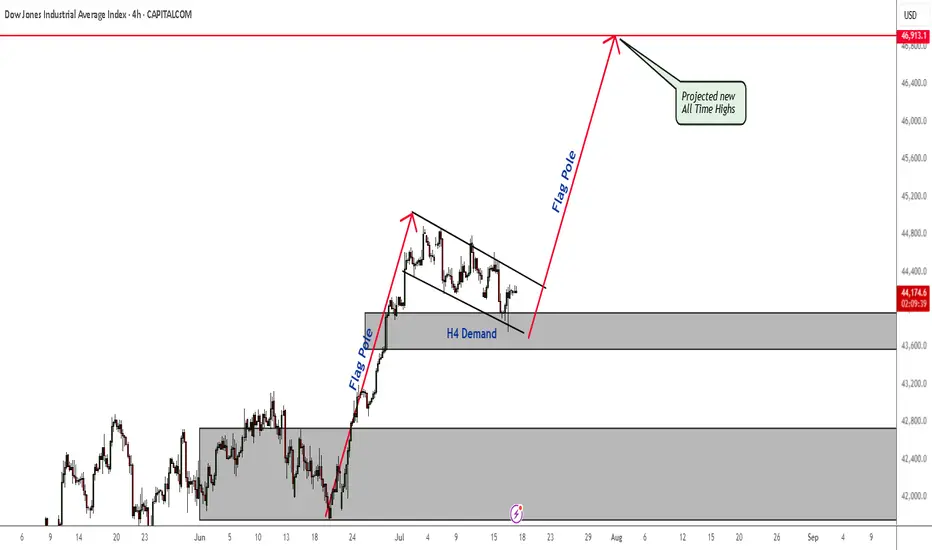
US30 Bullish Flag - All Time Highs The plan for Dow Jones has not changed. Price is still in an H4 demand zone. As soon as price breaks out of this bull flag, nothing will stop the bull run and new All Time Highs being claimed.
Don't miss it.