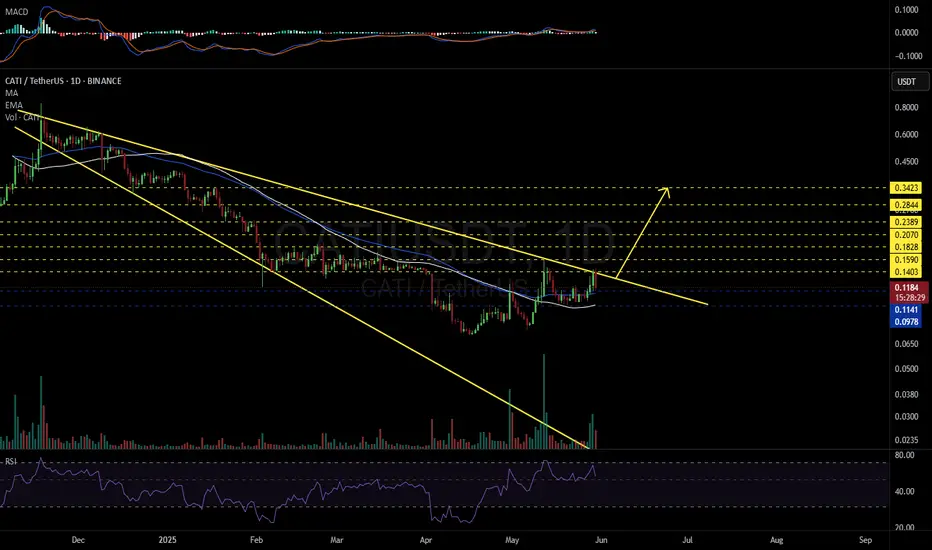
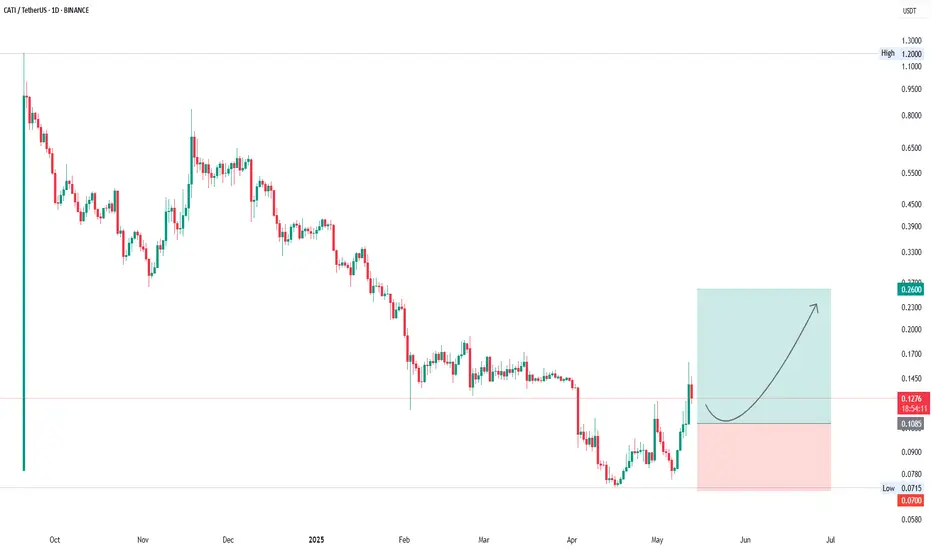
CATIUSDT 1D#CATI has formed a Descending Broadening Wedge pattern on the daily chart — a potential bullish setup. 📈
📍 Buy Zone:
Between $0.1141 and $0.0978
(Daily MA50 and EMA50 are providing strong support in this range.)
If a breakout occurs above the wedge resistance, the upside targets are:
🎯 $0.1403
🎯
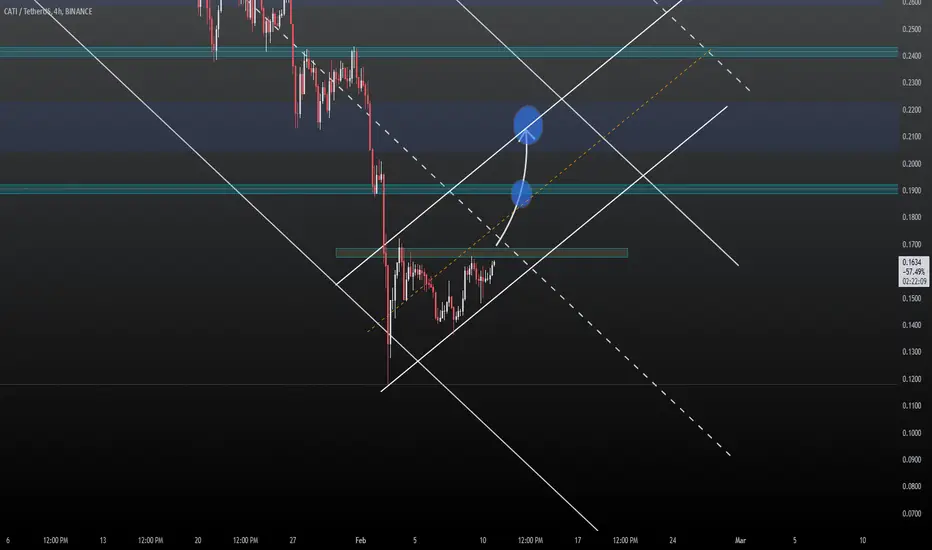
CATIUSDT - NO BUYERS!!??Observing CATIUSDT, one might initially perceive a landscape where all indicators point towards an ascent. Indeed, the superficial appearance suggests a market poised for higher valuations. However, a discerning investor must always ask the fundamental question: where are the buyers? This critical e
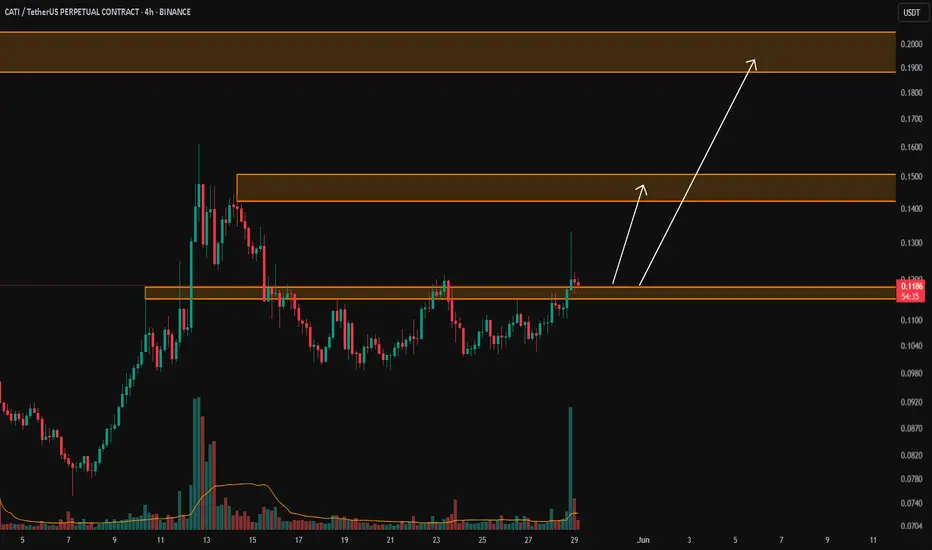
CATI/USDTKey Level Zone: 0.1150 - 0.1180
HMT v8.1 detected. The setup looks promising, supported by a previous upward/downward trend with increasing volume and momentum, presenting an excellent reward-to-risk opportunity.
HMT (High Momentum Trending):
HMT is based on trend, momentum, volume, and market str
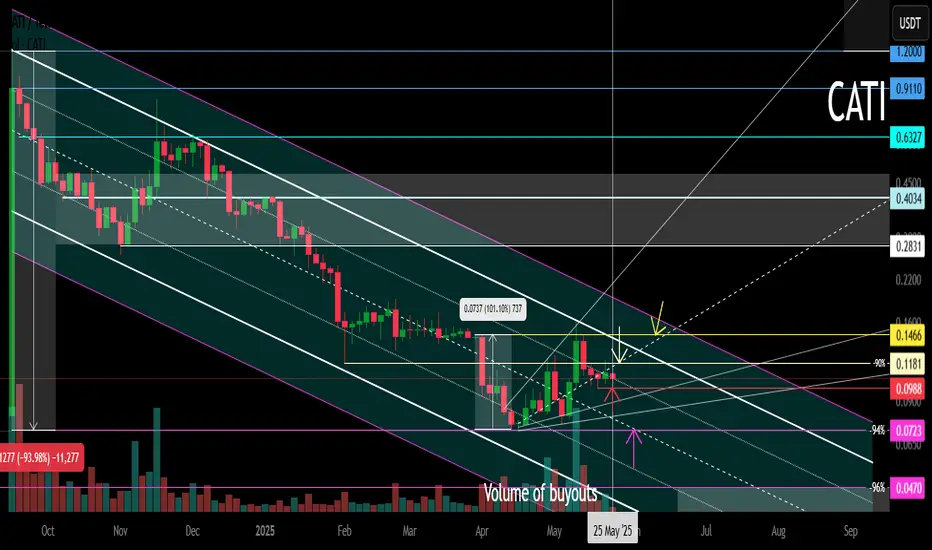
CATI Memcoin. Main (essentially secondary) trend. Channel. 25 05Logarithm. Time frame 3 days (less is not necessary). Decline from the maximum -94%. As a rule, altcoins (ticker name, legend, imitation of usefulness does not matter) of such liquidity decline in their secondary trend until its reversal by -95-98%.
But, at the moment, there is a significant increa
CATITrend is your friend
Expecting massive bullish rally on daily timeframe✅
Expected 139% bullish wave in coming days🎯🚀
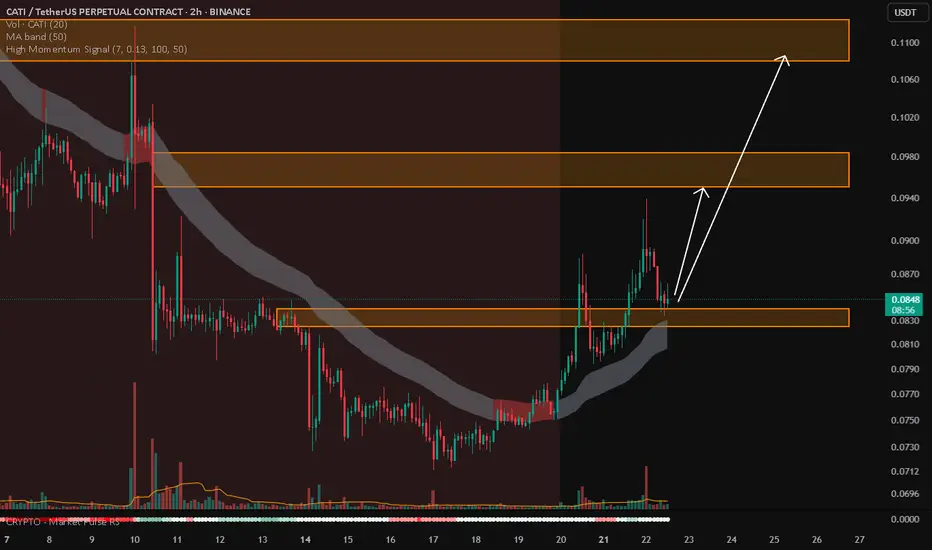
CATI/USDTKey Level Zone: 0.0825 - 0.0840
HMT v8.1 detected. The setup looks promising, supported by a previous upward/downward trend with increasing volume and momentum, presenting an excellent reward-to-risk opportunity.
HMT (High Momentum Trending):
HMT is based on trend, momentum, volume, and market str
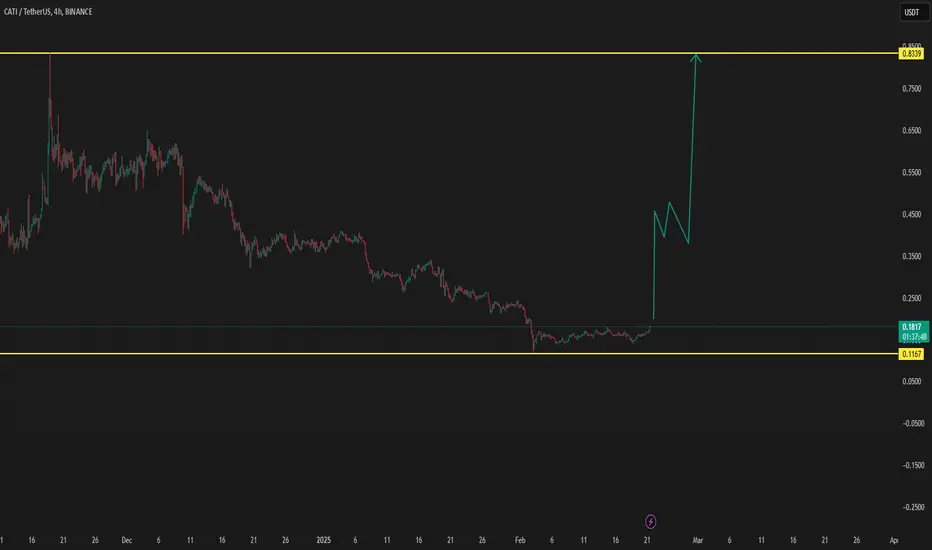
EXCLUSIVE: Binance could give CATI/USDT a moonshotEXCLUSIVE Binance can give a moonshot to Cati/USDT
If there is a finance coin that can see coming time a change depending on data then its Cati/usdt
$0,83 is an important zone.
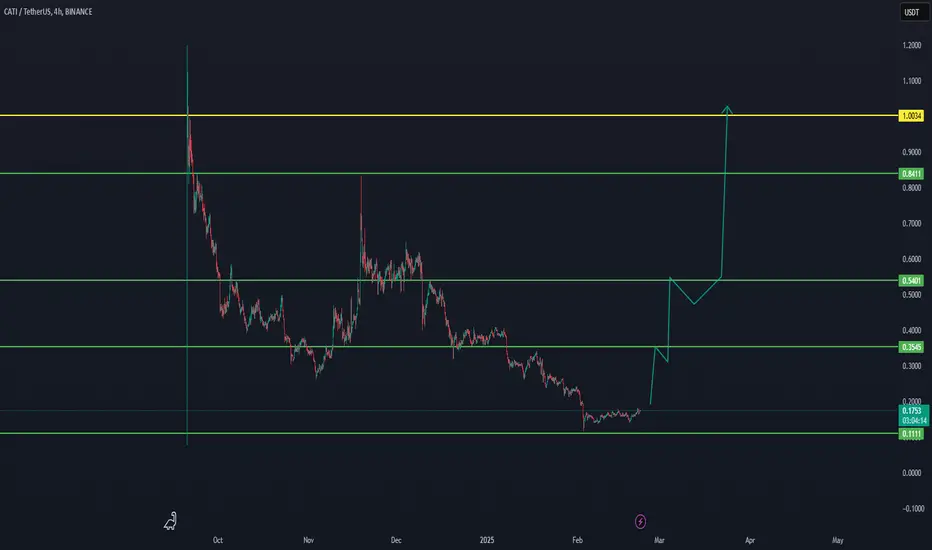
THIS BINANCE COIN CAN BREAK TO 1 USD UNEXPECTEDTHIS BINANCE COIN CAN BREAK TO 1 USD UNEXPECTED
We will follow for 1 week if this coin is able to return 1 USD. the following will be max 1 week.

CATI/USDT NEW INCREASE VOLUMECATI/USDT NEW INCREASE VOLUME
Following to see if this coin is able to break as it shows on TA
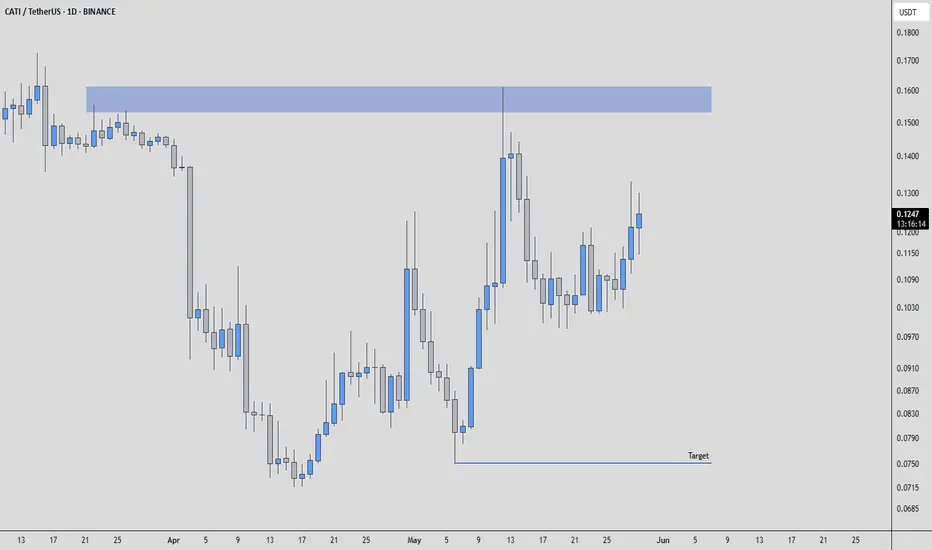
CATIUSDT Analysis: Anticipating a Potential Price CorrectionHello traders!
Following a significant price drop, CATIUSDT appears to be poised for a potential price increase or corrective rebound. This upward movement could offer an opportunity for traders who bought at higher prices or are currently holding the cryptocurrency.
The anticipated price correctio
See all ideas
Summarizing what the indicators are suggesting.
Oscillators
Neutral
SellBuy
Strong sellStrong buy
Strong sellSellNeutralBuyStrong buy
Oscillators
Neutral
SellBuy
Strong sellStrong buy
Strong sellSellNeutralBuyStrong buy
Summary
Neutral
SellBuy
Strong sellStrong buy
Strong sellSellNeutralBuyStrong buy
Summary
Neutral
SellBuy
Strong sellStrong buy
Strong sellSellNeutralBuyStrong buy
Summary
Neutral
SellBuy
Strong sellStrong buy
Strong sellSellNeutralBuyStrong buy
Moving Averages
Neutral
SellBuy
Strong sellStrong buy
Strong sellSellNeutralBuyStrong buy
Moving Averages
Neutral
SellBuy
Strong sellStrong buy
Strong sellSellNeutralBuyStrong buy
Displays a symbol's price movements over previous years to identify recurring trends.