BITx -- Weekly Volatility SnapshotHello Bitcoin community 🤠👾🤑👾🤠
Good morning/Good afternoon, maybe goodnight to you pending where you are in the world!
Nonetheless, I'm glad you found me because here we are going to look over our weekly historical volatility ranges on CBOE:BITX and assess where IV is in perspective to what's trending. Then we will talk targets within my custom adjusted implied weekly ranges.
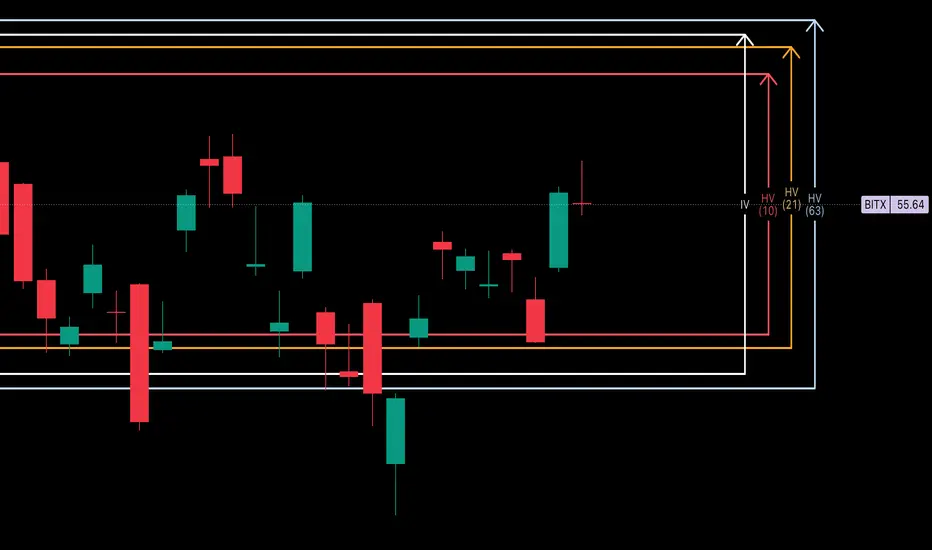
Entering the week, IV (76.86%) is projecting +17.74% more than what short-term trending markets are showing with HV10 (59.12%) holding a 'strength of IV' of only 76.91%. This is a price differential on the week of -$1.19. Our monthly values with HV21 (71.20%) are hinged slightly below IV, showing a 'strength of IV' slightly more at 92.64%.
In my opinion looking towards this week, IV may be painting the bigger picture of price distribution upwards towards quarterly trends. It is expansive from past weeks and above short-term trending markets with a wider range and with IV percentile slowly creeping up.
If the trend holds that started last week, my price target will be HV63 at $61.07 which draws confluence with the correction impulse wave top of $60.39 -- a price action to implied calculation difference of only +/-$0.69. Fantastic , right?!? This would take BTC approaching new ATHs again. If price action can find quarterly trends we will be seeing a 'strength of IV' of 108.44% -- only slight advantageous over IV premium.
In the end, markets are unpredictably wild and we can only assess and reduce our risk using the tools provided. Always remember your ABCs and to hedge your bias! Come back next week as we recap how the weekly volatility unfolded.
Cheers!
BITX trade ideas
BITx - Weekly Volatility Snapshot Good Morning -- Happy Father's day to any dad's out there!
Let's took a weekly look at CBOE:BITX -- our 2x leveraged BITSTAMP:BTCUSD fund.
Last week, we saw a beautiful gap up to the upper HV63 implied ranges were profit was taken and accelerated selling begin. Our bi-weekly trending values have increased due to the increasing volatility. The weekly candle ended with some body to it, but was mostly flat due to the gap closing with a big wick up.
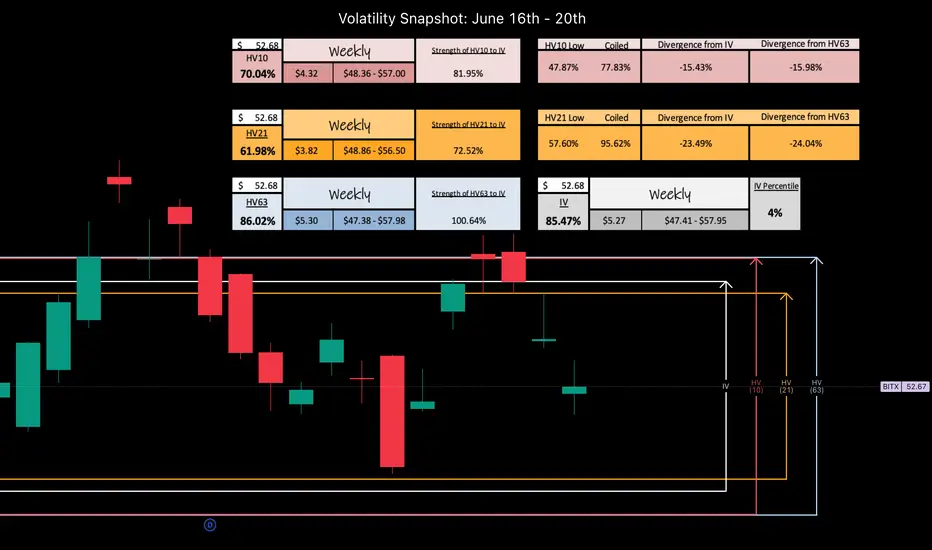
Our IV (85.47%) entering the week is trending within 4% of the sliding yearly lows and seemingly increasing as it tracks near-term trending markets -- HV10 (70.04%) has increased from the movement last week +7.35% and is now +22.17% off sliding yearly lows. As the spring is uncoiling, and bi-weekly regresses towards quarterly means our premium capture erodes and our range expands. I love trading volatility and ranges.
The 'strength of IV' here for HV10 is 82% -- so you have to account when positioning that the trending near-term volatility IS INCREASING but IS WEAKER than what is predicted. The 'strength of IV' here for HV63 is 101% -- showing that what is predicted is fairly valued to me on a regression scale.
Please -- Pull my chart onto your layout and use my implied ranges and data, follow along through the week on your own screen as we track and measure the volatility -- let's get this conversation started!
CHEERS
BITx - Weekly Volatility PotentialGood Morning!
Here is my weekly perspective for CBOE:BITX --
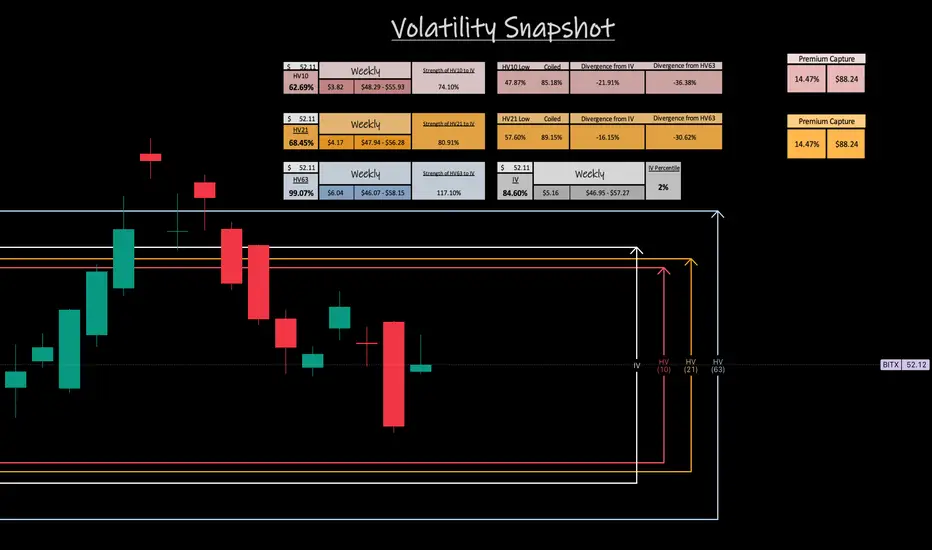
From when we reviewed last weekend, IV (84.60%) has lowered -2.39% and is entering the week with a 2% IVp. We have been in this pattern of rotating IV and Bi-Weekly volatility trends back and forth as HV10 (62.69%) entering the week has increased +2.47% from it's respective level entering last week. The prediction of what is to happen is contracting as what is actually happening in the short-term is trending up.
Bi-Weekly and Monthly volatility values after being 100% coiled and both putting in new yearly lows a month ago are starting to unwind as they create distance from those exact lows.
Could long-term trending means be on the horizon with quarterly values? Bi-weekly will eventually find it's way back there, question is when. Our best advantage, is to continue to track the data and ebb and flow with the markets and macro news.
Looking towards this next week, Our HV10 (62.69%) trending values are still contracting under our monthly HV21 (68.45%) trends, but IV (84.60%) although lowering, is reflecting expansion.
There is a premium capture past stated IV if we can find means regression back to HV63 (99.07%), as what is happening will expand past what is predicted to happen. As of now this value is 14.97% and equates to a premium capture $8.24 or $88.24 per lot or contract.
Again, when IV contracts chasing HV10, but it expands to HV63, we look to collect the premium value difference with the move.
Only time will tell, I think we will see another volume push into this week -- Remember to always be hedged and come back to join me next weekend as we review the charts for what happened VS our expectation!
CHEERS
BITx - Weekly Volatility SnapshotGood afternoon -- Here is my weekly perspective for CBOE:BITX
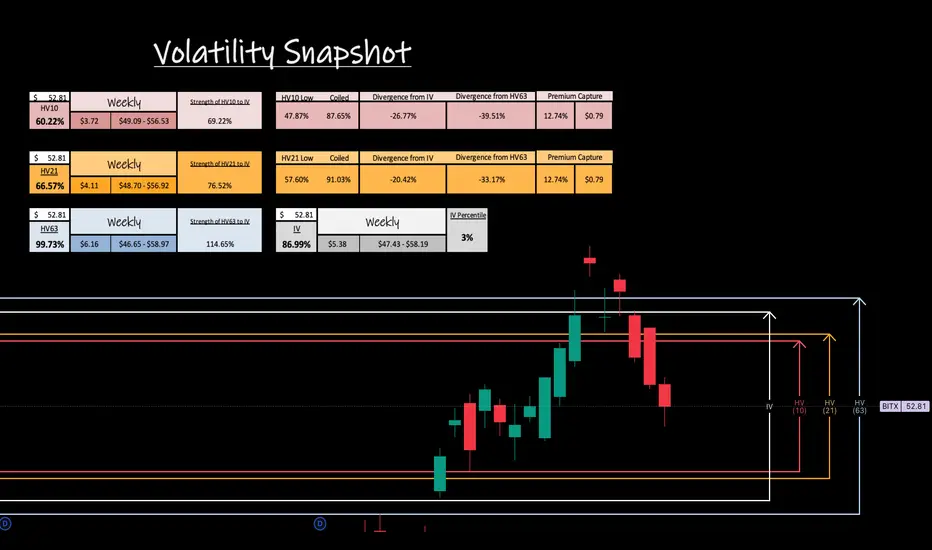
IV (86.99%) entering the week sits in the 3rd percentile for the year. HV10 (60.22%) has been lowering towards it's yearly lows of 47.87% showing a coiling of bi-weekly values at 87.65% from this -- and a divergence from IV of -26.77% . IV is chasing the sinking bi-weekly volatility trends. We generally could see a volatility bounce within this range or continue to grind to new volatility lows.
I always expect and prepare for both, Lewis Pastor once said, "in a scientific setting, chance favors the prepared mind". I hold that true in a lot of situational settings not just scientific, but find it to be very true with BITSTAMP:BTCUSD volatility and risk management.
Moving deeper into the week; what can we expect?
Well, I think that the final shakeout may be here as we consolidate more into the beginning of the week finalizing on Tuesday, June 3rd. I find significance on this date being the extension in time from selling off for 45 days after the initial 'W' distribution off the top -- potentially the start of the volatility swing back towards long-term trending means and maybe the start of another impulse run to track into..stay tuned to find out in observation.
If this week we find regression to HV63 (99.73%), it will be a swift and quick move showing lots of strength. The ability to capture premium between the difference of stated IV from lowering HV10 values to the volatility swing back up above IV to quarterly means, is what it is all about! This capture can be upwards 12.74% as a volatility metric read and beyond, because when a volatility regression occurs, it moves past means until having to consolidate back downwards again. Rinse and repeat.
For those interested in volatility analysis and the application of weighted HV ranges to IV, I encourage you to BOOST and share this post, leave a comment, or follow me to join me on this journey.
BITx - Weekly Volatility SnapshotGood Afternoon,
Here is my weekly perspective for CBOE:BITX
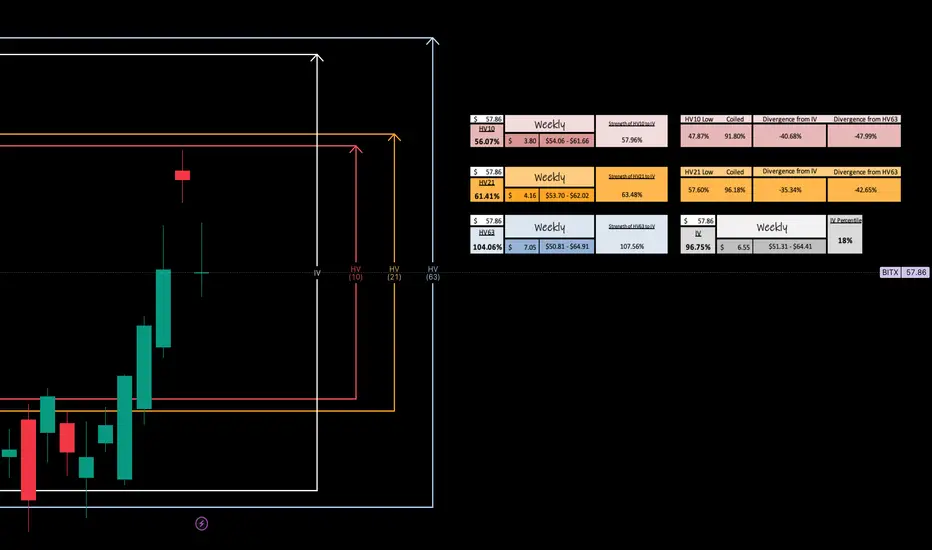
IV (96.75%) entering this week is holding in the 18th percent range for the year and has been climbing weekly from putting in new lows at the beginning of the year. We essentially have been seeing rising IV with rising price action, the best of the best. Premium increases from price action climbing and IV rising affects Vega positively increasing premium too.
Bi-weekly trends (56.07%) show a cooling off entering the week and contraction under IV, but it might not last long as there could be major macro news in the crypto world at any moment. This could be a big week on continued regression towards quarterly means (104.06%).
If this happens the range will continue to expand in my option and hold a +7.31% value per move on premium over stated IV, but weekly trends would be expanding 47.99% -- A huge move.
As always --
For those interested in volatility analysis and the application of weighted HV ranges to IV, I encourage you to BOOST and share this post, leave a comment, or follow me to join me on this journey.
BITx Weekly PotentialVolatility, expressed through standard deviation, quantifies market elasticity and presents a level of probability and precision that humbles us all.
Now we move on to the world of BTC with a look at CBOE:BITX
Here, as we have been observing an ongoing regression, you see that HV10 has expanded past HV21 and now IV is predicting more range expansion leading toward the volatility at quarterly means. Stay tuned, and I hope this helps visualize what I do.
BOOST the post, drop a follow and comment, BUT don't forget to circle back at the end of the week to revisit and observe how our trending markets preformed!

BITX — Harmonic Completion: Expression in Time for point ‘D’CBOE:BITX
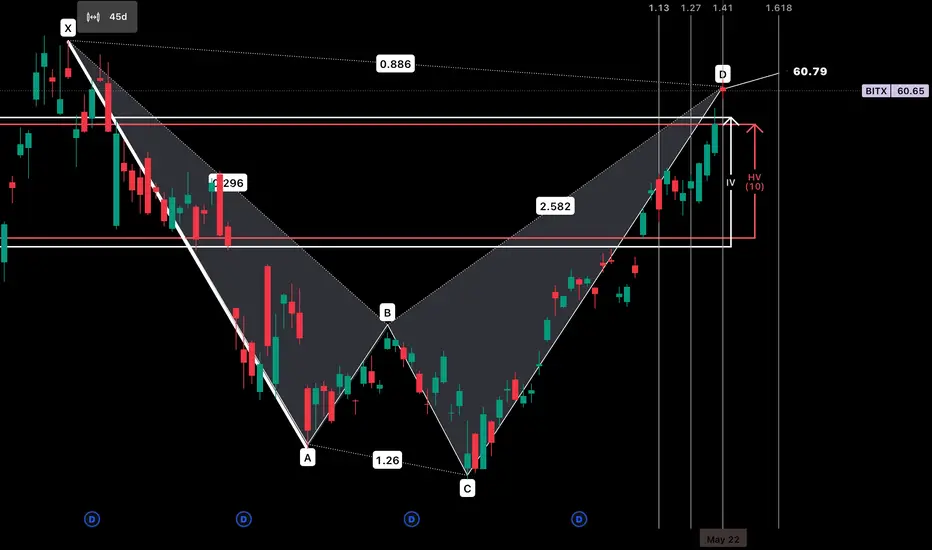
I wanted to share my concept of fibonacci retracement in time with the community and why I selected the 86.6% retracement of this sell off for point ‘D’ within my harmonic structure with an exit and completion of today.
This was a 45 day sell off after the first ‘W’ price distribution from the top. I always decide on a pivot candle to start my retracement off the impulse rally. Doesn’t matter if it is bullish or bearish by nature. When point ‘B’ was created it extended past the 23.6% value but fell short of 50% where it continued to sell down below the original impulse rally. When CBOE:BITX pivoted at point ‘C’ we had a confirmation of retracement anywhere from .886-1.13 for how I read fibonacci levels.
Next I run the ‘A-B-C Trend-Based Time’ tool and input my extensions. You will find when I build my ‘Fibonacci Triangle’ I run .382-.786 symmetrically in price/time, but for my harmonics I use extension in time to locate my point ‘D’ and pair that with my retracement level. You can see in my chart above that there is daily significance more often than not on these days. I tend to run my X-A-B-C-D tool to the harmonic extension zones in time and track the trend. This example above, it was the 86.6% retracement of a 45 sell off that executed on the 141% value in time from that sell off.
Feel me?
If you like the conversation, drop a boost and give a follow! Let’s talked price and time fibonacci symmetry. I always get down on historical volatility as well with my weighted system to ever sliding IV — Come find me, let’s go!
Using Historical Volatility and HarmonicsI track bi-weekly, monthly, and quarterly volatility to have a feel for how trending markets elasticity is and I weight this volatility percentage to the ever sliding IV environment and calculate an implied range for the week.
This helps me gauge the weekly candle potential.
Here you see my HV10/21/63 implied ranges for the week listed from my spreadsheet and visualized on the daily perspective of CBOE:BITX -- What I would like to point out entering the week as this run will begin to cool off, is the confluence around $60.00 with HV63 regression and 'Point D' completion of my harmonic shown.
I hope everyone has a great week. If you like to talk volatility and enjoy fibonacci drop me a comment.
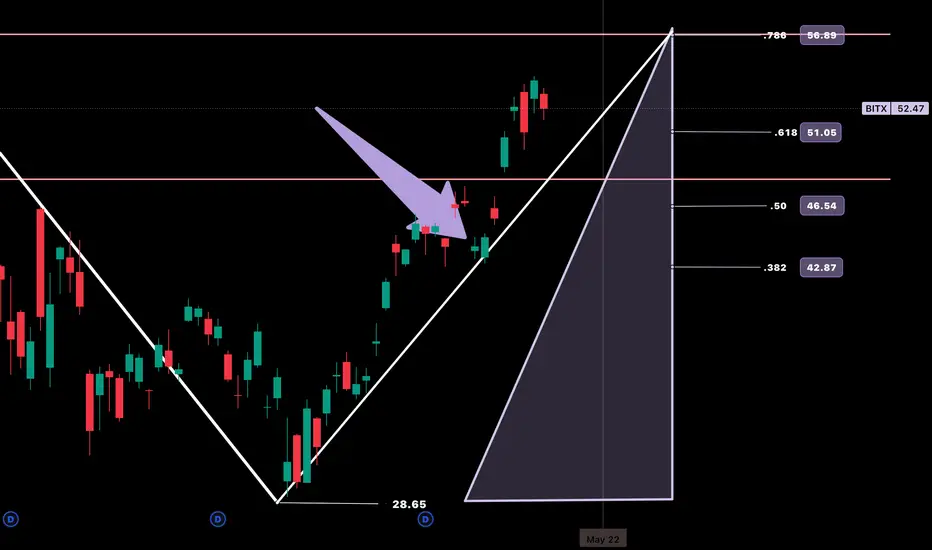
**Trade Update Post: BITx**Trying something new here for the community to follow along with me.
This is an update to my ongoing CBOE:BITX trade showing my ‘Fibonacci Triangle’ standing strong in the wake of some minor consolidation. I have highlighted by arrow during this run the last trend bounce we made before continuing upwards. I am okay with the same type of price action even with potential retracement down to the lower HV10 weekly range of $48.
Due to leverage decay on top of time decay I have set an exit path of May 22nd if I do not see the same type of bounce off my retracement trend line. This mark is Thursday next week. PT is still $58-$60
Cheers!
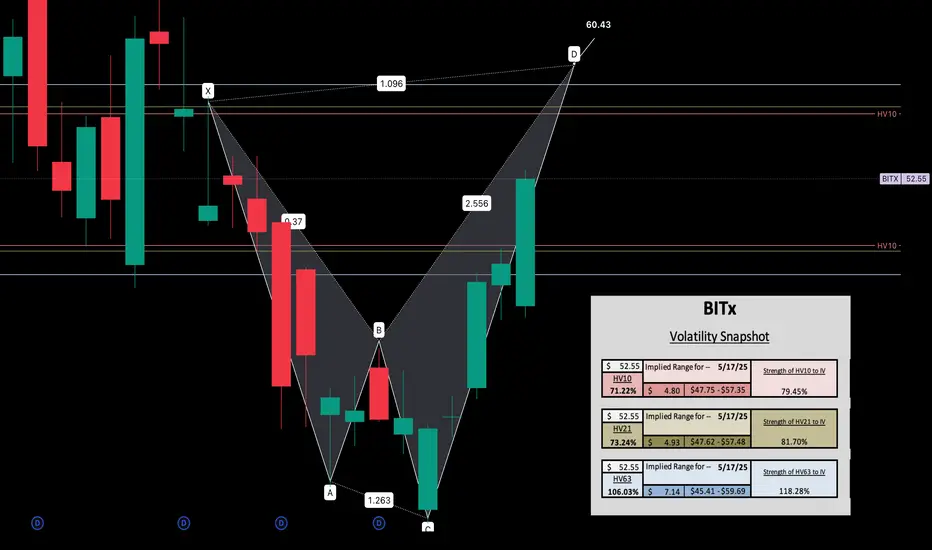
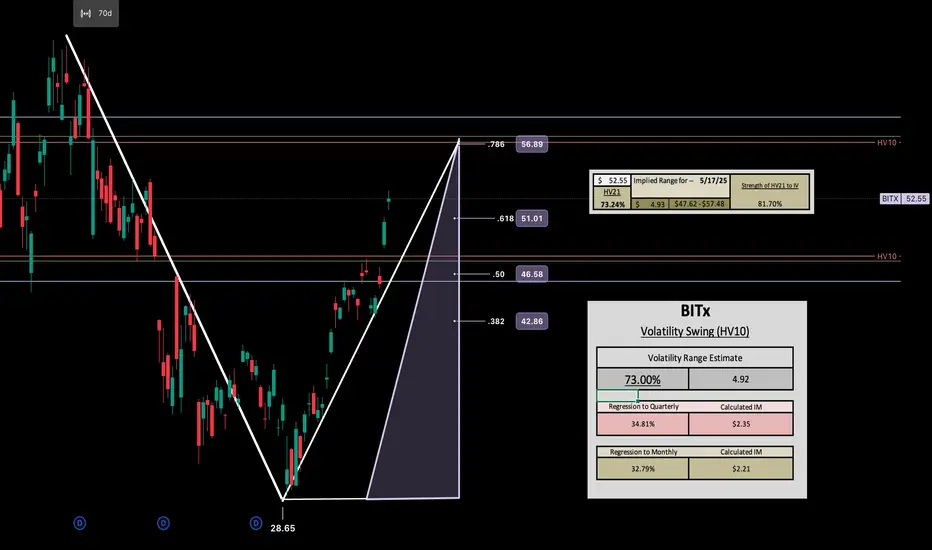
The 'Fibonacci Triangle' and Historical Volatility Along with the harmonic I just posted to the community showing confluence with HV63 regression that started to take place last week, I wanted to include my 'Fibonacci Triangle' with my predictive volatility range idea.
I see HV10 (bi-weekly) resonating off HV21 (monthly) to enter the week. This would create roughly a $4.92 range if correct for tomorrow. From there we can continue to increase in volatility into the week until full means regression to quarterly trending averages are met.
This can be reflected in the daily candle through the trending bi-weekly daily volatility print on the day, then calculated into range. Of course as always, my ranges are weighted to the current IV environment.
If my target range of monthly volatility is reached tomorrow, which holds confluence in the 78.60% retracement value from selling off with BTC for 70 days..i'd say there is probability to move another $2.21 in regression, putting us just below $60.00.
CBOE:BITX
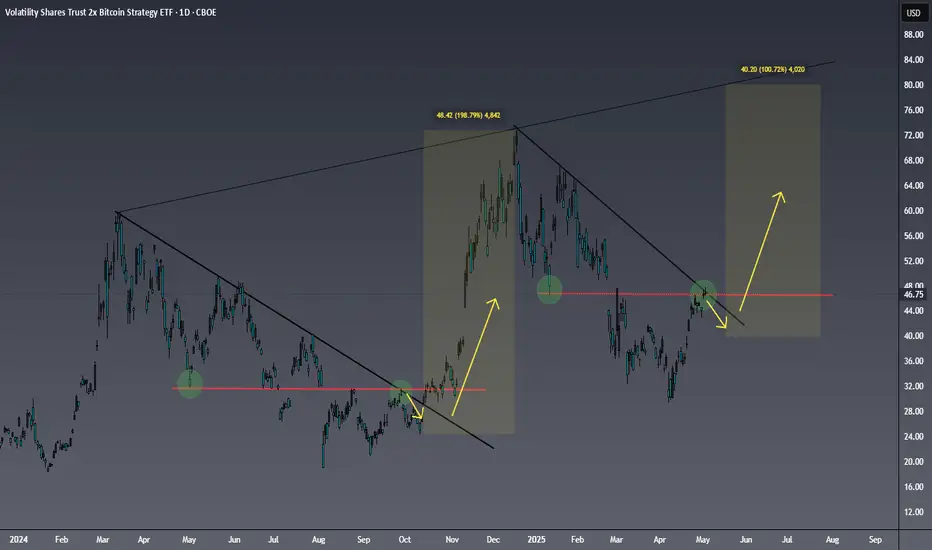
Bitcoin (BITX) getting ready for a parabolic move? Here is a chart of probably my favorite swing trade for the year.
I am keeping it simple with this chart though. I am a firm believer in simple when it comes to trading. I think the previous descension and breakout is playing out very similarly to the current one. Both had a double top rejecting from their respective trendlines following the initial breaks of structure. BITX is currently making its second tap of the the trendline. If it plays out like the previous structure did that would suggest w could see one more low in store.
I don't believe this to be the case but if it is this run could be postponed until the end summer/beginning of fall. I think it is more important to point out the relative strength in Bitcoin as of late, the weakness in the US dollar, as well as global liquidity having broke out months ago.
I think the most likely scenario is a pullback from this point which will be followed by a higher low printing. I will say I also expect this pullback to be steeper than the one from the previous descension. Bitcoin and Indices are a lot more overextended than they were last time around and the structure in indices is a lot weaker than before.
All this being said I am expecting a breakout to occur over the next several weeks just based off probabilities. It all depends on if BTC and indices and hold their respective demand/support levels. Bitcoin needs to hold 85k in order for a summer breakout to occur. For the S&P equivalent level this could be somewhere around 5200-5300.
If these assets are not able to hold these levels my confidence will shift pretty dramatically. I would still expect a major rally to take place around the Q4 timeframe but I would be expecting a lot less upside. Price would likely have to chop around for a while before deciding if it wants to continue to the upside. I am basing this off market structure/Dow theory. It is important to take all possibilities into account and ultimately let the charts do the talking.
How to manage your money in a way to get out of a bull traplet's say for example you bought 50 shares of BITX (bitcoin 2X bullish) on March 07, at Pivot for $45.50, and now you along with a lot of other longs are trapped.
Each time the market rallies other bulls get out at a loss on every rally. Causing another downturn.. trapping you further.
IF Your strategy is like mine so you won't close the trade in a loss, but you are wasting valuable time.
Also suppose you have 30 or 40% of your overall portfolio that is reserved for shorting.
When you take profits on the shorts, instead of saving the money for yor next short, you buy 50 more shares at the current market price of 37.
Now you can get out halfway to your original target, at $41 by selling both, at the same time. you made money on your long, enough to eliminate the loss if you sold the first lot below your original target.
In this example you can sell at $41, which is a lot easier to reach than $45 which might take another week. To determine the level you an get out simply add the two prices and divide by 2.
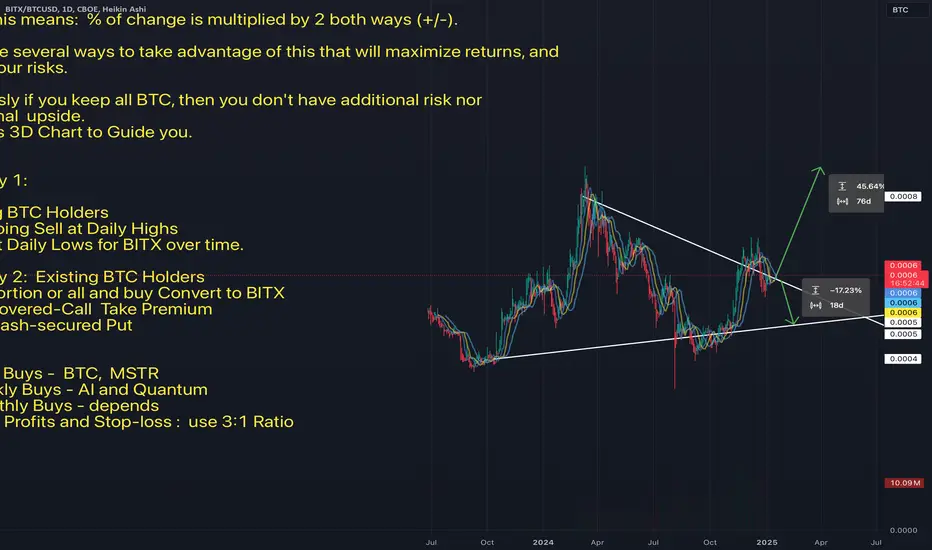
BITX vs BTC Strategy and othersBITX vs BTCUSD
BITX is a 2X Leverage ETF.
What this means: % of change is multiplied by 2 both ways (+/-).
We have several ways to take advantage of this that will maximize returns, and
lower your risks.
Obviously if you keep all BTC, then you don't have additional risk nor
additional upside.
Use this 3D Chart to Guide you.
Strategy 1:
Existing BTC Holders
- On-going Sell at Daily Highs
- Buy at Daily Lows for BITX over time.
Strategy 2: Existing BTC Holders
- Sell portion or all and buy Convert to BITX
- Sell Covered-Call Take Premium
- Buy Cash-secured Put
DCA
1. Daily Buys - BTC, MSTR
2. Weekly Buys - AI and Quantum
3. Monthly Buys - depends
4. Take Profits and Stop-loss : use 3:1 Ratio
BITX (x2 Bitcoin printed a bottom signal)My Impulse Master indicator caught the top and now signals a bottom
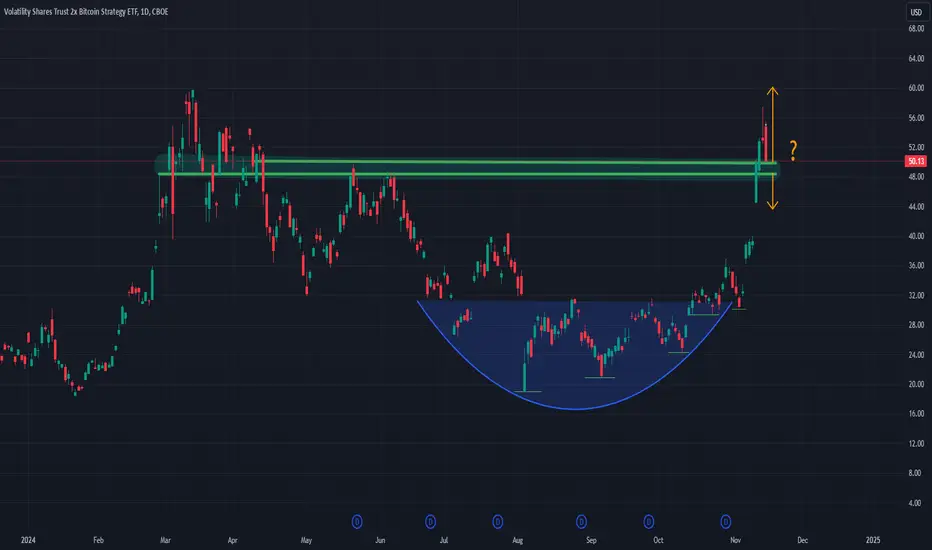
Which way mountain man?This has the opportunity of being a text book cup and handle chart pattern , I'll frame this beauty if it happens. Held 176 shares of BITX through all of this and it's been tremendous. Congrats to the longs. Our time might come this weekend... CBOE:BITX