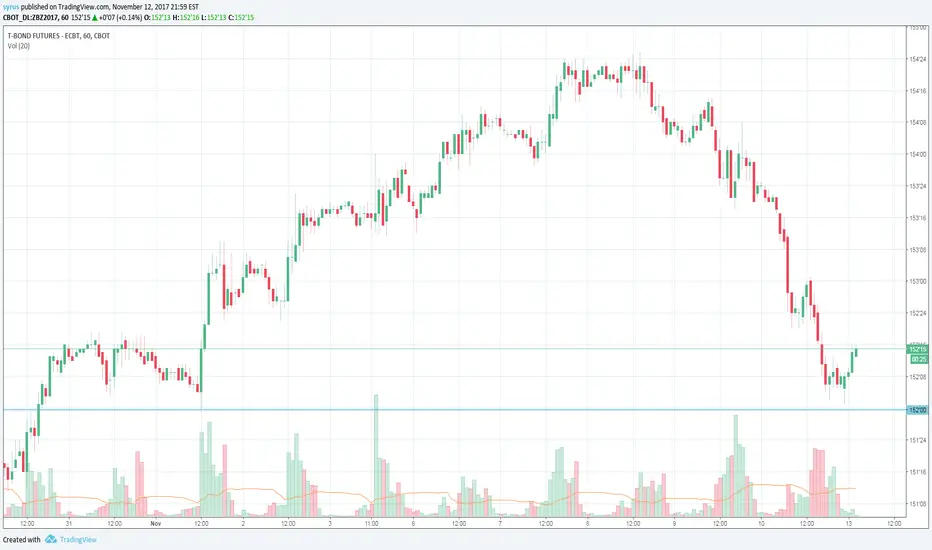
$ZB_F$SPY $TLT $VXX $QQQ $IWM $UVXY $GLD $GDX Bonds hammering on the hour off weekly VWAP (blue dots)
ZB1! trade ideas
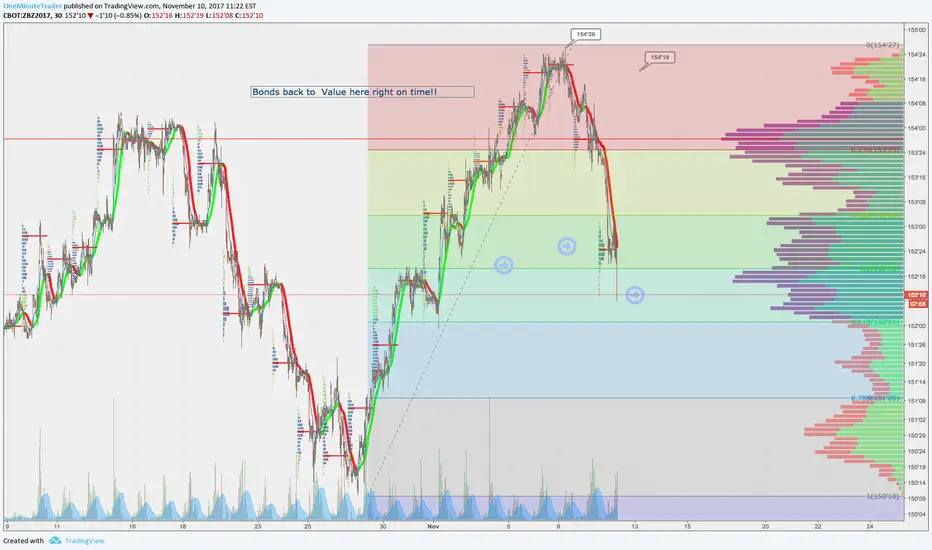
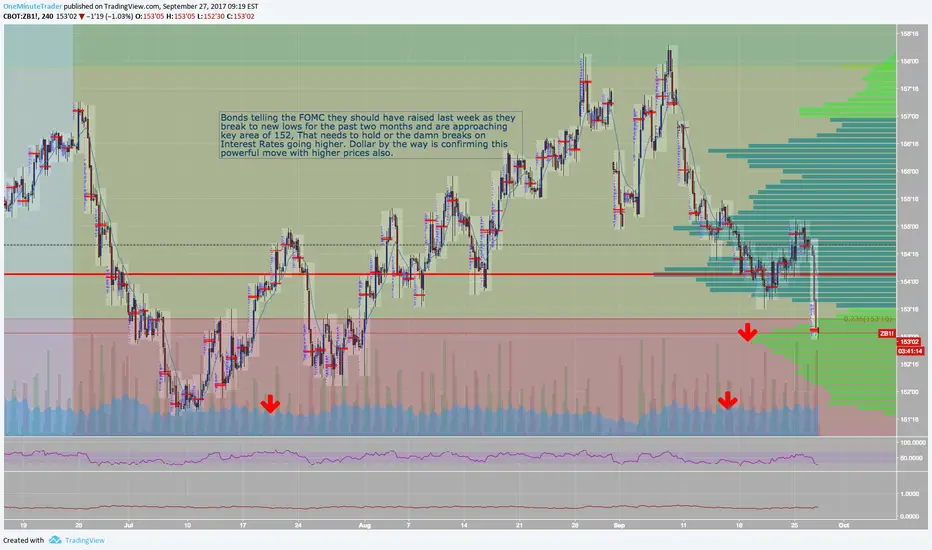
$ZB_F back to recent key juncture All is Well in world Bonds back to reality, interest rates arn't going lwoer
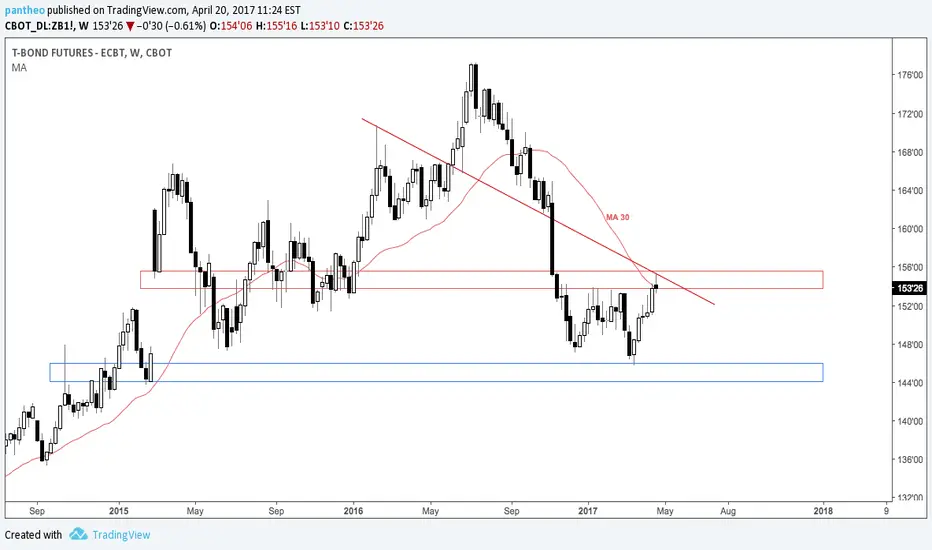
Bear Flag on 30-Year Treasury Bond (ZB)The WEEKLY time-frame shows a bear flag.
Price is below the Ichimoku Cloud as well; signals a downtrend.
Action plan: Sell call options (vertical spread) when there is a pullback i.e. when the price goes up.
More trading resources:
www.patreon.com


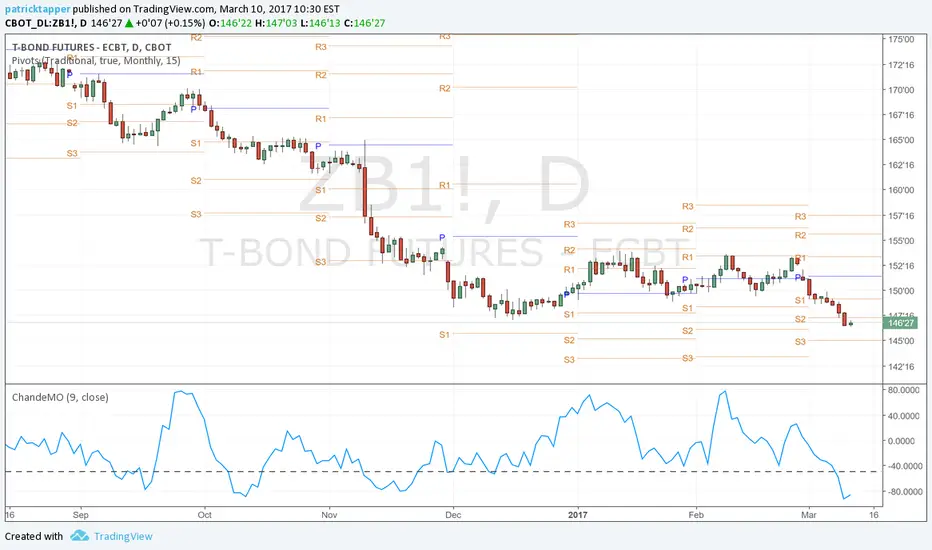
Caution for 30 year bondsThere are a number of things in play which could point to a possible sell off.
1. Volume spike blow off at recent high
2. Ascending triangle - bearing pattern
3. Break out failure/bull trap at recent high
4. Divergence on 3/10 Oscillator
It doesn't seem logical that bonds could sell off here, but on the basis of the above, there is only one thing to follow, and that is price.
Gold is displaying the same sort of behaviour. I will do another chart on that.
If bonds and gold fall, it would only give possible strength to the argument for more upside on the futures indices.

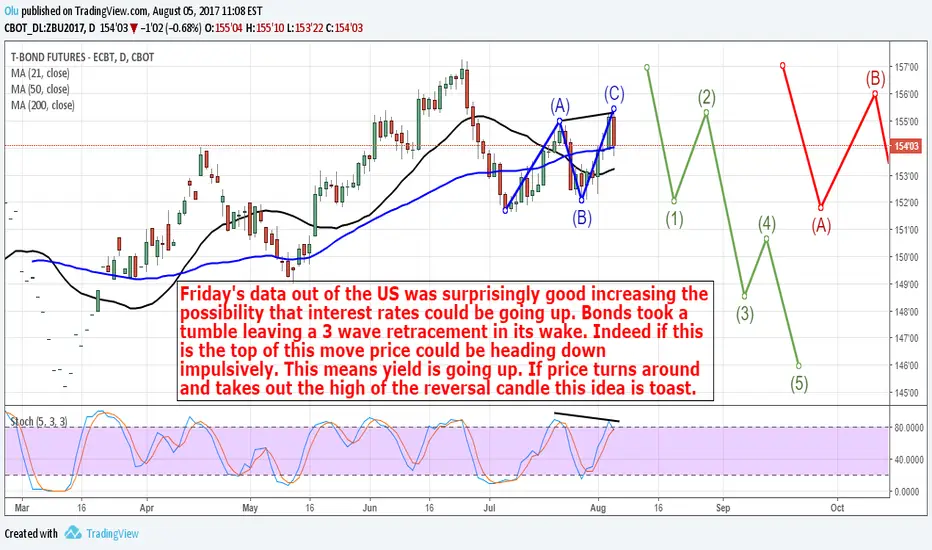
Bonds: If US Data Continues To Be Good Then Down We GoComments on the chart. There is bearish divergence on the chart as well. Whether this is the start of the wave 3 of a 5 wave impulse or a wave c of an abc correction it is still not looking good for bonds
Just an obsevation$ZB broke, and closed slightly above, a daily T/L...granted the T/L has minimal touches but...also TV has a continuous contract, so that could invalidate it too.

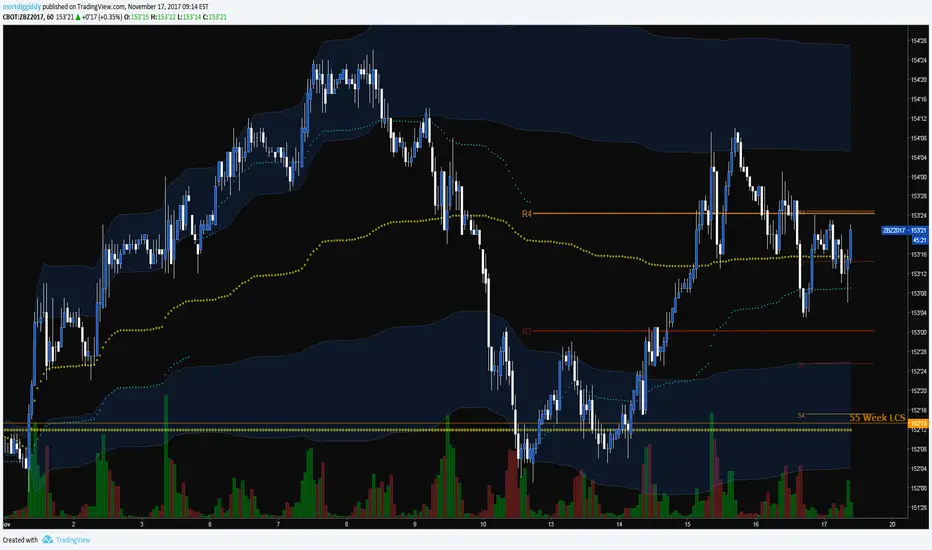
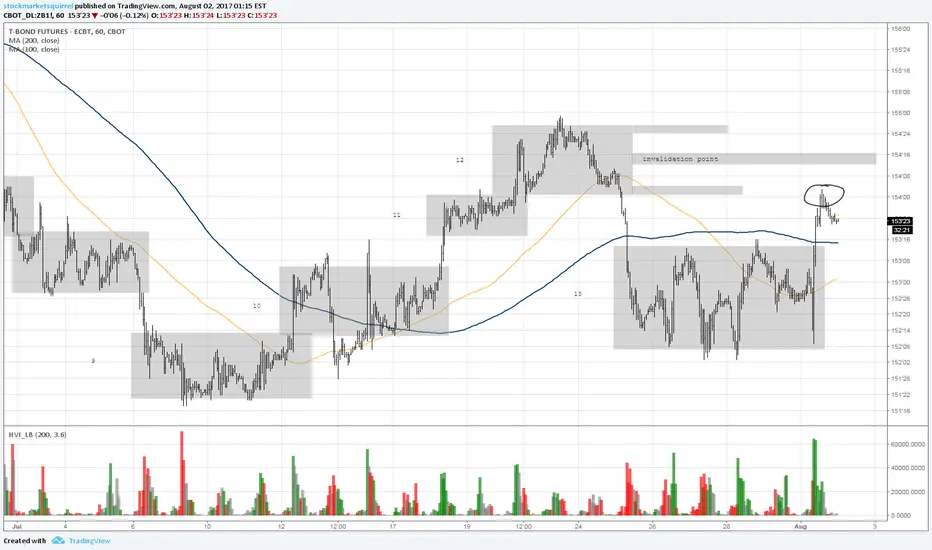
30yr Bond - ZB1!You can see that price is now outside balance area #13 and hit the low of #12 then rejected. The time spent in #13 was significant and i'll be watching to see where the new balance area/trend starts.
It's also worth noting that we sit above the 100sma and 200sma
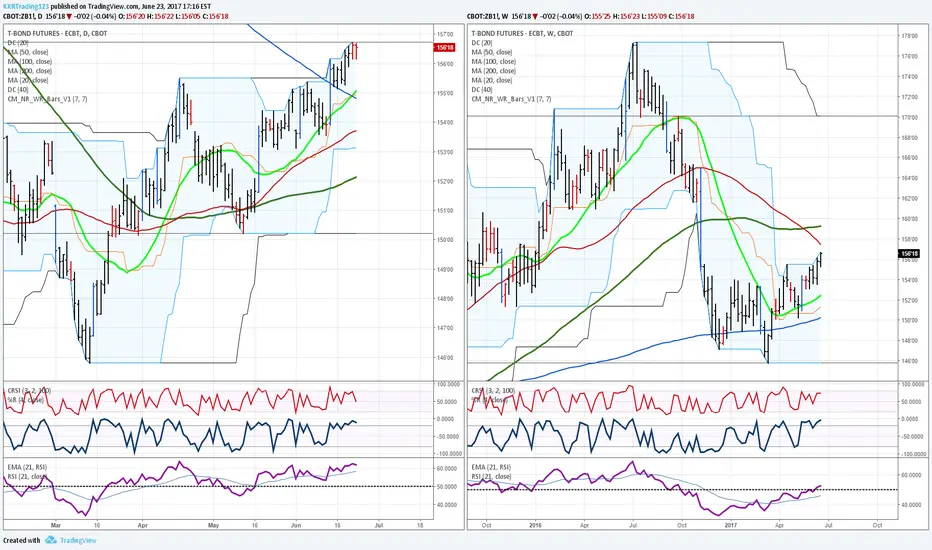
ZBU2017 - September T-Bond Futures - Daily and Weekly ReviewDAILY - Double NR7 is making T-Bonds look like there is a shorterm top in place. Trend is still up. Price > 20 (155'01),50,100,200 DMA, with all but the 200 in a positive slope. Strong moving average convergence in the 154'24-155'02 area. Looking to buy a pullback. Long end has been strong with the flattening of the yield curve, this is the current macro trend, anything here should be seen as an adjustment in the curve and profit taking.
WEEKLY - To the moon! Held the 200WkMA and have rallied nicely up from there. Above the 20WkMA as well. Also, the longterm RSI is above its moving average and crossed the 50 line with positive slope. First Resistance viewed at the 50/100WkMA area 158'08 and then the election drop point at 162'00. As in the daily, the macro economics of the flattening yield curve with even some pundits talking inverted should keep the trade in an up trend. As traders watch price action and keep an eye on the TLT as it has a projection point of 131 right now which would line up with the $ZB_F getting to the 160+ area.

$ZB LongBuy $ZB ONLY if it trades 152'28-153'02 range. Stop is 151'28. Target 154. Will be adjusted to today's close if we reach that target before today's close.

Guarded by a dragon?As one of my friends requested, I have made a graphical representation for him.
For several days, we can see that this Bond has been consolidating within the daily resistance and the monthly support. Just a few days ago, the Bond has broken above this consolidation mode. However, as seen on the graph, this may be a false breakout as this has occurred before thus making that area as the 'temporary' daily resistance.
Watch this pair closely!

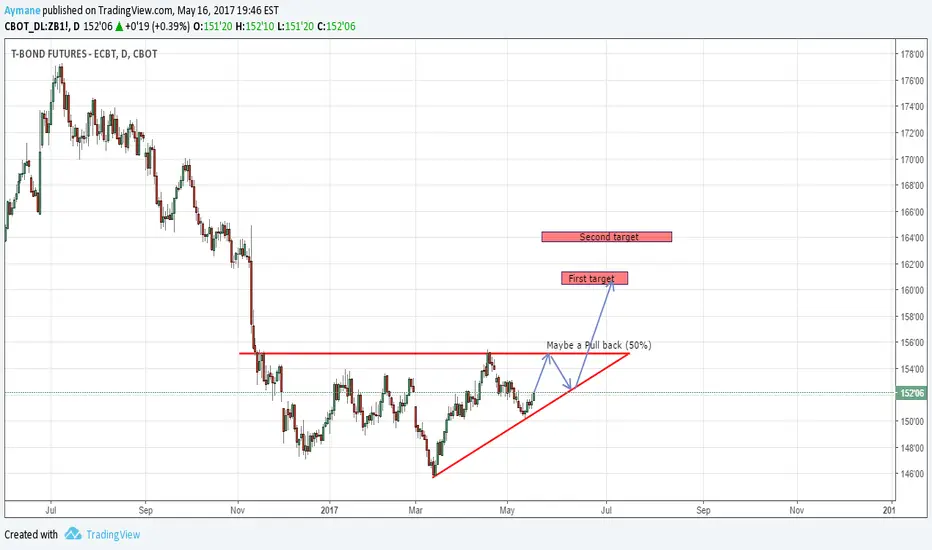
ZB Future prediction for the next 3 monthZB is maybe going up you can play an agresive trading or just wait for the true signal !!
Short BondsLooking more on the downside to Monthly S3 which is also the 145 big number before a bounce
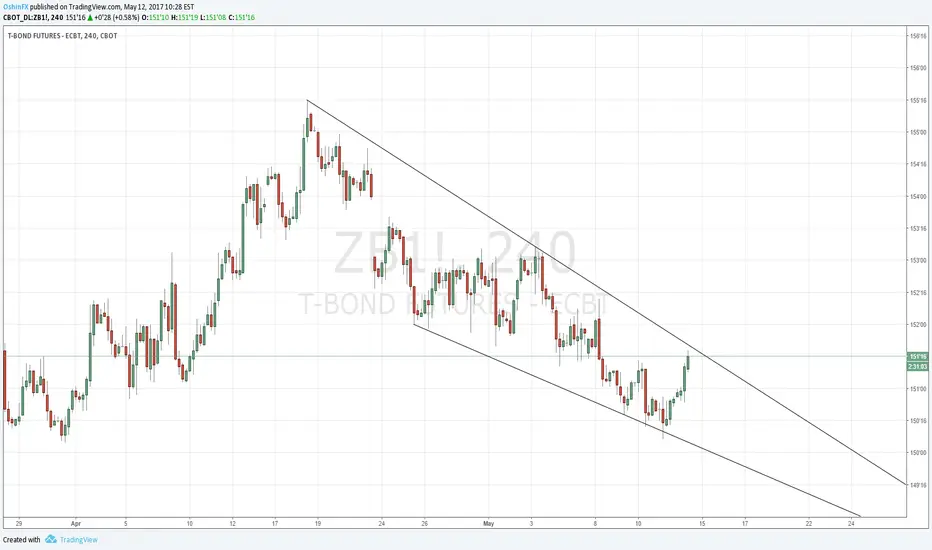
Trend-follow signals : ZB1! (60min)If you are a trend following trader, find instruments and timeframes that satisfy your trending criteria and just follow the signals. But remember:
consolidation period can be brutal to a trend following strategy. Also, the longer the trend, the greater the chance for a reversal.
With that in mind, make sure you apply proper money management.

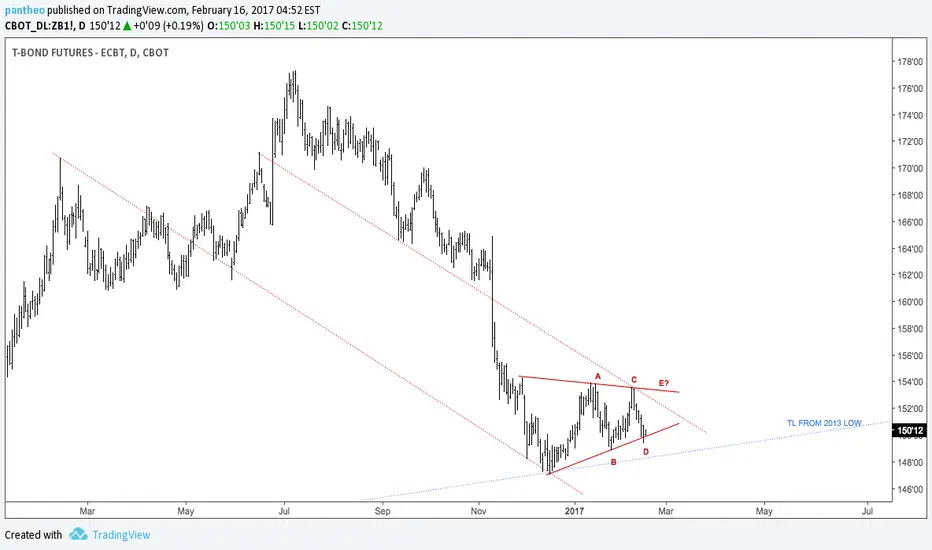
Symmetrical triangle broke down in 30Y bond $ZB_F, $EURUSDContinuation pattern foretold dollar strength $DXY

30 Year Treasury REVERSE $ZB_F $TLT $ZB1! #bonds #futures #forexWe are getting the beginnings of our Harmonic Breakout to upside this AM. Targets Shown on Chart.

$ZB_F T bond in symmetrical triangleThis has to resolve first to end the chop festival $DXY, $EURUSD