ZL1! trade ideas

Over Extension on Soybean OilExecutive Summary
RSI Overbought - Last time the RSI sat above 70 on the weekly was first week October 2011 through early November, where the price tried multiple times for +$60 and some change. Failed to $47, looking for the same sort of retracement. Negative Divergence.
Volume - High new volume this past week. My thoughts are sellers taking their profit alongside with RSI.
Outside Upper Keltner Channel - Riding outside Keltner channel as well as 2SD of price. A retracement is coming.
Description
My thought is that we are overextended here. Yes we have gone parabolic, but Last time RSI surpassed 70 on the weekly, let alone the daily, was October 2011. We saw a $20 drop from 60 to about 40 and there has been a continuous bear before then. Price is going to regress to the mean looking at the keltner channel and how we are outside 2 SD of price.
The more fascinating piece is the new onset volume we are seeing. This came about last week - and will be interesting to see how traders are headed this route.
(Hypothetical) Fundamental Thoughts
The USA is the top Exporter in Soybean and Soybean oil, especially as alternatives to protein intake - outside of typical animal produce - may become more popular. Hurricanes have left these states mainly unaffected.
Short payout is 2:1 reward/risk

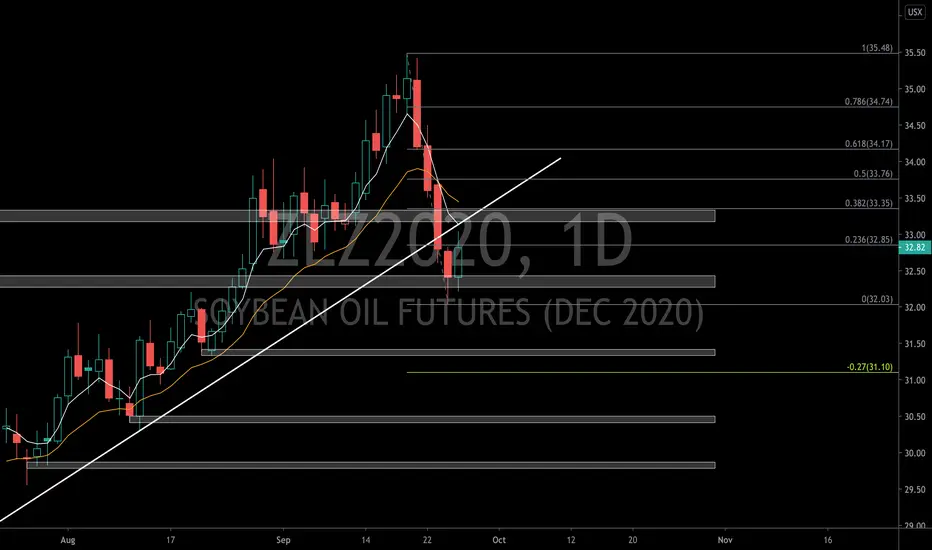
Soybean Oil Futures 28/9 - 2/10My view on the upcoming week trading idea.
1. On Daily chart, we can see that price have already move from the highest price to lowest at around 300 ticks of movement where we can label and classify the movement as the first wave of movement. The move is very strong as I see that had end the long bullish movement before this, this, supported with the break of the bullish uptrend trendline.
2. Price is making a pullback to a resistance and fibonacci level where price may continue to dive down to a new level of low. Price action on those key level is essential before we make any trading decision. I see that we can collect few ticks for a buy before placing a position of short to enjoy the third wave of price movement.
100vs32 SOYBEAN OILAs far as i can see, what i can conclude...
1. The bullish harmonic pattern appears gives the price a probability to reverse.
2. The blue line is my entry point.
3. The red line for my stop loss decision (32pts)
4. TP for 100pts.
Well back to your trading plan guys, this is not a buy call. It's just to share what i saw.
You've got any thoughts to share ? Drop it below !!
Trade at your own risk. All the best traders !


ZSN21-ZSK21The second good looking bear spread in soybeans complex. If you consider to trade both, i would either recomend to allocate your position between both 2 or just trade 1 on them. They tend to behave similliar, so it is not wise to trade correlated assets and manage them as 2 standalone trades.
This soybeans oil spread is much less risky. Historical lowest prices were arround -0,2 which is about 150$ from current prices. That could be manage as position trade and do not put SL in to the market. But i strongly recommend everytone use SL. RRR is again over 2,2:1, which give us more chances to stay profitable even if my probability is below 50%. Since you follow all my trades, the probability is between 60-70%, but stay focused and trade on your own risk.
This trade seems good even for people with smaller account.
In the graph you can see marked SL below the recent low. It is a logical place where to put SL, if you do so.
Good luck to everyone

According to my experience. I expect a rise. Short term dealbuy order
I am not using take profit. And stop loss
If you want to exit the deal. right on time. you can contact me.
I welcome everyone

According to my experience. I expect a drop. Short term dealsell. short order
I am not using take profit. And stop loss
If you want to exit the deal. right on time. you can call me.
I welcome everyone

According to my experience. I expect a dropsell order
I am not using take profit. And stop loss
If you want to exit the deal. right on time. you can call me.
I welcome everyone

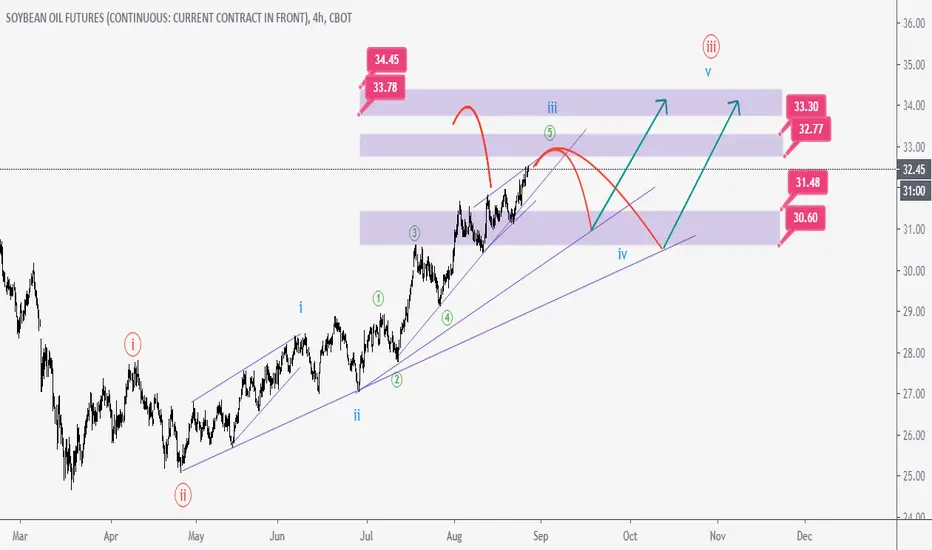
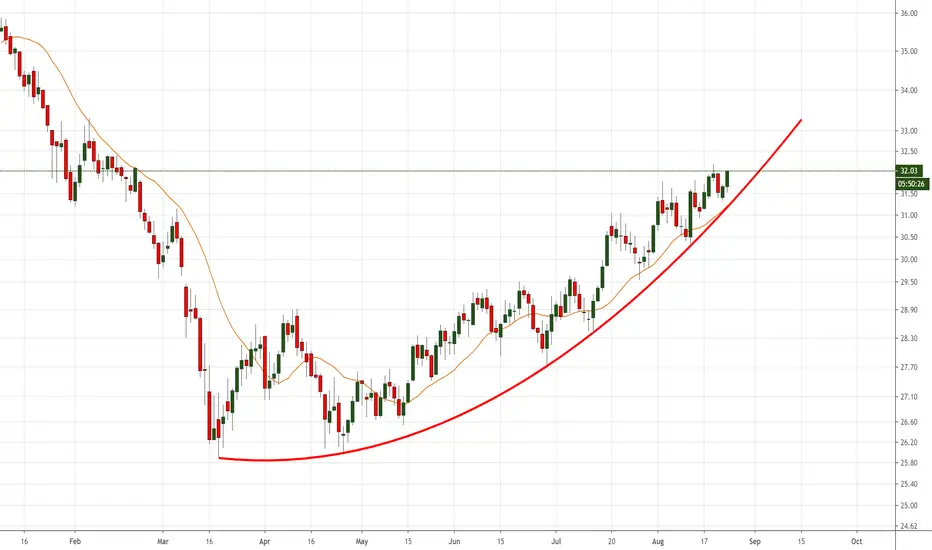
Parabolic advance in Soybean OilNot often we see parabolic curves in traditional commodity markets. It will be interesting to see if the parabola continues or if the chart morphs into something else

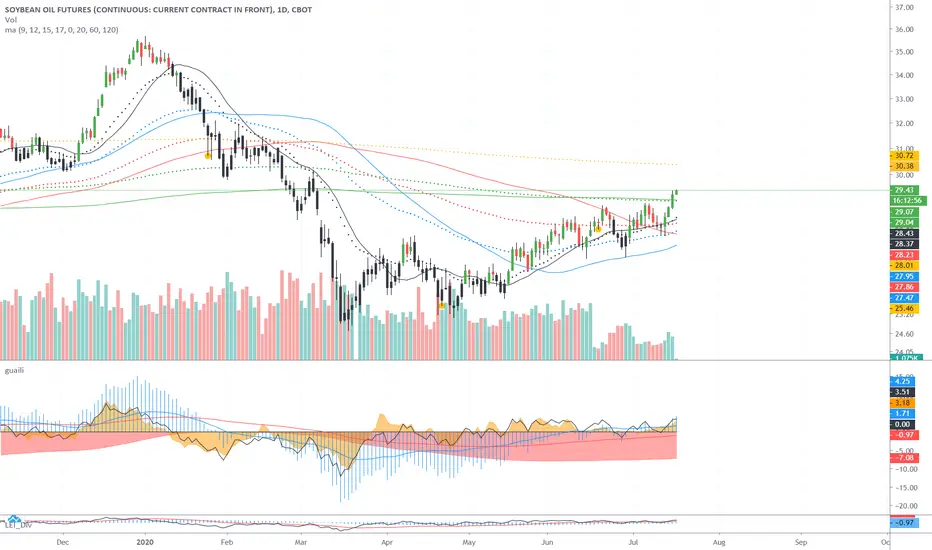
SOYBEAN OIL 16/08/2020Tend to soybean oil slightly decrease next week.
Decreased with RSI divergence.

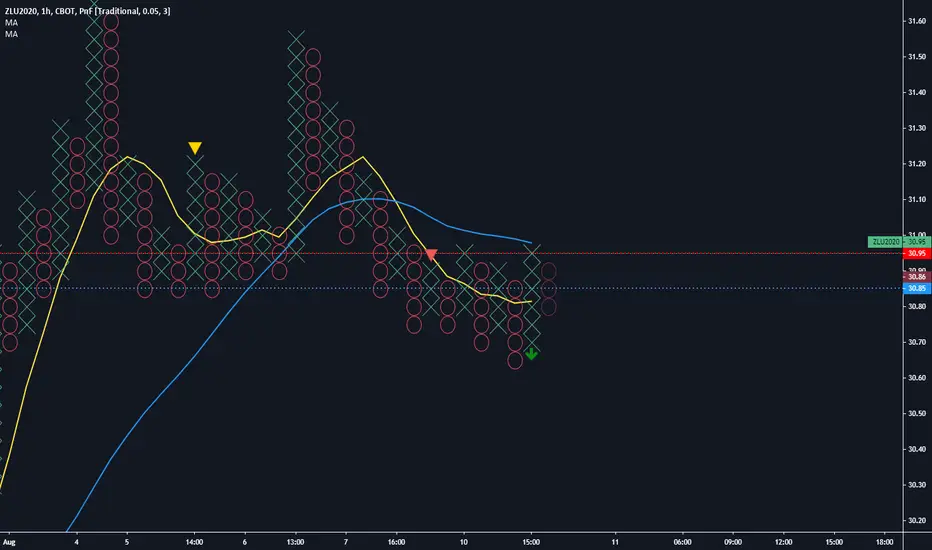

Soybean Oil PnF Trade Short or LongNice opportunity to go short or long.
Bias: Long trend
Small short trade to the downside.
Or continuation long.
Thanks
Holm

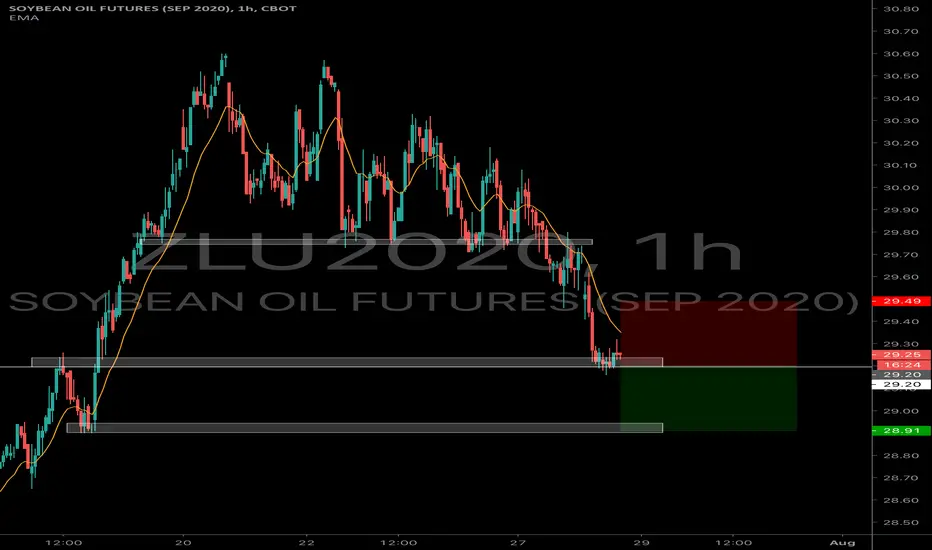
Downward movement of Soybean oil FuturesAs market is still in bearish bias, price is testing the support level of 29.20. Downward movement is still expected for price to test the next support level.


Waiting for breakoutlong sideways, the price will move in the sideways range until it breaks support or resistance.
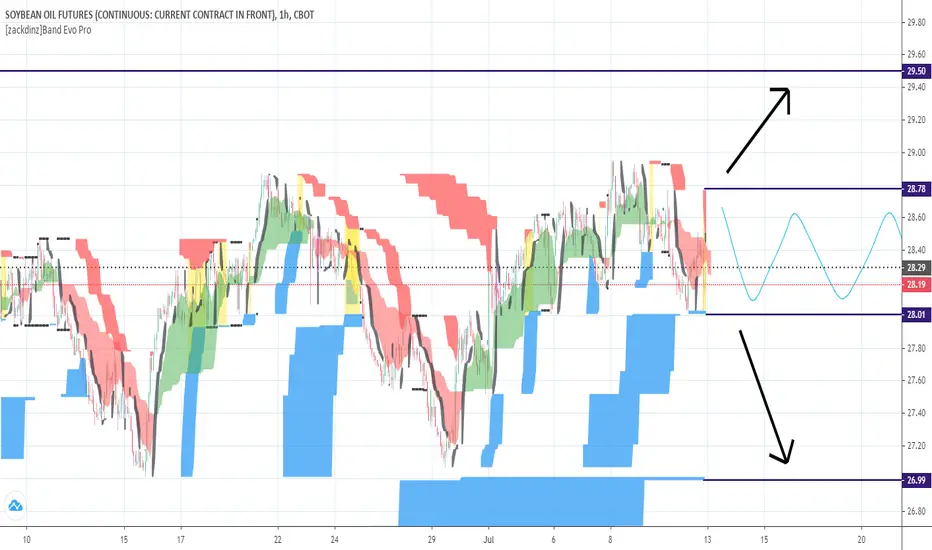
Next moveAfter breakout, price move until resistance level. If it can not break the resistance it will go down.
