Bean Oil I like buying Soybean Oil here around 49.90 July Contract. 48.86 December.
1. Big correction through harvest season.
2. Seasonally bottoms late nov- December
3. La Nina to El Nino--- no good for growing conditions.
www.usda.gov
4. Chart pattern I like.
ZL1! trade ideas
a Pullback Rally or Continue Its Decline without correction?As we can see, soybean oil closed at the level of 49.17 and has made a lower low compared to the previous low.
So, my expectation is that the price will continue its downward trend until it reaches the daily support level around 47.50 .
However,
Before this decline occurs, I anticipate a pullback in price, possibly rising to the price zone of 50.91 or even reaching 51.00 before experiencing a decline to the 47.50 level, as mentioned earlier.
In any case, you need to ensure proper risk management and consider micro and macroeconomic fundamentals when participating in this market movement.

Will soy reach a price of 53.49?As you can see, this increase is temporary in nature because the overall trend is still in a downtrend. So, my expectation for now is that soy prices will climb until they reach the daily resistance zone around 53.50 (as indicated by the red box drawn).
It is anticipated that the price will experience a decline upon reaching this level because this zone can be considered quite strong since it hasn't been touched yet.
This decline is supported by the fact that soy prices have broken the previous low of 52.08 and are expected to drop to the daily support zone around 50.47 to 50.17.

ZLF2023 - SOYBEAN OIL JANUARY 2023Elliot waves impulsive forecast trial
I use fib time & trend to predict waves time & price lengths.
Despite this Monday 28th Nov bull opening, I still beleive wave 2 shall find a lower price by end of the session and shall price the low most probably druing overnight session before starting wave 3 tomorro tuesday 29thof Nov.
If I am wrong, wave 2 was finished when touhed 70.27,meanign wave 3 started. Iwoudl update graph tomorrow
This NOT a trading advice and my first publication. pls be good..

Looking for buyers in a number of markets10.6.23 A number of markets have traded to the end of their ABCD patterns going lower and are coming to support areas. I did a review of four to six markets some of which I've never traded or haven't traded for years.... just to look at the patterns and look for reversals.


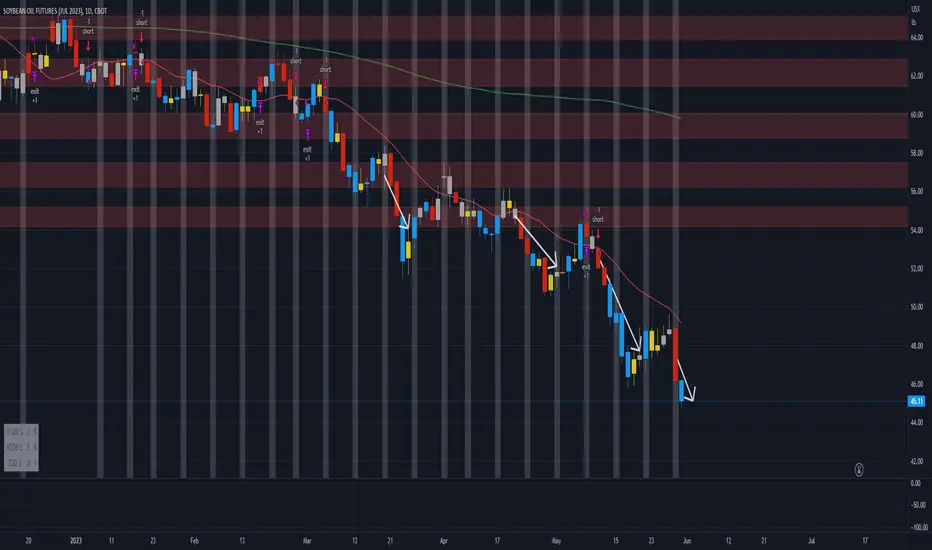
like last monday the FVG short setups on soybean oil are goodnotice how clever it is to enter at 30 min FVG entry spots if there is a clear downtrend on the daily chart

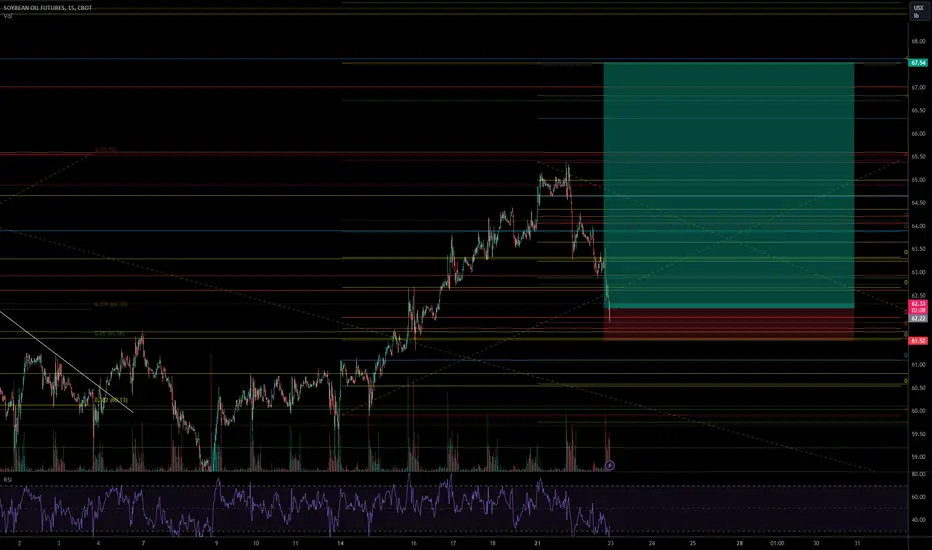
Soybean maybe in long positionSoybean looks to test the resistance at 65.40-65.46. if failed , then maybe go back to support at 59.67-59.60 area.

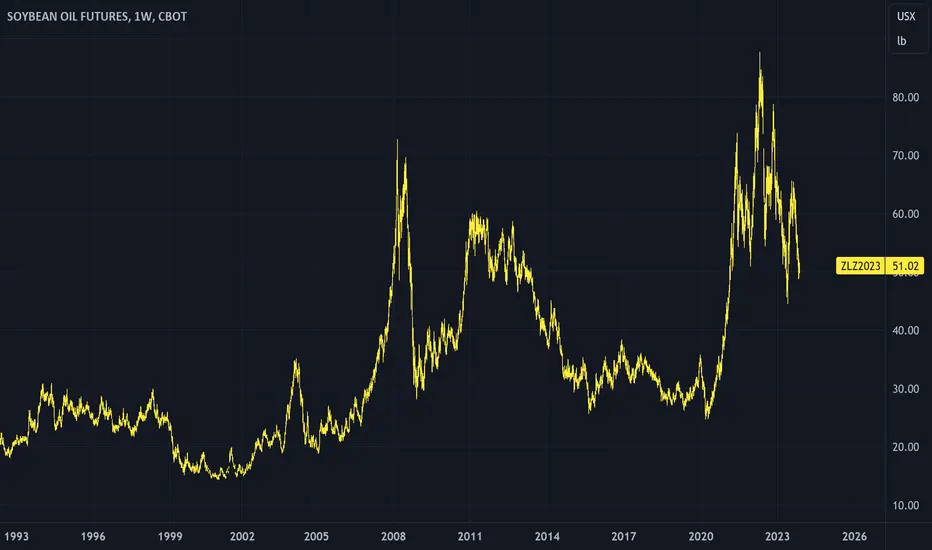
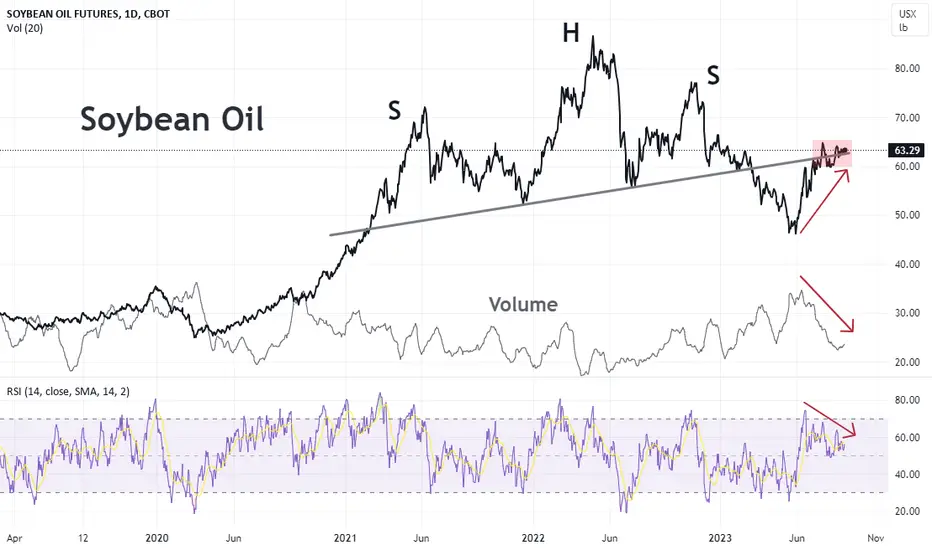
A technical overview of Soybean Oil
Since our last analysis of Soybean Oil, the commodity has completed its head and shoulders pattern, now trading at the resistance formed by the previous neckline. Concurrently, we observe an RSI divergence, where the RSI prints lower highs while the prices chart higher highs. This divergence is generally viewed as a bearish indicator, hinting at possible price declines. When paired with decreasing volume, the case for price exhaustion at this juncture becomes more compelling.
The Price & Volume Profile chart serves as another essential tool in pinpointing critical zones. The highlighted POC (‘point of control’) zone represents the price level with the highest frequency of trades. Historically, this has acted as a pivotal support and resistance level for Soybean Oil, demarcating regions of consolidation before prices venture either upwards or downwards. The chart also highlights the volume traded at the different levels as denoted by the volume number at the different price levels. Notably, the current price level showcases a significant volume zone, with the largest volume transacted there.
Looking at the 50 & 200-day moving averages we observe a golden cross which signifies bullishness. But not on the 100 & 200-day moving averages.
On a relative value basis, we can also compare Soybean Oil to its substitute, such as crude palm oil. Here we see 2 defined regimes pre-2021 and post-2021 where the ratio of the two products significantly increased, suggesting that Soybean Oil became relatively pricier than Crude Palm Oil. We have previously delved into this topic in our article “ Fading the Soybean Oil Premium ” where we anticipated a decline in this ratio. Subsequently, this ratio did correct to the 0.06 mark, only to experience a rapid rebound. This surge was attributed to Soybean Oil appreciating at a faster rate than Crude Palm Oil.
Another metric involves contrasting Soybean Oil with its upstream and downstream derivatives: Soybean and Soybean Meal. Once more, we see prices tending to move in tandem until 2021, after which the ratio of Soybean Oil to both Soybean Meal and Soybean underwent a marked shift. With the ratio's support distinctly outlined by pre-2021 resistance, this ratio can be wielded as a metric to identify when Soybean Oil is relatively overpriced compared to its up and downstream products.
In conclusion, a blend of technical indicators seems to point towards more downside for Soybean Oil, such as the RSI divergence and declining volume. Also, prices stuck in the POC have generally preceded breakouts and on a relative value basis, Soybean Oil seems over-extended. We can express this bearish view on soybean oil via a short position on the CME soybean Oil futures at the current level of 63.29, with a stop at 67.50 and take profit at 51.00. Prices are quoted in cents per pound and each $0.0001 increment per pound in the Soybean Oil futures contract is equal to 6.00$.
The charts above were generated using CME’s Real-Time data available on TradingView. Inspirante Trading Solutions is subscribed to both TradingView Premium and CME Real-time Market Data which allows us to identify trading set-ups in real-time and express our market opinions. If you have futures in your trading portfolio, you can check out on CME Group data plans available that suit your trading needs tradingview.sweetlogin.com
Disclaimer:
The contents in this Idea are intended for information purpose only and do not constitute investment recommendation or advice. Nor are they used to promote any specific products or services. They serve as an integral part of a case study to demonstrate fundamental concepts in risk management under given market scenarios. A full version of the disclaimer is available in our profile description.
Reference:
www.cmegroup.com
Soybean TF 15mSoybean Time Frame 15m
Hai traders now what you see on chart
Just follow the directions and react
Now you can see what market doing
#soybeanoilfutures
#TAYOR
#thisonlyforprediction
#notforbuyornotforsell
#MFM.TRADER
ZL1! LONG OF THE YEAR!whatsup! patiently waiting for the price to get into my zone and looking for longs. best rrr

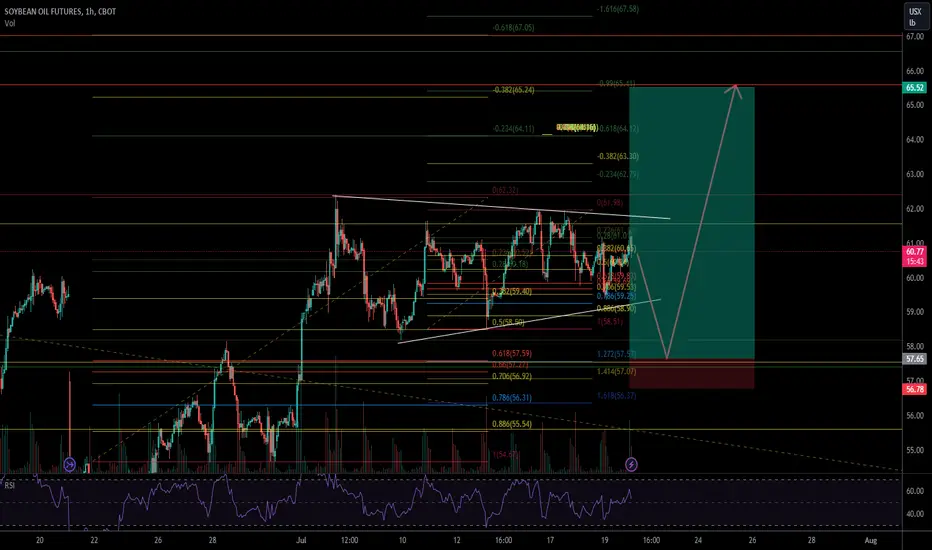
Long ZLZ23 at Market; Target 65.48, Stop Loss 58.70December Soybean Oil long bias based on technical indicators and supply/demand projections going into harvest season.
ZL1! LOOKING FOR LONGS. UPTREND CONTINUATIONnow price is making a pullback at CC level after fail to make a new high. looking for longs here and take profits after breaking new high
ZL1! looking for longslooking for longs at fibs area (after taking out trendline liquidity). not looking for shorts at the moment cause price can just break out from this ascending triangle.
ZL1! bullish the final dipas usual, got my levels from fib numbers, i think this is the last up move before we go down hard

ZL LOOKING FOR MY LAST LONGstructure still uptrend. looking for longs until taking out the liquidity above

ZL1 LOOKING FOR SHORTS. WE BATH OIL!WHY?
1. structure still downtrend
2. looking for shorts at (3) area. confluence with fibo area 0.5 + previous demand turns supply area( red arrow)
3. target price :
- no 1 previous resistance double top (yellow arrow) before the huge pump
- no 2 final target price which is SNR area from 2015 till 2020 . + confluence with 0.886 fibo and also 0.382 fibo extension

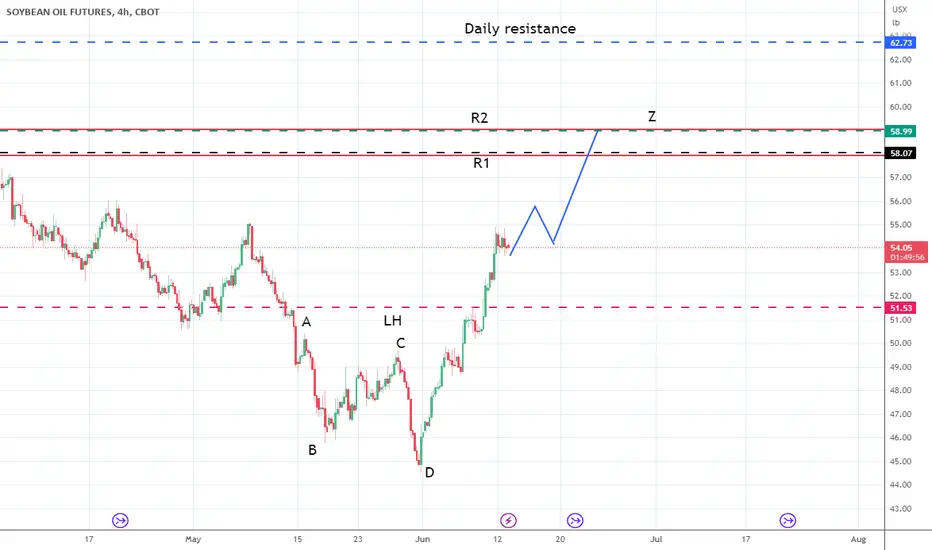
Bullish Trend for Soybean oil After the price breaks LH I see the market will continue bullish and can reach resistance Z@R1 or R1...if breaks Z with a strong candle I think the price can go to daily resistance...If not maybe the price will go down back for a pullback
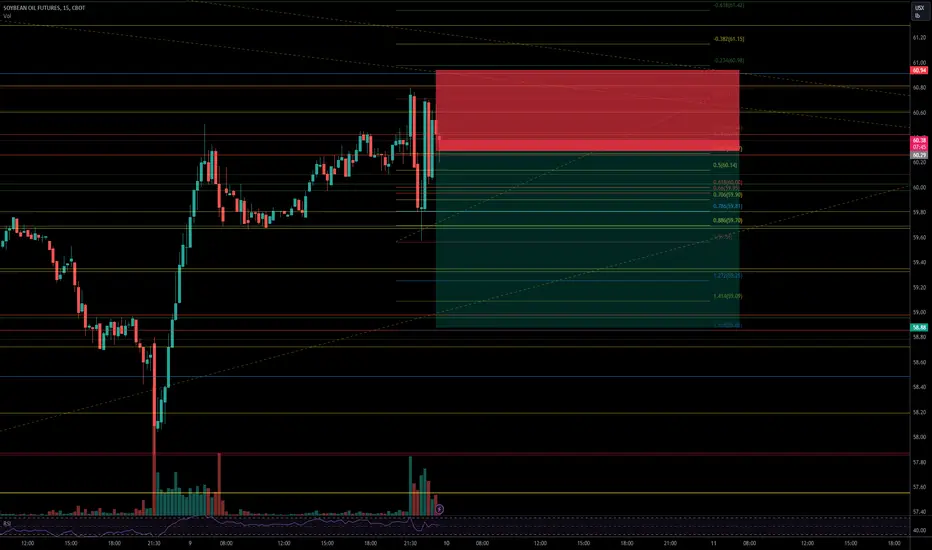
SOYBEAN OIL LOOKING FOR SHORTStarget previous demand area before the rally years back. swing position means give a bit room for stoploss. lets shower in oil bois
eh if want to enter please wait for confirmation on lower tf. look for shift in market structure.
the chart given is solely based on fibo ratio which doesnt give confirmation that market will continue downwards

ZL soybean oil Seen ZL bullish for a few days, maybe will have a correction before bullish again. watch for the zone in H4

Soybean oil still shortanother entry was below the inside day of last wednesday
now i am trailing the stop to get out of the short position above prior days high.
Soybean Oil FuturesMultiple resistance levels got penetrated alerting us that the price will be looking to head higher. Then an inverted formation showed up with the price breaking through confirming a move higher! Lots of confirmation from other times frames telling us the same thing, prices will be heading for higher ground!!!
