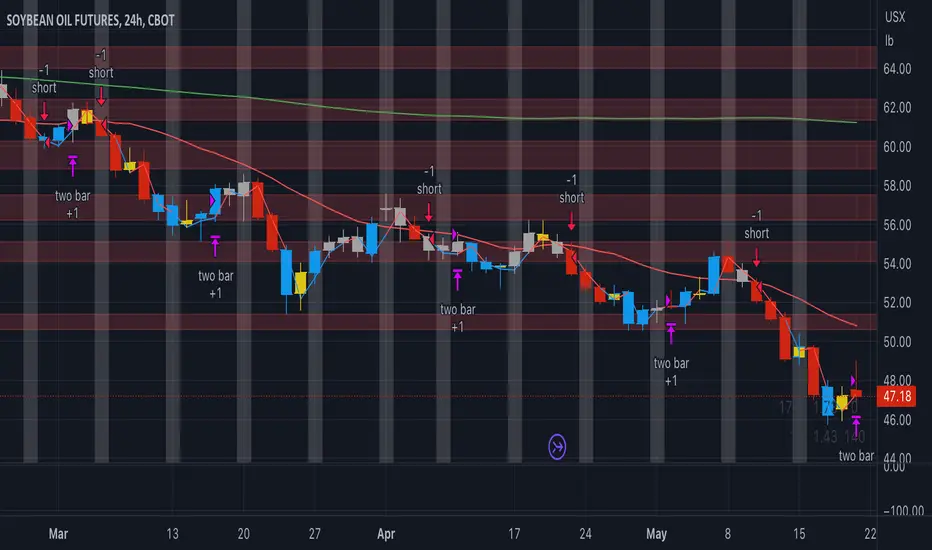
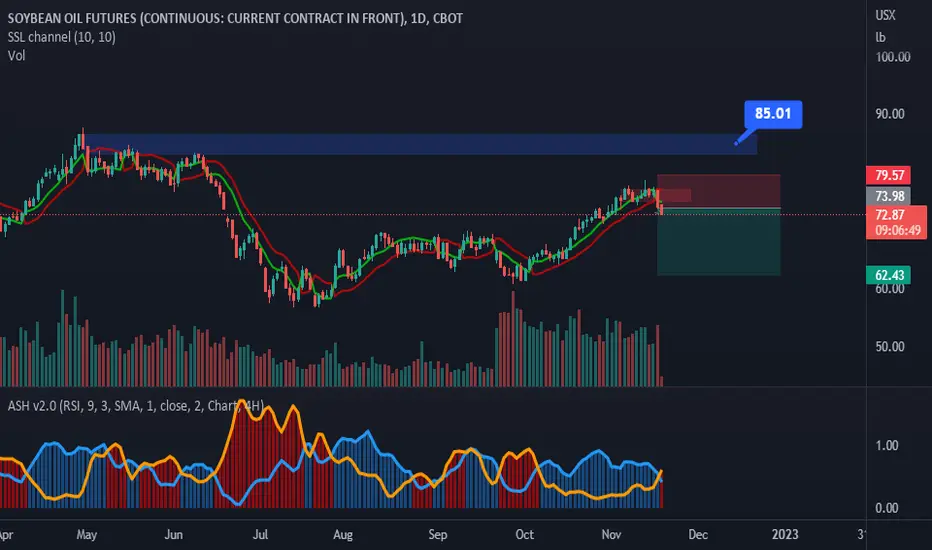
Looking forward to see chatcpt integrated in tradingviewMy first question would be: which futures market should i trade next week?
The answer must have been SHORT soybean oil, low risk high reward when you enter in trend direction.
My second question would have been: when to take profits?: an Ai will always give you this answer: when the exit condition generated the most profits in the past, which was in case of soybean oil a trailing stop for a short trade at highest high of prior two days
ZL1! trade ideas
Trading with Soybeans, Soybean Meal and Soybean Oil FuturesCBOT: Soybean ( CBOT:ZS1! ), Soybean Meal ( CBOT:ZM1! ), Soybean Oil ( CBOT:ZL1! )
This is the second installment on CBOT Soybean Complex. If you have not read the first piece, please click the link at the end of this idea.
Let’s start with a discussion of two reports followed by soybean market participants.
The Crop Report
U.S. Department of Agriculture (USDA) closely monitors agricultural market conditions and publishes the monthly World Agricultural Supply and Demand Estimates (WASDE).
WASDE, commonly known as the Crop Report, provides a global view of key agricultural products including wheat, rice, coarse grains (corn, barley, sorghum, and oats), oilseeds (soybeans, rapeseed, palm), cotton, sugar, meat, poultry, eggs, and milk. The Crop Report is the most important report followed by agricultural commodities traders.
What’s the key takeaway from the April 2023 Crop Report on Oilseeds?
U.S. soybean supply and use forecasts for 2022/23 are unchanged. However, relative to 2020/21, planted acreage is higher while export is lower. Global 2022/23 soybean supply and demand forecasts on lower production, crush, and exports. Global production in current crop year is reduced by 5.5 million tons.
Overall, the April WASDE shows plentiful supply, weakened demand and higher inventory, the recipe for price trending down.
CFTC COT Report
Commodity Futures Trading Commission (CFTC) publishes the Commitments of Traders (COT) reports and provides a breakdown of open interest for futures and options markets. It categorizes the reportable open interest positions into four classifications:
• Producer/Merchant/Processor/User: An entity that predominantly engages in the production, processing, packing, or handling of a physical commodity and uses the futures markets to manage or hedge risks associated with those activities.
• Swap Dealers: An entity that deals in swaps for a commodity and uses the futures markets to manage or hedge the risk associated with those swap transactions.
• Managed Money: Commodity trading advisor (CTA) or Commodity pool operator (CPO). They are engaged in organized futures trading on behalf of clients.
• Other Reportable: Every other reportable trader that is not placed above.
What’s the key takeaway from the May 2nd COT report on Soybean/Meal/Oil Futures?
o Soybean futures ZS open Interest: 601,051, down 4.7% from previous week;
o Managed Money increased ZS short position by 80.1%; their long/short ratio is 2.1. Note that the ratio was 8.3 on April 18th. This indicates that speculative traders are no longer bullish on soybeans.
o Soybean Meal ZM open Interest: 408,013, down 2.9% from previous week;
o Managed Money decreased ZM long position by 22.3%; their long/short ratio is 3.7. Note that the ratio was 7.9 on April 18th. Again, this is a bearish signal.
o Soybean Oil ZL open Interest: 472,547, up 0.6% from previous week;
o Managed Money increased both long and short positions modestly; their long/short ratio is 0.7, the same with April 18th.
Popular Soybeans Futures Trading Strategies – Explanation and Illustration
There are different types of traders in the soybean futures market: Producers, Grain Elevator (Storer), Processor, Livestock Farmer (User), and non-commercial traders.
We will discuss how they use the futures market, each with a hypothetical trade example for illustration purpose.
Investor
Non-commercial traders are not participants in the soybean industry. They hold a market view and hope to profit from such view through futures trading. Investors could draw ideas from futures price chart, the Crop Report, and other relevant market information.
Case study #1: Directional Trade with Stop Loss
Market information
1) April WASDE shows plentiful supply, weakened demand and higher inventory;
2) Following the release of WASDE, soybean price has been trending down;
3) News surfaced that Smithfield, the largest US hog producer, plans to liquidate 10% of its sow. This indicates lower soybean meal demand in the future.
Trade Setup
To express his market view, on May 10th, a trader sells one July 2023 contract (ZSN3) at 1412’6/bushel ($14.1275), which gives the contract a notion value of $70,637.5. He deposits $5,000 margin on his futures account. At 7.1% of the cost, he participates in the price exposure for 5,000 bushels of soybeans. The use of leverage, in this case by 14.1 times, is an advantage of cost-effective trading with futures contracts.
Potential Profit and Loss
1) In June, ZSN3 declines to 1350’0 ($13.50), the trader would gain $3,137.5 = ($14.1275-$13.50) x 5,000. Using the original margin deposit as a cost base, this short futures trade would potentially realize 63% profit, excluding trading fees;
2) If the soybean market rallies to 1480’0 ($14.80), the trader would lose $3,362.5, or a return of -67%;
3) Our trader could set a stop loss at 1450’0 ($14.50), to cap the maximum loss at $1,862.5 and avoid margin calls.
An outright trade with futures contract allows the trader to profit from a correct market view. Leverage built into futures could significantly enhance the profitability, while stop-loss could limit the exposure if the view proven to be incorrect.
Soybean Farmer and the Production Hedge
When a US soybean farmer plants the crops in April, he is said to have a Long Cash position. The farmer is exposed to the risk of falling soybean prices during the November harvest season. To hedge the price risk, our farmer could enter a Short Futures position now, and buy back the futures when he is ready to sell the crops.
The effective sales price equals spot price in November plus gain/loss in the short futures position. Since the cash market and futures market are highly correlated, loss (gain) in the cash market will be largely offset by the gain (loss) in the futures market.
Case study #2: Production Hedge (Short Hedge)
Market information
1) The farmer planted 1,000 acres of soybeans in his Central Illinois farm;
2) Total production cost per acre is estimated at $859, which includes variable costs (seed, fertilizer, pesticide), overhead (building, storage, machinery) and land;
3) Yield per acre is estimated at 69 bushels. His cost per bushel will be $12.45;
Trade Setup
On May 10th, ZSX3 is quoted at 1254’2 ($12.5425). The farmer expects to sell 69,000 bushels. Since each ZS contract has a notional of 5,000, he needs to sell 14 lots of ZS contracts. Soybean basis in Greene County, Illinois is estimated at $0.20.
The Hedging Effect
1) The farmer effectively locks in the sales price in April for his November soybean crop at: $12.5425 (futures) + $0.20 (basis) = $12.7425;
2) Production hedge helps our farmer to protect a profit margin of 29.25 cents =($12.7425 - $12.45) per bushel, or $20,182.5 for his entire crops.
The farmer is left with basis risk. In the context of commodity futures trading, basis refers to the difference between the spot price of a commodity and the price of a futures contract for that same commodity. Basis risk is usually smaller than outright price risk.
Grain Elevator and Futures Rollover Strategy
After the crop is harvested, farmers or merchandisers usually store the soybeans in a grain elevator and wait for the right time and price to sell. Soybeans could be stored for a year but would incur monthly storage costs. The decision to store depends on whether expected future price gains outweigh the storage costs.
A merchandizer is exposed to the risk of falling soybean price, which would cause his soybean inventory (old crop) to decline in value. To hedge the price risk, he could employ a rolling futures strategy.
Case study #3: Rollover Front-month Soybean Futures
“Rollover” refers to the process of closing out all positions in soon-to-expire futures contracts and opening contracts in newly formed contracts. The rollover process impacts market volatility, prices, and volume.
Trade Setup
1) Sell 14 lots of July contract ZSN3 at 1412’6 ($14.1275) on May 10th;
2) At any point before expiration, if we decide to sell soybeans in the spot market, we could exit our futures position by buying 14 lots of ZSN3 at prevailing price;
3) If we plan to hold our inventory for a longer period, we will buy back ZSN3, and simultaneously sell 14 lots of August contract (ZSQ3);
4) ZSQ3 is quoted 1345’4 ($13.455) on May 10th. If you hold the soybean from July to August, you will incur extra storage cost, but would get 67.25 cent less per bushel. This is clearly very bearish.
The Hedging Effect: Rolling futures positions allows our merchandizer to extend his hedge beyond original futures expiration.
You may ask, why not use a longer-dated contract to begin with, say July 2024? This is because the front month contract is usually more liquid. It is easier to put the hedge on and off quickly. By sticking with liquid nearby contracts, we could avoid the cost of price slippage generally associated with less liquid deferred contracts.
Soybean Processor and the Board Crush
In soybean industry, “crush spread” is the market value of meal and oil byproducts subtracted by the cost of raw soybeans. In the cash market, the relationship between prices is commonly referred to as the Gross Processing Margin (GPM).
In the futures market, the crush value is an inter-commodity spread transaction in which Soybean futures are bought (or sold) and Soybean Meal and Soybean Oil futures are sold (or bought). Soybean crush spread is also called the Board Crush.
Case study #4: Soybean Crush Spread
Trade Setup
1) The November-December Board Crush (buying November Soybean futures and selling December Soybean Meal futures and December Soybean Oil futures) is used to hedge new-crop gross processing margins;
2) CME Group facilitates the board crush that consists of a total of 30 contracts: 10 Soybean, 11 Soybean Meal, and 9 Soybean Oil;
3) Implied Soybean Crush (SOM: Z3-Z3-X3) is quoted at 172’6 ($1.7275) on May 10th. Each contract has a notional of 50,000 bushels and is currently priced at $86,375;
4) If we process 100,000 bushels a month, we would short 2 board crushes. On May 10th, the margin for this spread is $1,650 each.
The Hedging Effect: Board Crush enables processors to lock in his operating profit.
Livestock Farmer (Soybean User) and the Hog Feeding Spread
Livestock farmers buy corn, soybean meal and other ingredients to produce animal feed. For example, hog farmers’ gross profit is represented by gross feeding margin, also known as the hog feeding spread, which is the value of lean hog less the cost of weaned pig, corn, and soybean meal. Therefore, hog farmers are exposed to the risk of rising ingredient costs. To manage price risks, they could trade the hog feeding spread, which isa long hedge by selling CME lean hog futures (HE) and buying CBOT corn (ZC) and soybean meal (ZM) futures. A typical hog feeding spread is expressed as:
Hog Feeding Spread = 7 x HE – 3 x ZC – 1 x ZM
Case study #5: Hog Feeding Spread
Market information
1) USDA daily hog and pork report shows that cash market hog price averaged $73.59/cwt nationwide on May 9th, up 78 cents from prior week;
2) Cash hog is down 31.4% year-over-year. However, it seemed to bottom at $66 in mid-April and rebounded after the news of Smithfield sow liquidation.
3) Our farmer expects hog prices to rise faster than feed prices in the next few months. To capture an expanding margin, he plans to long the hog spread.
Trade Setup: For every 280,000 pounds of lean hogs (approximately 1,120 pigs):
• Long 7 lean hogs futures HEM3 at 0.84575/lb., giving a total notional value of $236,810, as each contract has 40,000 pounds (lb.);
• Short 3 corn futures ZCK3 at 646’4 ($6.465)/bushel. Each ZC contract has 5,000 bushels of corn, leaving this leg of trade at $96,975;
• Short 1 soybean meal futures ZMK3 at $415.0/short ton. Each ZM contract has 100 short tons of soybean meal, leaving this leg of trade at $41,500;
• The combined total, $98,335, represents the gross margin of raising 1,120 hogs, or about $87.8 per pig.
The Hedging Effect: It takes 5 months to grow a piglet to marketable weight. Factoring in breeding sows, the full production cycle for hog farmers could last 1-1/2 years. Pork prices and feed costs could vary significantly during this period. Hog Feeding Spread enables hog producers to lock in their operating profit.
Spread Trading in CBOT Soybean Oil and BMD Crude Palm Oil
Vegetable oils are the most crucial cooking ingredients in the world. Soybean oil and palm oil dominate the global edible oil marketplace with 2/3 of market share. Soybean oil and palm oil are considered substitute goods because food processors often switch between the two as the prices fluctuate.
Soybean oil and palm oil are driven by different market fundamentals. World soybean production is centered mostly in the U.S., Brazil and Argentina, and most palm oil comes from Indonesia and Malaysia. A drought in the U.S. or in South America could drastically alter soybean oil supply one year, while disease in Southeast Asia could affect palm oil supply the next year. This can create tremendous volatility in the spread relationship.
The CBOT Soybean Oil futures (ZL) consists of 60,000 pounds, equivalent to 27.22 metric tons. The BMD Crude Palm Oil (FCPO) futures contract is 25 metric tons (mt).
Case study #6: Soybean Oil/Palm Oil Spread
Observation: Soybean oil and palm oil markets have been in decline since July 2022. In the past two months, soybean oil drops by a faster rate compared to palm oil.
There could be plausible cause for the abnormal trend. However, if the relationship were to reverses back to normal, the spread will be enlarged.
If an investor holds this view, he could long the spread by buying CBOT soybean oil and selling BMD crude palm oil.
Trade Setup
• Provided ZL at $0.5255/lb. and FCPO at MYR 3570/mt with prevailing USD/MYR exchange rate at 4.46, the ZL/FCPO spread could be derived at:
• ZL = $0.5255 (per lb.) x 2204.622 (lbs. per mt) = $1,158/mt
• FCPO = MYR 3570 / 4.46 /mt= $800/mt
• ZL/ FCPO spread = $1,158/mt -$800/mt=$358/mt
Potential Profit and Loss
1) For an investor, a profit could be realized if the spread gets bigger. He would incur a loss if the spread narrows instead. The USD/MYR exchange rate could affect the trading result;
2) For commercial hedgers such as edible oil processors, hedging would allow them to maintain stable production formulas even though oilseed spot prices change unexpectedly.
Happy Trading.
Disclaimers
*Trade ideas cited above are for illustration only, as an integral part of a case study to demonstrate the fundamental concepts in risk management under the market scenarios being discussed. They shall not be construed as investment recommendations or advice. Nor are they used to promote any specific products, or services.
CME Real-time Market Data help identify trading set-ups and express my market views. If you have futures in your trading portfolio, you can check out on CME Group data plans available that suit your trading needs tradingview.sweetlogin.com

A Primer on Soybean Crush SpreadSoybeans are one of the most versatile and important agricultural commodities in the world, consumed extensively by humans, livestock, and industry. Soybean prices have an undeniable impact on the global economy and their importance is only increasing with the rapidly growing bio-diesel industry.
In our previous paper Heavy Exports Weighing Down Soybeans , we described factors affecting the supply of Soybean and their seasonality.
Supply is largely driven by harvest cycles and crop yields. Demand can shift for multiple reasons. Live stock feed, Cooking oil and Biodiesel form the largest demand source for Soybean. These are all derived from the two by-products of Soybean – Soybean Meal (“Meal”) and Soybean Oil (“Oil”)).
During Soybean processing, the seed is crushed to separate the oil from the meal. These by-products can be traded as separate commodities.
Traders can harvest gain from the shifting relationship between the by-products and soybean using the crush spread. This paper will describe the crush spread, its computational methodology, and the methods for investors to harvest gains from it. The paper will also look into the factors defining the crush spread in 2023.
The Crush Spread
The Soybean crush spread refers to the value of Soybean’s gross processing margin, which is the difference between the value of the outputs (Meal Price + Oil Price) and the value of the inputs (Soybean Price).
The crush spread is traded on the cash and futures markets and is often used by Soybean processors to hedge their margins for the actual process. It can also be used to harvest gains from the shifting dynamics between Soybean and its byproducts.
Factors That Affect the Spread
The crush spread can be influenced by the price of soybeans, the demand for its byproducts and the cost of production.
Production costs can vary due to energy prices, labor conditions, carryover stock, and health of supply chains.
Demand for by-products is driven by some common factors such as macro-economic conditions but also by factors unique to each commodity.
Meal is used for livestock feed while Oil is used as a cooking oil and as biodiesel.
Livestock feed demand is driven largely by China to feed its large swine population. Like soybean supply, feed demand also shows high seasonality. Due to a shortage of grass in the winter, Soybean Meal is consumed during these months leading to higher demand.
Additionally, unlike other commodities, Soy Meal cannot be stored for longer than 3 weeks. So, during the US harvest (October), Soy Meal prices plummet due to oversupply.
Cooking oil demand is sensitive to the supply and price of Palm oil, which is also widely used for cooking. Both can be used interchangeably; they are the so called substitute products. So, the decision of which product food producers choose depends on prices, supply, and import/export policy decisions.
Moreover, Soybean Oil is far more suitable for the production of biodiesel than Palm Oil. This is why Soybean Oil generally trades at a premium of $100-$150 tonnes to Palm Oil. In the US, Soybean Oil demand for biodiesel is even higher owing to a fast-growing renewable diesel industry.
Shifting Dynamics of Soybean By-Products
Downbeat Macro
With recession risks and inflation running high in many countries, the macro-economic outlook is downbeat. This weighs on the demand for Soybean and its by-products, resulting in lower prices and a narrowing spread.
China’s Reopening
China’s reopening from pandemic restrictions last year is in full swing. Although initial recovery was sharp, conditions have started to cool due to downbeat macroeconomic conditions weighing on export demand and still weak domestic demand.
China’s large swine population is a major driver of meal demand. Heading into the winter, in case domestic demand starts to recover, it would lead to far higher meal demand and prices resulting in a narrowing spread.
Rising Demand for Soybean Oil
In the past, crush demand was driven largely by demand for Meal, Oil was considered a surplus without enough uses. However, rising demand for green energy across the globe and tax incentives for producers have led to a sharp increase in demand for Soybean oil in the past few years, particularly in the US.
Biodiesel production capacity nearly doubled between 2021 and 2022. Since then, markets have normalized with higher planting of crops and increased Soybean crushing capacity installed.
Despite the downbeat economic conditions, demand for Soybean Oil is expected to increase 4.9% this year after surging 6.5% last year, according to the USDA. With higher demand for Soybean Oil, crush demand will also increase. This would result in a change in the price relationship between Meal and Oil as well as a narrower crush spread due to higher volumes.
Harvesting Profit from Crush Spread
Investors can take a position on the crush spread in a capital efficient manner using CME’s Soybean (ZS), Soybean Oil (ZL), and Soybean Meal (ZM) futures. CME offers margin offsets for a crush spread position using these contracts. In addition, the Soybean crush can be executed on CME Globex as a single trade.
Each of these 3 contracts are quoted in different units. ZS is quoted in cents/bushel. ZM is quoted in dollars/short ton. ZL is quoted in cents/pound. As such, in order to calculate the value of the spread, the price of each contract needs to be converted to cents/bushel.
A bushel of Soybean (60 pounds) yields 11 pounds of Soybean Oil and 44 pounds of 48% protein Soybean Meal. The conversion factors are given below
Soybean Oil per bushel: ZL Price x 0.11
Soybean Meal per bushel: ZM Price x 0.022
Crush Spread ($/bushel) = (Soybean Oil per bushel + Soybean Meal per bushel) - ZS Price/100
As per each contract's exposure size, a long crush spread position using CME futures comprises long eleven (11) Soybean Meal futures contracts, long nine (9) Soybean Oil futures contracts, and short ten (10) Soybean futures contracts. This position would normally require a margin of $67,625 for the nearest month contracts. However, with the 88% margin offset, investors can go long on the crush spread with exposure to 50,000 bushels for just ~$8,115 in margin.
Alternatively, investors can also get direct exposure to the crush spread using CME’s options on the Soybean Board Crush Spread. Each contract gives exposure to 50,000 bushels.
Example Trade
Like Soybean prices, the crush also shows seasonality. This is due to the combined seasonal effects of Soybean and each of its byproducts. In our previous paper, we highlighted that Soybean prices are at their lowest in October due to the US harvest.
Due to a low input cost (Soybean price), Board crush expands during this time. The same uptrend can be seen during the summer months representing the harvest from Brazil and Argentina.
It should be noted that seasonal trends are not a guarantee as other factors can have outsized effects on markets.
A long position in the Board crush would represent a short position of 10 Soybean contracts and a long position in 11 Soybean Meal contracts & 9 Soybean Oil contracts.
As an example trade, consider the board crush in Jan 2019. Going long on the board crush on 9th Jan with an entry level of USD 1.02/bushel and an exit at USD 1.37/bushel would yield 34% profit. However, investors should note that the board crush value is highly volatile, as it is derived from three volatile underlying drivers. So, stop loss needs to be adjusted for the high volatility.
Positions on 9th Jan:
● Short 10 ZS1! at entry level of 924 c/bushel
● Long 11 ZM1! at entry level of USD 323.4 /short ton
● Long 9 ZL1! at entry level of 28.6 c/lb
Note that the crush declined to 0.91 on 15th Feb representing downside of 10.7%:
● ZS1! at price level 921.5 resulting in profit of USD 1,250
● ZM1! at price level 310.5 resulting in loss of USD 14,190
● ZL1! at price level 29.95 resulting in profit of USD 7,290
Net loss: USD 5,650
Crush started to rise in April and peaked at 1.37 (+34%) on 30th May:
● ZS1! at price level 877.85 resulting in profit of USD 23,075
● ZM1! at price level 327.4 resulting in profit of USD 4,400
● ZL1! at price level 27.8 resulting in loss of USD 4,320
Net Profit: USD 21,155
Key Takeaways
1) Board Crush or the Crush Spread represents the Gross Processing Margin (GPM) of crushing Soybean into its by-products as quoted by cash and futures markets.
2) Board Crush allows traders to replicate the Soybean Processing Value Chain. It enables traders to harvest gains from changing crush margins while enabling crushers to hedge their GPMs.
3) Board crush can be volatile which requires astute risk management while trading it.
4) Trading board crush using CME futures is margin efficient due to substantial margin offsets (88%).
MARKET DATA
CME Real-time Market Data helps identify trading set-ups and express market views better. If you have futures in your trading portfolio, you can check out on CME Group data plans available that suit your trading needs tradingview.sweetlogin.com
DISCLAIMER
This case study is for educational purposes only and does not constitute investment recommendations or advice. Nor are they used to promote any specific products, or services.
Trading or investment ideas cited here are for illustration only, as an integral part of a case study to demonstrate the fundamental concepts in risk management or trading under the market scenarios being discussed. Please read the FULL DISCLAIMER the link to which is provided in our profile description.

Soybean Oil : Correction Wave 'A' Over?An interesting setup in place?
Correction working out nicely with ratios and at wave 4 of a lesser degree zone. Correction took almost half the time span of bull phase likely completing Wave A.

Soy stuffI recently discovered the joys of trading soy.
was deleting old TA and appreciating it. I decided to share this since its been awhile.
Grey = weekly
Red = Daily
Orange = 4hr
Yellow = 1hr.

Extremely bullish on commodities.Parabolic run during 2023 is likely. WHEAT (ZW1!) is ooking good as well. equal highs.

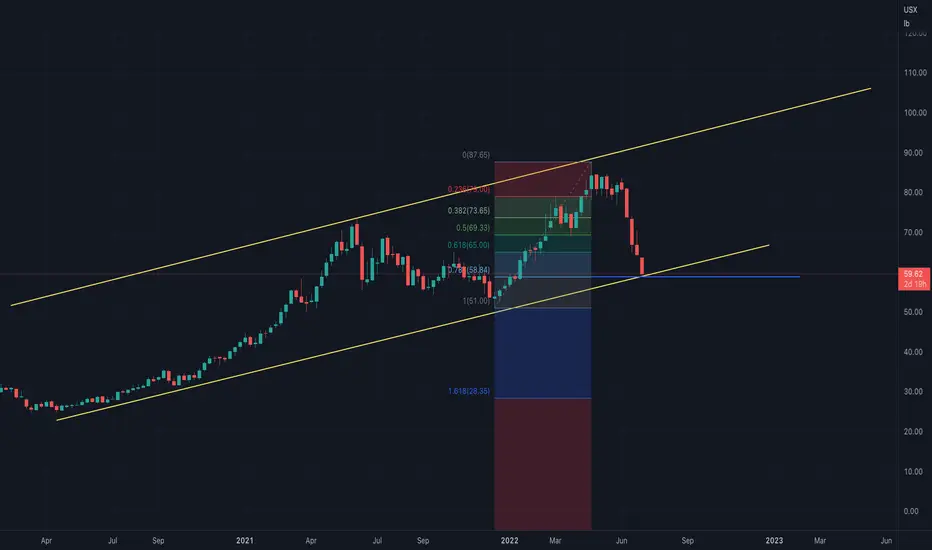
Fading the Soybean Oil premium.Jumping straight into the technicals, we see a head and shoulder pattern on the daily Soybean Oil chart. With the neckline now broken, it seems a bearish set-up might be possible.
While the technicals are important, understanding where the current price level of soybean oil is in context to other products could help us build further conviction on this idea.
Firstly, the Soybean crush components. Currently, Soybean Oil trades at a pretty large premium against Soybean and Soybean Meal. Looking at the price ratios of Soybean Oil/Soybean & Soybean Oil/Soybean Meal, we also see that both have been trading out of the ‘normal’ range since 2021. With both ratios now trending lower and knocking on the door of the normal range again, we will watch closely to see what happens as we approach this critical juncture.
Secondly, Soybean Oil vs its substitute, Crude Palm Oil. Again, we see Soybean Oil as the outlier here, as prices diverge from Crude Palm Oil, with Soybean Oil trading higher. Looking at the bottom chart, we can clearly see the Soybean Oil/Crude Palm Oil ratio deviating from the average range established in 2018 – 2021. With this ratio recently trending lower, a break below the upper level of the range established (dotted line) could accelerate the closing of this premium, as seen in the 2021 to 2022 period, where the ratio collapsed swiftly.
The technically bearish setup, coupled with Soybean Oil’s relative valuation against the soybean complex and Crude Palm Oil on fundamental standpoint, makes a decent case to short Soybean Oil Futures from here.
To express this view, we can consider setting up the trade in a few ways:
1) An outright short on Soybean Oil using the CME Soybean Oil Futures, at the current level of 60.05, setting our stop at 67 and taking profit at 42, with each 1-point move in the Soybean Oil Futures contract equal to 600 USD.
2) A spread trade between Soybean Oil & Crude Palm Oil, by taking a short position in the CME Soybean Oil Futures contract and a long position in the CME Crude Palm Oil futures contract. Such a setup could potentially allow you to stay profitable even if you turn out to be ‘wrong’ in your market views if it eventually proves that crude palm oil has been underpriced and the soybean premium is closed by crude palm oil rallying. For this trade, it is trickier to set up due to the contract size and tick value difference.
Interested readers can check out one of our previous ideas where we have covered this trade in further detail:
The charts above were generated using CME’s Real-Time data available on TradingView. Inspirante Trading Solutions is subscribed to both TradingView Premium and CME Real-time Market Data which allows us to identify trading set-ups in real-time and express our market opinions. If you have futures in your trading portfolio, you can check out on CME Group data plans available that suit your trading needs tradingview.sweetlogin.com
Disclaimer:
The contents in this Idea are intended for information purpose only and do not constitute investment recommendation or advice. Nor are they used to promote any specific products or services. They serve as an integral part of a case study to demonstrate fundamental concepts in risk management under given market scenarios. A full version of the disclaimer is available in our profile description.
Reference:
www.cmegroup.com
www.cmegroup.com
www.cmegroup.com

SBO Wave 5 in the making?SBO making a downtrend movement since Nov 2022.
Based on EW rules.. price now should make Wave 5.
Target to nearest support + Fibo extension 0.618.
Another 2.8% movement.
If we use this data for FCPO, there will be another around 100tick price to go down.

ZL1 LOOKS MORE DOWNThe forth wave correction looks more like triangle or flat. lets wait and absorb the C wave pattern.
Im more look to watch the price can hit 48.00 area.

Soybean Oil Futures ( ZL1! ), H4 Potential for Bullish RiseTitle: Soybean Oil Futures ( ZL1! ), H4 Potential for Bullish Rise
Type: Bullish Rise
Resistance: 64.60
Pivot: 61.66
Support: 59.90
Preferred case: Looking at the H4 chart, my overall bias for ZL1!is bullish due to the current price being above the Ichimoku cloud , indicating a bullish market. Expecting price to retest the pivot at 61.66, where the overlap support and 23.6 % Fibonacci line is before heading towards the resistance at 64.60, where the overlap resistance and 61.8% Fibonacci line is.
Alternative scenario: Price could head back down to break the pivot at 61.66, where the overlap support and 23.6 % Fibonacci line is, before heading towards the support at 59.90, where the previous swing low is.
Fundamentals: There are no major news.

ZL Double TopZL price hit the daily support level and didn't bounce up like the last several times, a confirmation for this top structure. Filled a short order yesterday.

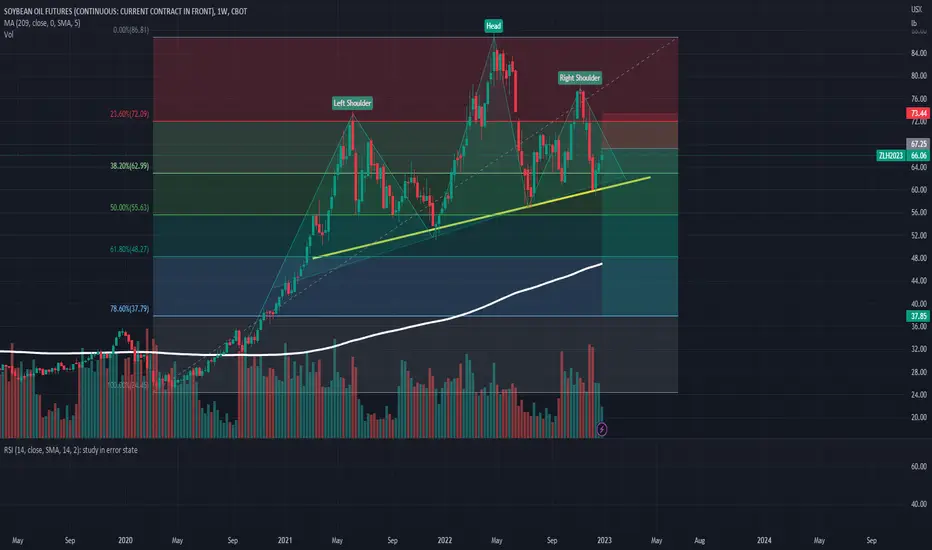
ZL Soybean Oil has shown a reverlsal pattern ZL has a Head-Shoulders pattern after a long Uptrend.
a break through the nickel is a signal of entering short with a 1/4 risk-reward ratio.
Let's see if the market will confirm my analysis.
Weekly Forecast (December 27 – 30, 2022)Uptrend scenario
An uptrend will start as soon, as the market rises above resistance level 65.75, which will be followed by moving up to resistance level 67.80 and if it keeps on moving up above that level, we may expect the market to reach resistance level 70.55.
Downtrend scenario
An downtrend will start as soon, as the market drops below support level 63.50, which will be followed by moving down to support level 61.55 and 59 – 58.35.

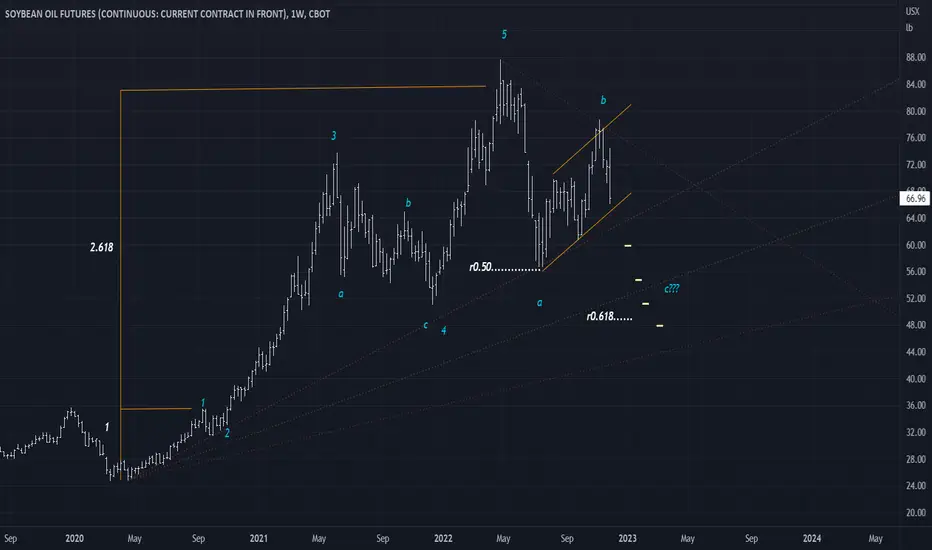
SOYBEANOIL : Interesting setupSBO bull run started April '20 till April '22 surpassing 208 high achieving 253% phenomenal rise displaying a 5 wave structure and now appearing to complete the wave sequence wave c . The bearish flag increases the probability .
Refer to your personal preferred indictors to assess market action.
Bearish Indication of SOYANEAN OIL Bearish Indication of SOYANEAN OIL.
As the big players are in profit-taking mode after the uptrend, the price continues to fall.
Besides, the demand side of soyabean is at uncertain as one of the leading consumers, china is dealing with covid-19 pandemic again.
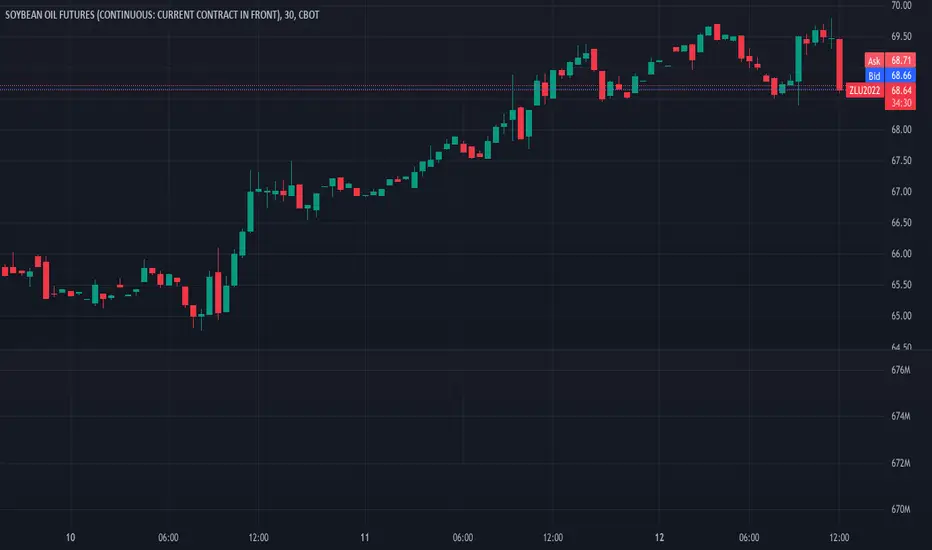
Soybean Oil is still longonly a few commodities are currently on my long trade list
tradingview.sweetlogin.com
Today an entry on the 12 min chart was also possible, but like last week the better entry will be near the 18 SMA for a longer term play...
SOYBEAN OIL // long term scenariosI don't know anything about Soybean Oil, but I watch the price that shows everything I need to know.
This is quite a long term one since it's the weekly, but it's so beautiful! Although the primary trend is still long, market participants printed a nice impulse wave on the way down. This last couple of slow waves make up a correction of the impulse wave while crawling up, and price has just tested the last weekly south breakout.
From here, the break of this countertrend takes aim at this market , shorts will be ready to jump in.
An early sign happens first with the break of the last weekly north breakout, but the second one is better. If price reaches it, be patient. It may slow down there, even make a small countertrend, but a break of this zone can take the price all the way to the next weekly north breakout, that's happen to be close to the target fibo 138.2
The early sign becomes valid only when this week's closing makes the breakout a breakout (higher than the previous high).
The countertrend is valid at the moment, but the daily printed a nice shooting star...
Thanks for reading my analysis!🤘🏽
Trade safe and let me know what you think! ⚪️⚫️
--------------------------------------------------------------------------------
ANYWAY, a lot of Qs about the direction of the price. But it doesn't matter.
WE JUST REACT!
Remember that trading is a business.
SIZE your TRADES according to your risk aversion!
----------------------------------------------------------

forecasting SOYBEAN OIL , ZL ,in dayli chart Hello to all investors, according to my previous studies and according to my experience as a trader, I see a good investment opportunity with a high probability of success, the details are reflected in the graph

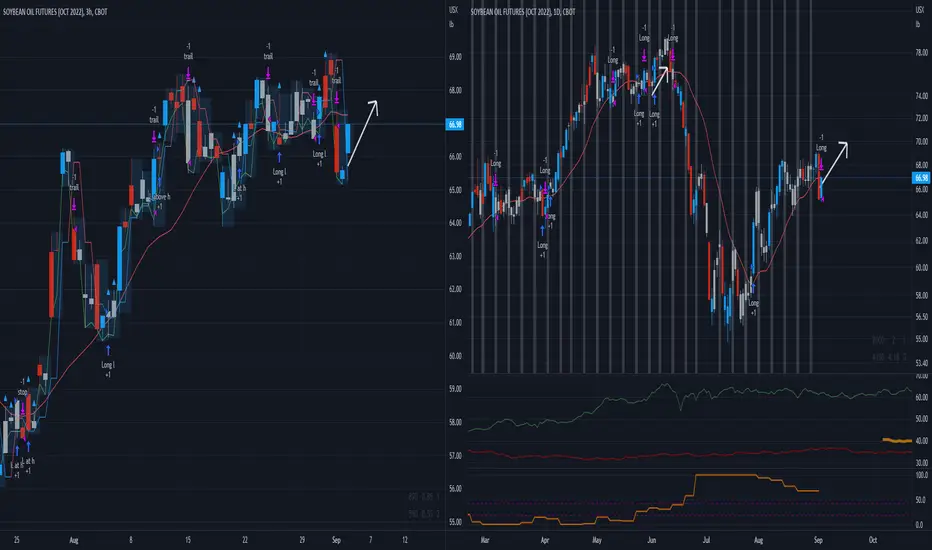
Keep in Mind at double bottom in sideways marketsA much safer way to trade Trendcontinuation is to enter long at a double bottom rather than wait for another breakout above prior day high.
As long as 18 moving average is point up the long trend does not stop :-)
Soyabeen Oil commodity USA Sun Storm Investment Trading Desk & NexGen Wealth Management Service Present's: SSITD & NexGen Portfolio of the Week Series
Focus: Worldwide
By Sun Storm Investment Research & NexGen Wealth Management Service
A Profit & Solutions Strategy & Research
Trading | Investment | Stocks | ETF | Mutual Funds | Crypto | Bonds | Options | Dividend | Futures |
USA | Canada | UK | Germany | France | Italy | Rest of Europe | Mexico | India
Disclaimer: Sun Storm Investment and NexGen are not registered financial advisors, so please do your own research before trading & investing anything. This is information is for only research purposes not for actual trading & investing decision.
#debadipb #profitsolutions
Review of multiple markets7. 19. 22 Euro futures 6E1! Dxy Wheat ZW1! Soybean oil ZL1! This is a quick review of a few tradable futures markets. I show what attracts me to look at a market, and sometimes that requires that I use much larger time frames. I used to Euro futures as an example of longer-term trading and give some possibilities for Traders who don't want to DayTrade as much as they want to hold longer-term positions. I am not an expert on using Futures currencies for qualified accounts, but you should be able to trade Futures currencies in your IRA... check with your broker. I was a little sloppy with my Fibonacci numbers, but this is nothing new and I don't have time to do another video, and I know most of you will be able to know what I'm saying. The numbers are on the chart, my description what's less than perfect, as usual. The most important point on this video is to find a market and a time frame that you relate to. It is very easy to bypass great opportunity because the timeframe you are evaluating and your initial biases don't connect with a true opportunity of that market.

Looking for a sharp reversal on Soybean OilSoybean oil futures closed last session on a long established support level and down fib extension. With crude climbing back up and after today's sell off this is likely to pop when the market re-opens.