SOYBEAN OIL Head and Shoulder pattern in the making at H4SOYBEAN OIL Head and Shoulder pattern in the making at H4
ZL1! trade ideas

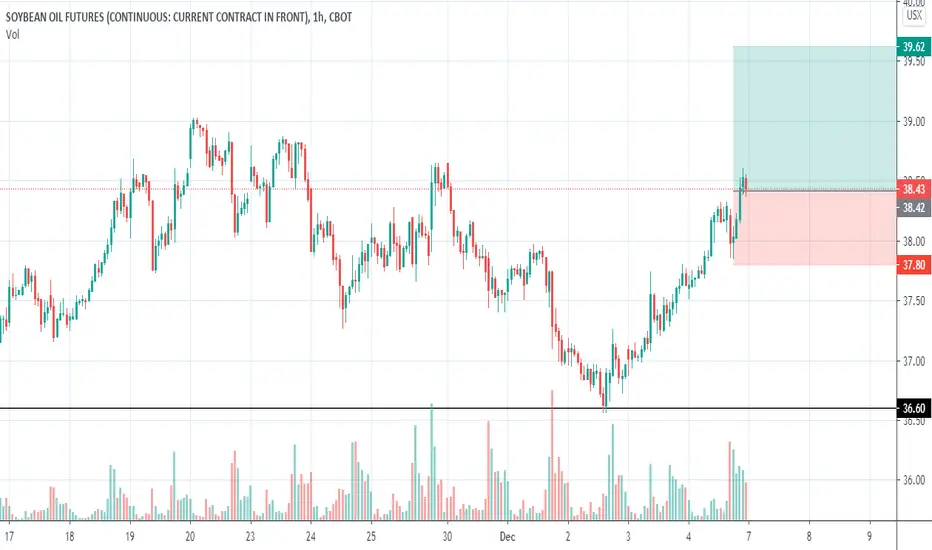
SOYBEAN OIL NEXT WEEK SHORTSOYBEAN OIL - entered short - good risk/reward ratio. Close on Friday or at target price. Probability H.

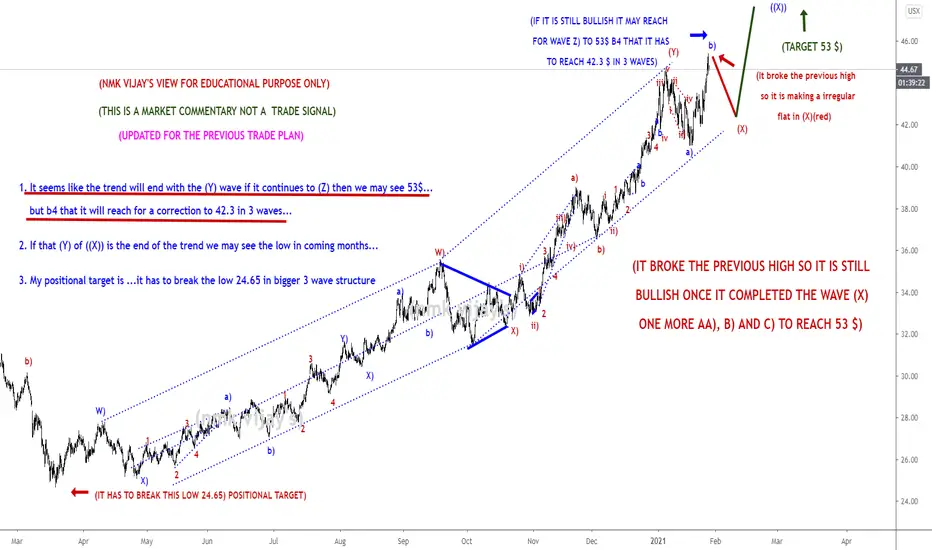
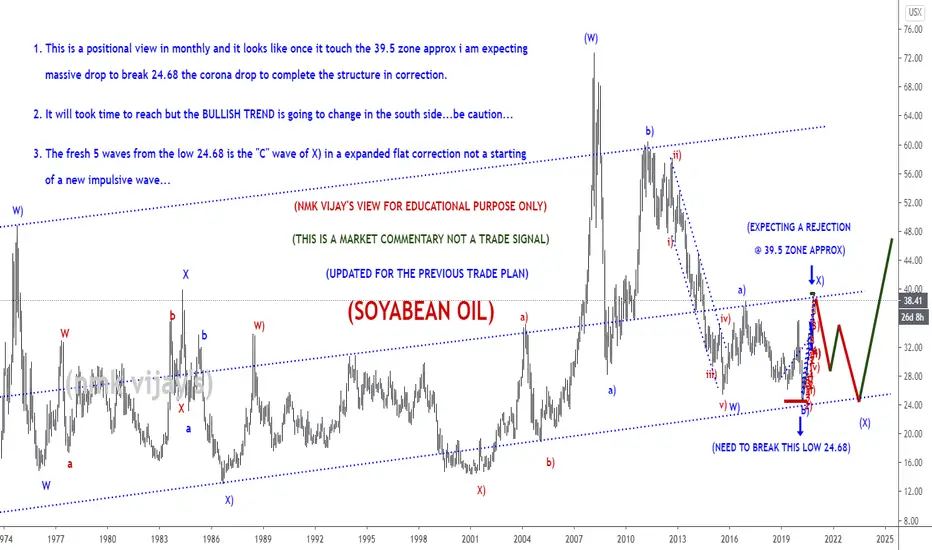
SOYAOIL-It broke the high so continuation to Z) to 53 ?Market Commentary:
LEARNING ELLIOTT WAVES IS LITTLE BIT TOUGH (FOR ME IN BEGINNING) BUT I TOOK IT AS A CHALLENGE AND THAT IS NOT IMPOSSIBLE ALSO...
First have an look for the positional trend i shared here previous....if you are a follower of me...and sometimes i will share the counter trend trade also in 15 mins and 1hr...but that is risky ones...so if the trend is bearish or bullish, if i am expecting the correction...book the profit there and wait the correction to end and again go with the trend....DONT TRADE THE COUNTER TRADE SETUP...you will took loss too...try to identify the short term pull back and the long term pull back after that took small lots in the short term PB with strict stop and go with big lots in the trend side that is long term. I WONT TOOK ALL THE TRADE PLAN SHARED HERE...
Read the market commentary inside the chart what i shared here carefully and try to learn Elliott waves...otherwise its tough to understand the market commentary and my analysis. I wont give a entry, stop loss and take profit in my chart...it is only for EDUCATIONAL PURPOSE and i am sharing how i am analyzing the pair and labeling them according to the Elliott wave theory...I AM JUST SHOWING THE TREND HOW IT MAY GO AND MY VIEW(it may wrong too)..so DON'T FOLLOW BLINDLY MY CHART..take this as a reference and if it correlate to you strategy took the trade as per your strategy...DON'T ASK ABOUT YOUR RUNNING TRADES i wont comment on them and I WONT SUGGEST TO TAKE MY TRADE SETUP.
I am a technical analyst based on trendline, channel, fib retracements, expansion, stochastic for divergence, EMA's and MA's are finding the pull backs and MAJOR IS ELLIOTT WAVES...those mentioned above are using as a TOOLS only. I am not a fundamental, sentimental trader...but only the fundamental will boost my technical analysis to reach my target or sometimes it will go against me and then i will manage the trade according to the Elliott waves alternate views...Each and every trade plan i am sharing here has a alternate view and i am sharing only the most probabilities(70-80%) here...sometimes the other (20-30%) may market do..then i will change the wave counts and labeling according to the price action.
All labeling and wave counts done by me by manually and i will keep change according to the LIVE MARKET PRICE ACTION. So dont bias, hope on my trade plans...try to learn and make your own strategy...Following is not that much easy...I AM NOT RESPONSIBLE FOR ANY LOSSES IF U TOOK THE TRADE ACCORDING TO MY TRADE PLANS....THANKS LOT..CHEERS
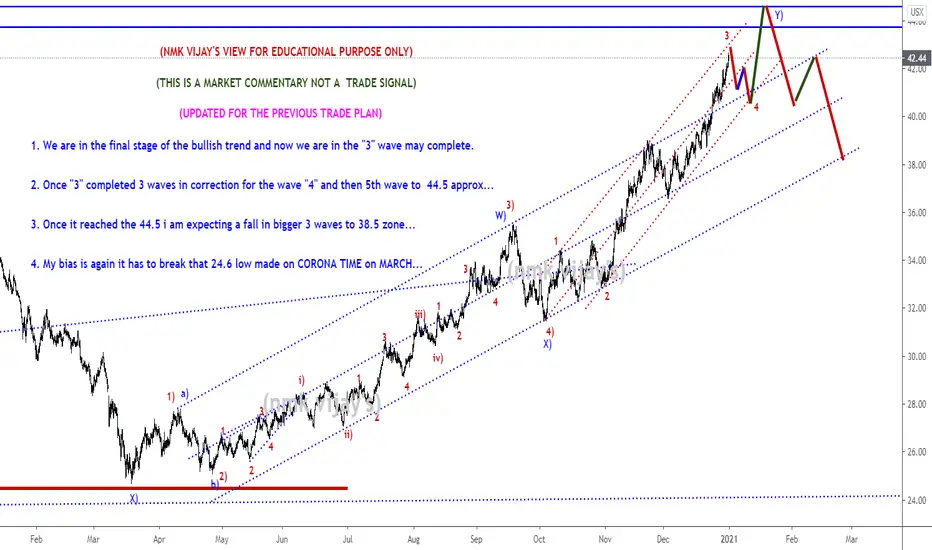
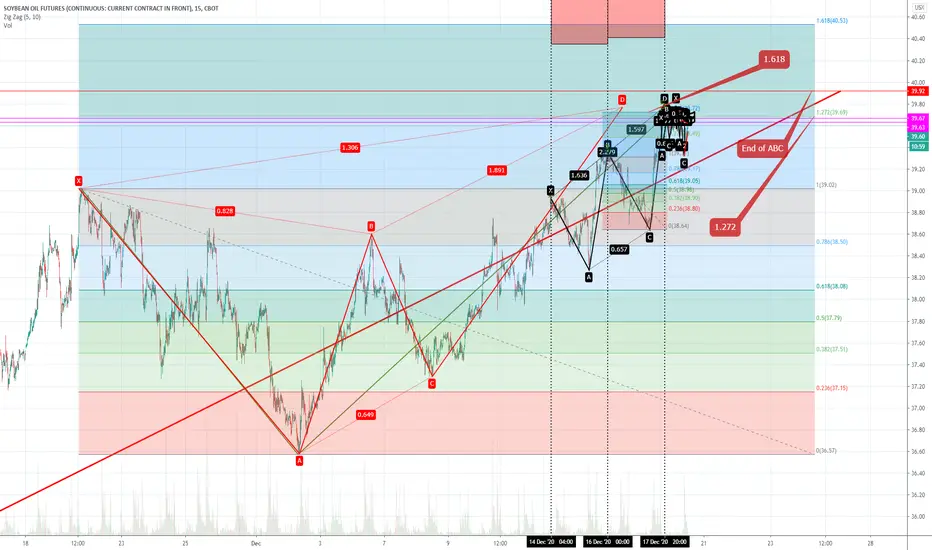
SOYAOIL-Expecting a fall to 40.50 for 4th wave and then to 44.5Market Commentary:
LEARNING ELLIOTT WAVES IS LITTLE BIT TOUGH (FOR ME IN BEGINNING) BUT I TOOK IT AS A CHALLENGE AND THAT IS NOT IMPOSSIBLE ALSO...
First have an look for the positional trend i shared here previous....if you are a follower of me...and sometimes i will share the counter trend trade also in 15 mins and 1hr...but that is risky ones...so if the trend is bearish or bullish, if i am expecting the correction...book the profit there and wait the correction to end and again go with the trend....DONT TRADE THE COUNTER TRADE SETUP...you will took loss too...try to identify the short term pull back and the long term pull back after that took small lots in the short term PB with strict stop and go with big lots in the trend side that is long term. I WONT TOOK ALL THE TRADE PLAN SHARED HERE...
Read the market commentary inside the chart what i shared here carefully and try to learn Elliott waves...otherwise its tough to understand the market commentary and my analysis. I wont give a entry, stop loss and take profit in my chart...it is only for EDUCATIONAL PURPOSE and i am sharing how i am analyzing the pair and labeling them according to the Elliott wave theory...I AM JUST SHOWING THE TREND HOW IT MAY GO AND MY VIEW(it may wrong too)..so DON'T FOLLOW BLINDLY MY CHART..take this as a reference and if it correlate to you strategy took the trade as per your strategy...DON'T ASK ABOUT YOUR RUNNING TRADES i wont comment on them and I WONT SUGGEST TO TAKE MY TRADE SETUP.
I am a technical analyst based on trendline, channel, fib retracements, expansion, stochastic for divergence, EMA's and MA's are finding the pull backs and MAJOR IS ELLIOTT WAVES...those mentioned above are using as a TOOLS only. I am not a fundamental, sentimental trader...but only the fundamental will boost my technical analysis to reach my target or sometimes it will go against me and then i will manage the trade according to the Elliott waves alternate views...Each and every trade plan i am sharing here has a alternate view and i am sharing only the most probabilities(70-80%) here...sometimes the other (20-30%) may market do..then i will change the wave counts and labeling according to the price action.
All labeling and wave counts done by me by manually and i will keep change according to the LIVE MARKET PRICE ACTION. So dont bias, hope on my trade plans...try to learn and make your own strategy...Following is not that much easy...I AM NOT RESPONSIBLE FOR ANY LOSSES IF U TOOK THE TRADE ACCORDING TO MY TRADE PLANS....THANKS LOT..CHEERS
CME CBOT:ZL Soybean Oil : BUY the Dip, Target : 41.58 (+33.27%)Soybean Oil Futures (CME CBOT: ZL) :
Trade : BUY the Dip
Entry : 31.2
Target : 41.58 (+33.27%)
Stop : 28.53 (-8.56%)
Note: Soybeans futures are showing menaingful movement. I think it's time to pay attention to soybean oil futures. Key price is 34.16. When they secure that price line, it will be a sign that they are out of the bottom and will rise one notch higher. Important prices are 28.53, 34.16 and 41.58. If the market is strong enough, they could rise up to 52.80. As 34.16 is a strong resistance, they will fluctuate soon. There will be opportunities to buy at a lower price.


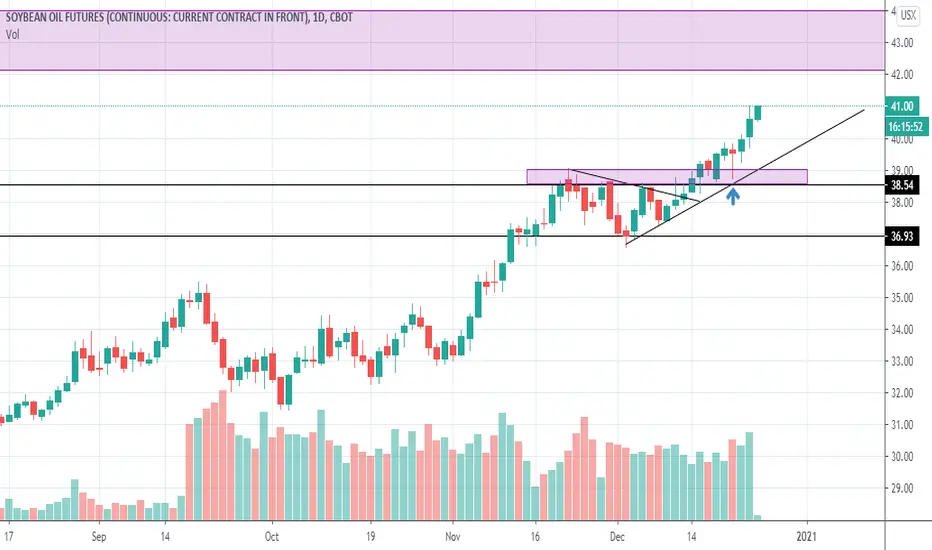
Soybean Oil - Double Bottom BreakoutPrice breakout 6 years double bottom range 38.35. As long as price sustain above 38.35, the formation is eyeing 51.20 and remain valid.

Soybean Oil 50% retrace - Great entry levelVegOil's are still fundamentally bullish, Energy and Industrial have also been trending up.
Wanting to be on the Long Side this is as good as it gets for entry.

Soybean Oil Christmas CorrectionAs the year closes, Soybean Oil is indicating a correction is due.
Next year we will know if its a reversal or not but for now I'm shorting it here with a SL of $39.50 and I'm aiming for $34.00 as a target.
I'm returning next year to drop more gems for my loyal followers.
Soybeal Oil Trade
I'm short at 38.56
SL 39.50
TP 34.00
Have a great and safe holidays.

Soybean Oil-Breaking OutSoybean Oil is attempting to breakout of a possible flag this morning.
$ZL_F

SOYABEANOIL-Seems like trend may reverse soon to south 26$Market Commentary:
LEARNING ELLIOTT WAVES IS LITTLE BIT TOUGH (FOR ME IN BEGINNING) BUT I TOOK IT AS A CHALLENGE AND THAT IS NOT IMPOSSIBLE ALSO...
First have an look for the positional trend i shared here previous....if you are a follower of me...and sometimes i will share the counter trend trade also in 15 mins and 1hr...but that is risky ones...so if the trend is bearish or bullish, if i am expecting the correction...book the profit there and wait the correction to end and again go with the trend....DONT TRADE THE COUNTER TRADE SETUP...you will took loss too...try to identify the short term pull back and the long term pull back after that took small lots in the short term PB with strict stop and go with big lots in the trend side that is long term. I WONT TOOK ALL THE TRADE PLAN SHARED HERE...
Read the market commentary inside the chart what i shared here carefully and try to learn Elliott waves...otherwise its tough to understand the market commentary and my analysis. I wont give a entry, stop loss and take profit in my chart...it is only for EDUCATIONAL PURPOSE and i am sharing how i am analyzing the pair and labeling them according to the Elliott wave theory...I AM JUST SHOWING THE TREND HOW IT MAY GO AND MY VIEW(it may wrong too)..so DON'T FOLLOW BLINDLY MY CHART..take this as a reference and if it correlate to you strategy took the trade as per your strategy...DON'T ASK ABOUT YOUR RUNNING TRADES i wont comment on them and I WONT SUGGEST TO TAKE MY TRADE SETUP.
I am a technical analyst based on trendline, channel, fib retracements, expansion, stochastic for divergence, EMA's and MA's are finding the pull backs and MAJOR IS ELLIOTT WAVES...those mentioned above are using as a TOOLS only. I am not a fundamental, sentimental trader...but only the fundamental will boost my technical analysis to reach my target or sometimes it will go against me and then i will manage the trade according to the Elliott waves alternate views...Each and every trade plan i am sharing here has a alternate view and i am sharing only the most probabilities(70-80%) here...sometimes the other (20-30%) may market do..then i will change the wave counts and labeling according to the price action.
All labeling and wave counts done by me by manually and i will keep change according to the LIVE MARKET PRICE ACTION. So dont bias, hope on my trade plans...try to learn and make your own strategy...Following is not that much easy...I AM NOT RESPONSIBLE FOR ANY LOSSES IF U TOOK THE TRADE ACCORDING TO MY TRADE PLANS....THANKS LOT..CHEERS


If you wanted to take profit this is a good as it getsFundamentally Veg Oils are behaving like 2010/2011, I am expecting a correction here this week due to a few factors, Short Trading Week, Long Week, Month end, PalmOil Stalling last week, much like Nov 2010.
If one wanted to take profits this is a good time, I am firm believer we keep rallying through Dec Jan Feb maybe Mar.
we are at Resistance now in the 38's Next resistance is 44's, we could also go ridiculous in the 60's if PalmOil stocks keep shrinking fast, WTI trending up would confirm possibility to go in the 60's.

Lots and Lots of Fresh Air above $36VegOil Complex is Fundamentally as Bullish as the 2010/2011 Period.
-Fiscal Stimulus/Money Flow into Commodities
-Stocks of all Veg Oil are at 3-5y lows
-Consumption and Export Demand very strong
-The only thing that could ruin this party IMO is if the ratio of Covid Deaths/Cases start to creep up, that would be very worrisome.

ZLZ2020Soybean Oil still seems pretty strong however the front spread is showing weakness already, which usually leads to the drop for the future cotract as well. I am watching closely this, as the bear spreads are all set for growth with great potential.


soybeans oil ideaHi friends,
small leg down = c of 4 then up for wave 5
do not forget to follow me ^^
