Traditional|ZO1!|Long and shortLong and short ZO1!
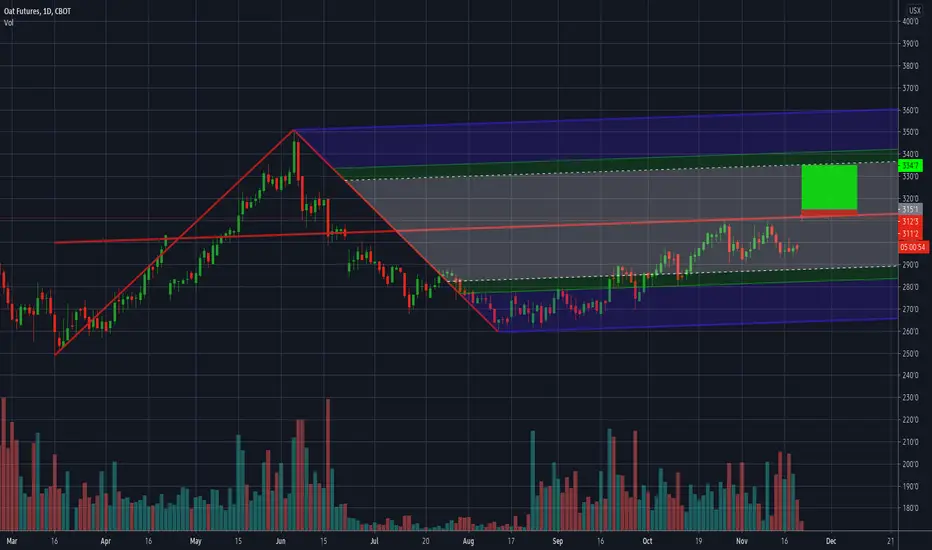
Activation of the transaction only when the blue zone is fixed/broken.
Testing support and resistance levels.
* Possible closing of a trade before reaching the take/stop zone.
The "forecast" tool is used for more noticeable display of % (for the place of the usual % scale) of the price change, I do not put the date and time of the transaction, only %.
The breakdown of the upper blue zone - long.
Breakdown of the lower blue zone - short.
Working out the stop when the price returns to the level after activation + fixing in the red zone.
Blue zones - activation zones.
Green zone - take zone.
Red zone - stop zone.
Orange arrows indicate the direction of the take.
Red arrows indicate the direction of the stop.
P.S Please use RM (risk management) and MM (money management) if you decide to use my ideas, there will always be unprofitable ideas, this will definitely happen, the goal of the system is that there will be more profitable ideas at a distance.
ZO1! trade ideas

ZO daily analysesHi friends
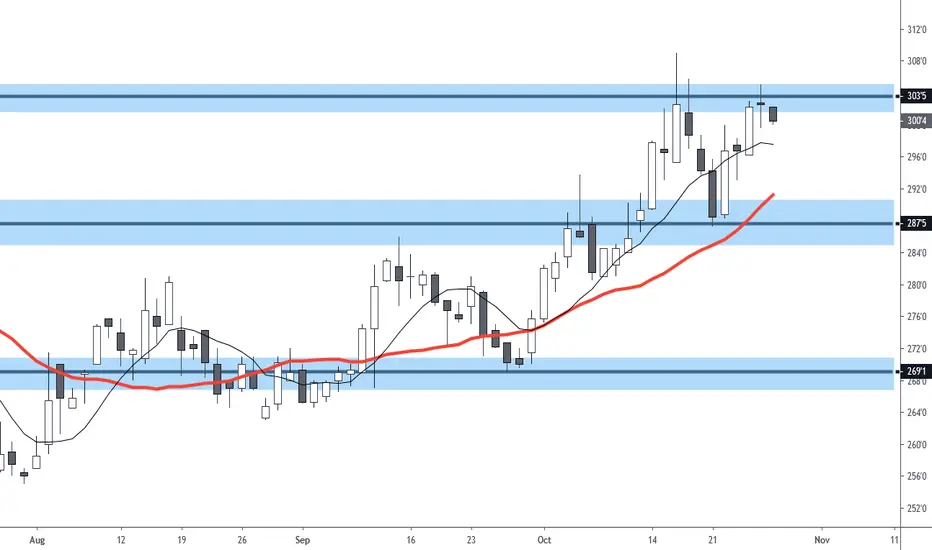
the daily chart of this market shows that it will experience an uptrend in the next few days but you have to wait after the breakout at the level of 293.36 for long entry
so it is better to pay attention to the change of the market towards the opposite direction
be sure to subscribe to receive new analyzes

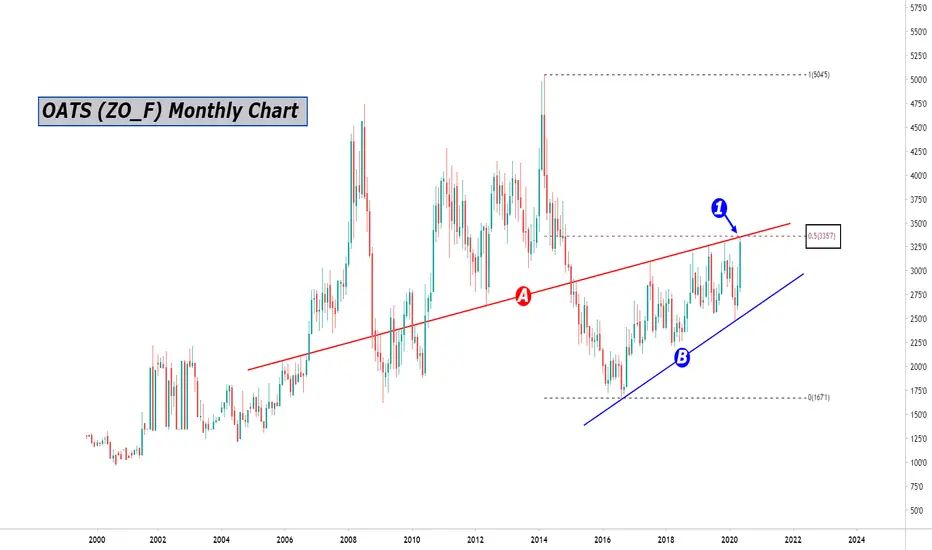
Sneaky Oat Bulls Kept This One Quiet!
A solid month for Oats! Sneaky Oat bulls have enjoyed a very rewarding month, but will it last? Oats tapped out at dual resistance yesterday at (1), where inside trendline (A) and 50% Fib level cross (1) taken from the highs of March 2014 and the lows of August 2016. A yearly rising wedge (bearish reversal) pattern (A & B) in this monthly time frame stands out a mile, and the bears are just hoping this wedge pattern continues to form. They might be in for a bit of luck, at least for the short term. The wedge is perfectly located at the bottom of a trend that began back in early 2014, which tends to perform better. And with overbought signals screaming at us on the lower daily time frame, we can expect at the very least a breather from this relentless rally.
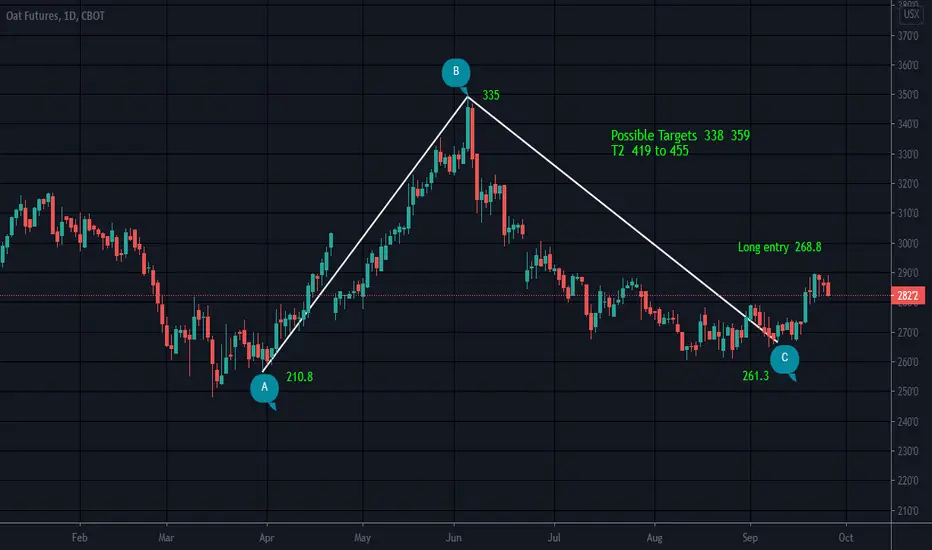
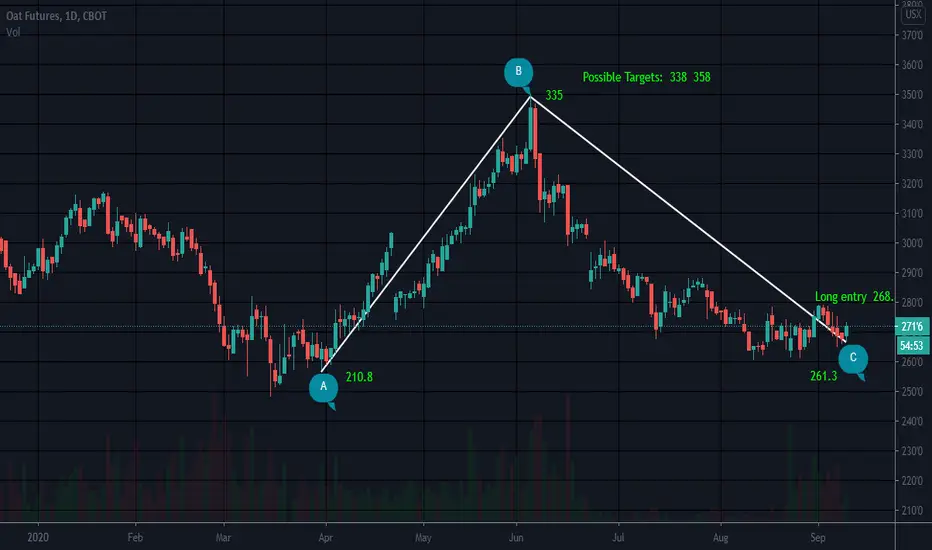
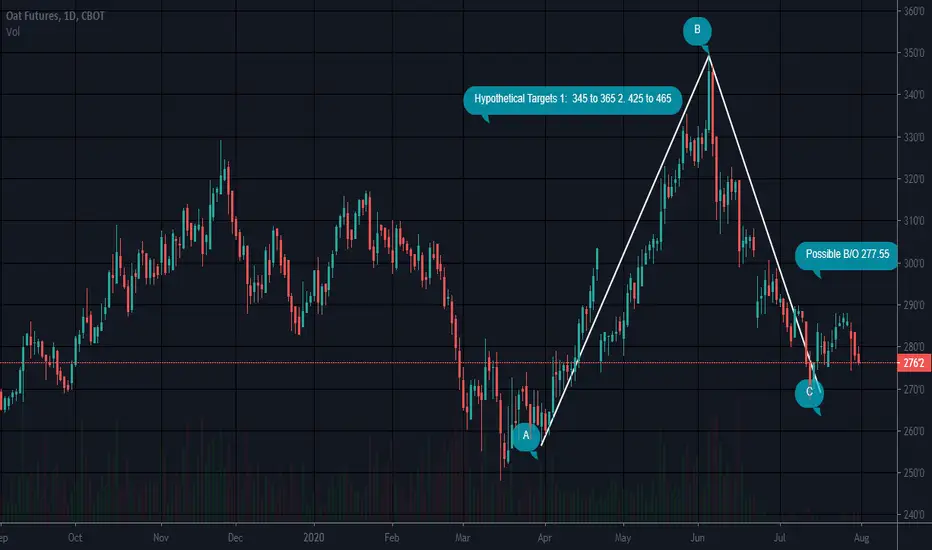
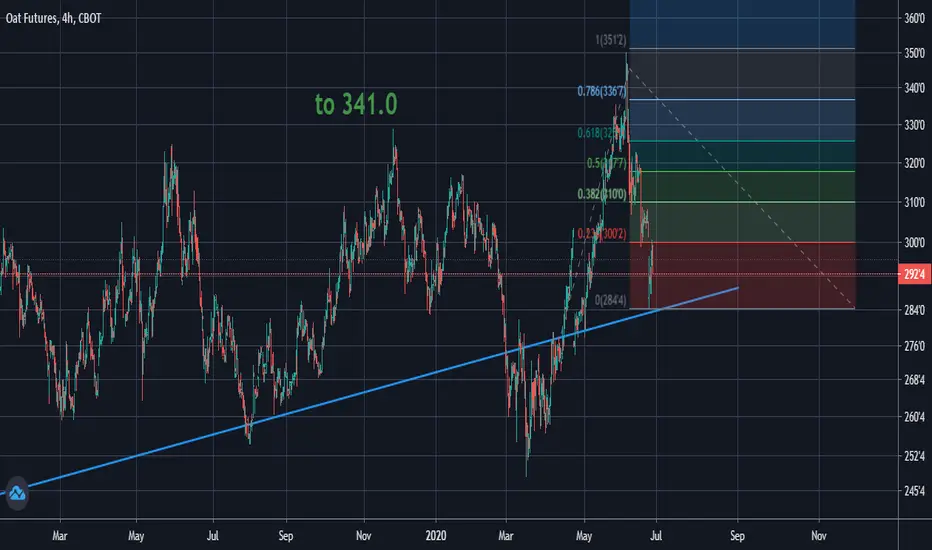
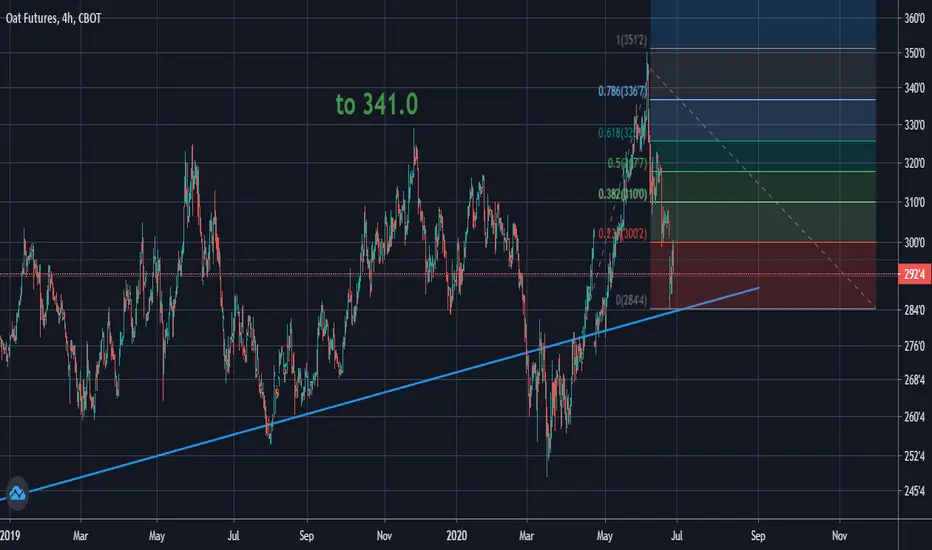
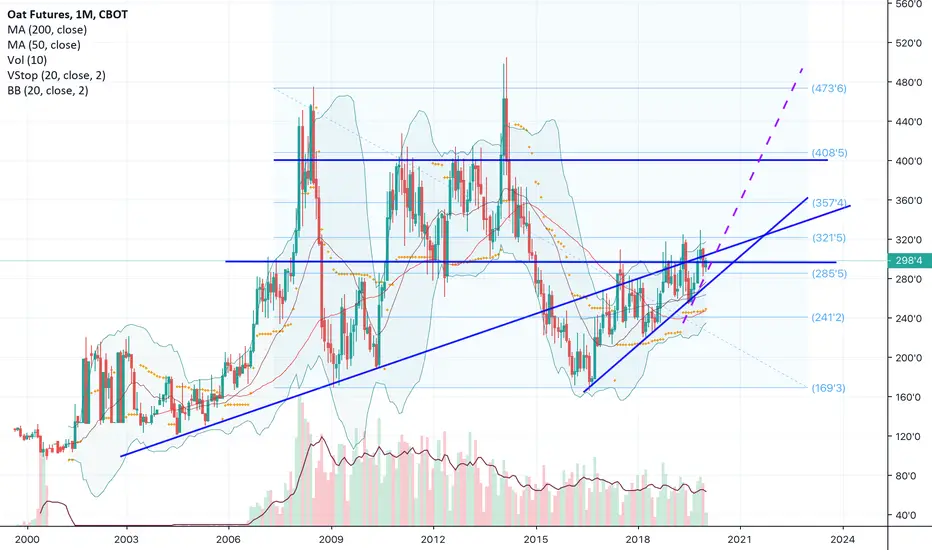
Oats looking to breakout of bottomOats seems to be following wheat in that there is a similar bottoming pattern occurring that has been going on for several years now. And up angled wedge which has trend lines dating back to 2006 forming is reaching its pinnacle. There is a lot more action to the upper side of the triangle compared to the lower so I think the break out direction will be most likely to the upside. Short term target is along the fib levels at 321 and 357 (which also form zones of resistance) are achievable over the next 2 or so years. Long term I’ve put in an optimistic trend line which is indicated in purple. Let’s see if it holds.
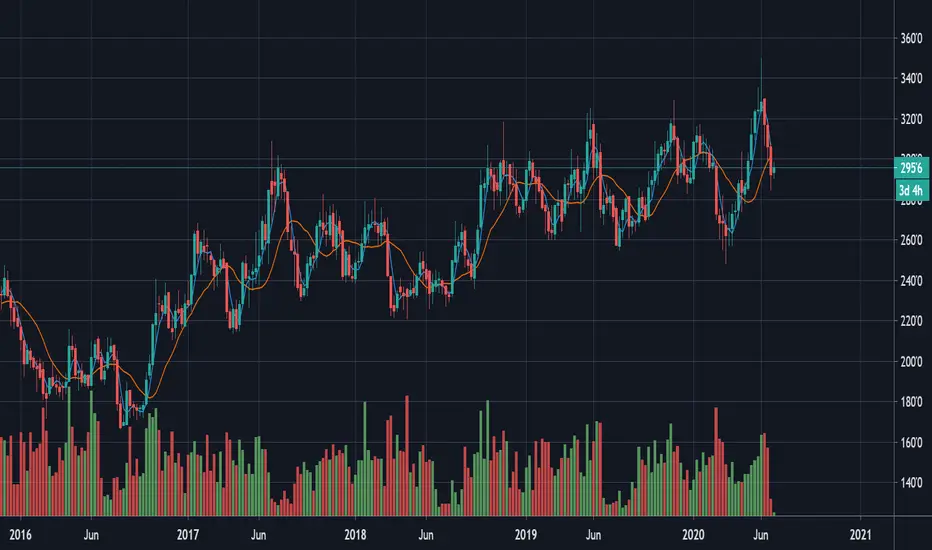
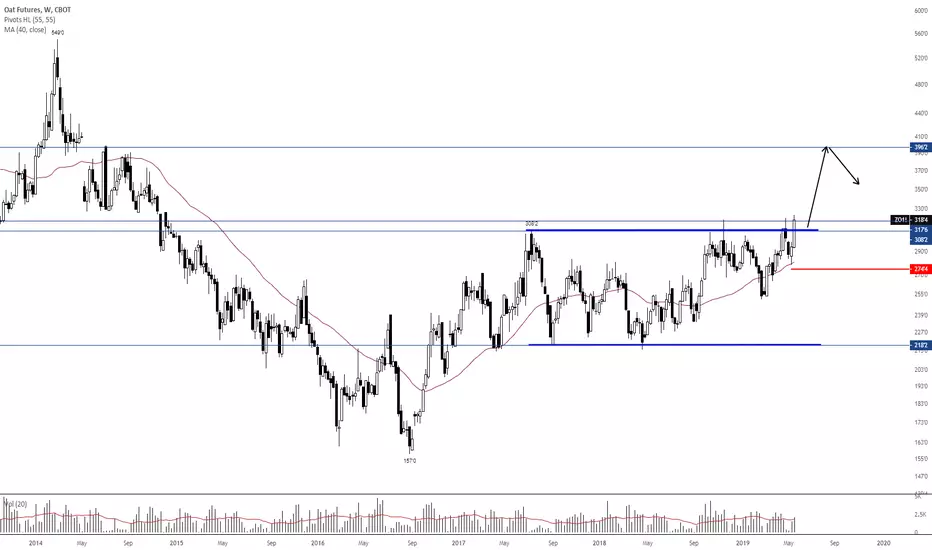
Weekly Oat Futures ReversalComplex overlapping corrective structure is defined by the orange median line study. Mathematical symmetry and momentum divergence at blue line $319 can signal price exhaustion as this level has been tested 3 times.
The final swing looks to be developing in 5 waves of (c) and a break of wave 4 signals a reversal with a turn down in momentum target red line wave B at $255 with a break measuring black line wave (B) for the entire swing at $224'4.

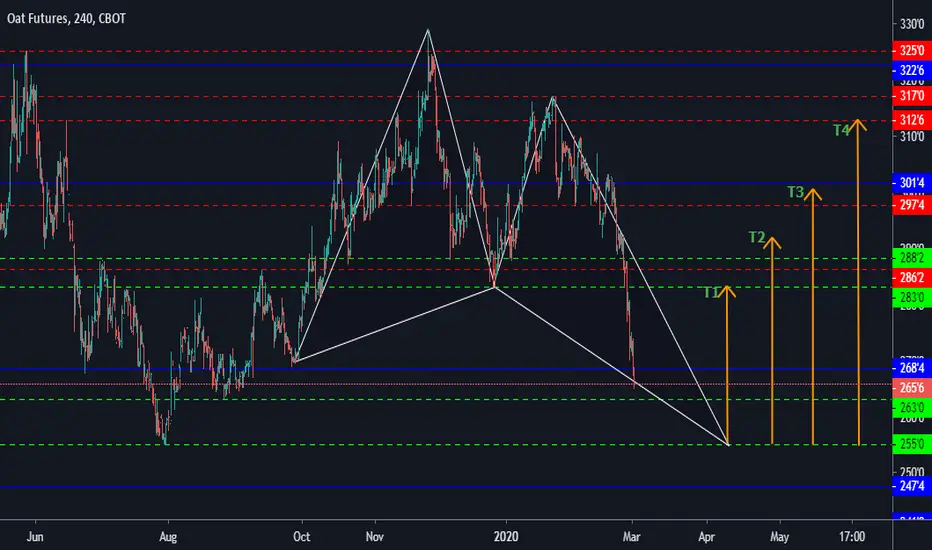
BUTTERFLY HARMONIC, ZO1! OATSPOTENTIAL BUTTERFLY HARMONIC FORMING OATS FUTURES. WATCH REACTION ON COMPLETION , IF REVERSAL PATTERN FORMS. LONG!!
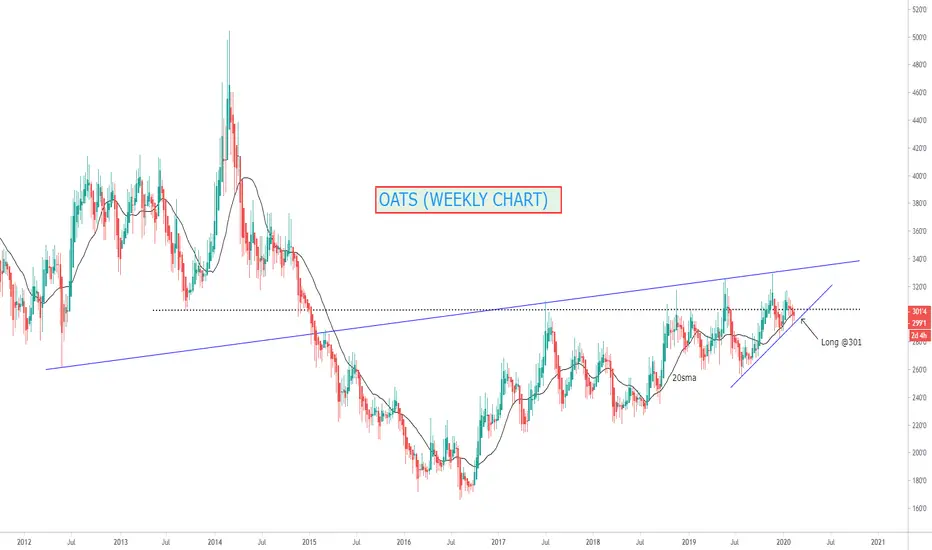
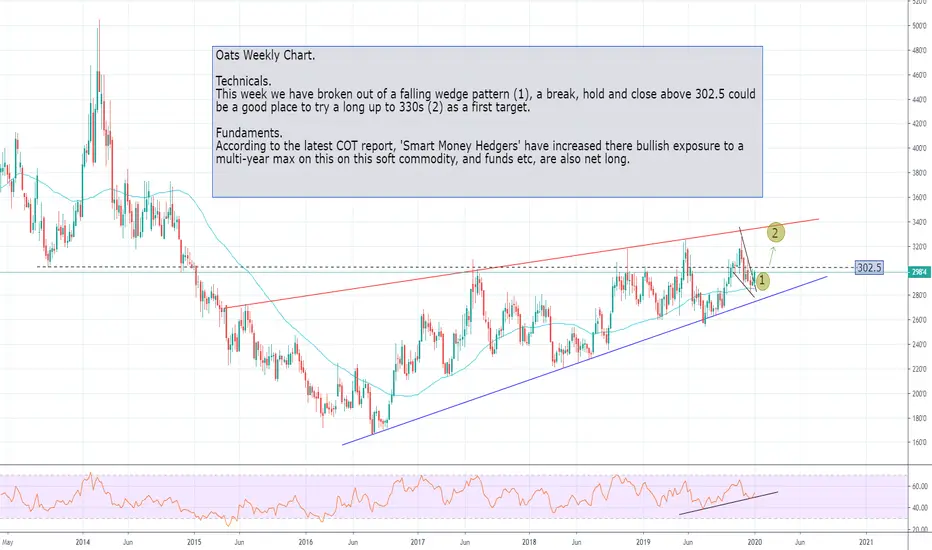
OATS (WEEKLY CHART)Been patiently waiting to go long on this commodity after monitoring the activity amongst the Smart money Hedgers and the Funds etc. over the past month.
Bought at 301, stop at 289, First target at 318 Second at 328. TF = Short Term.
Oats short @ 287.15stop @ 297.30 target 269.47
if the trade moves against us 2nd position @ 288.75 and 3rd @ 290.99
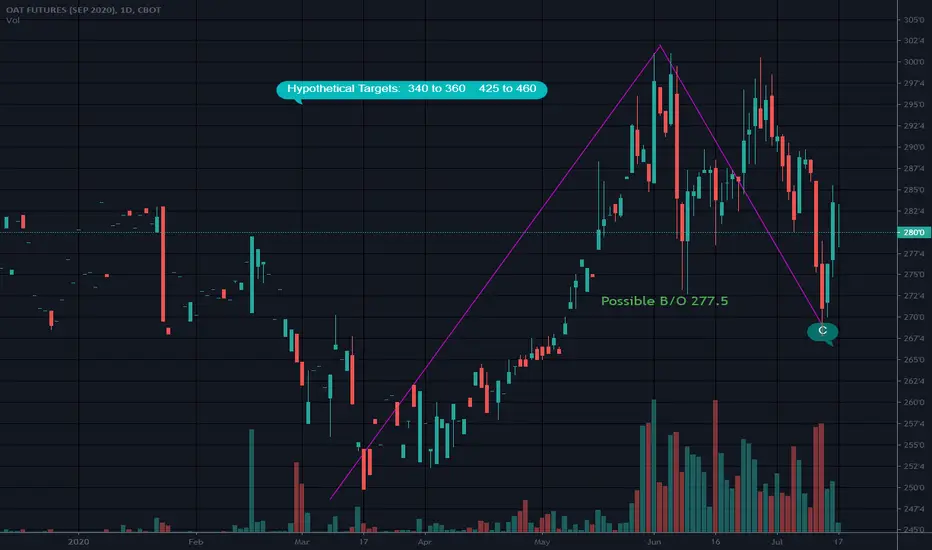
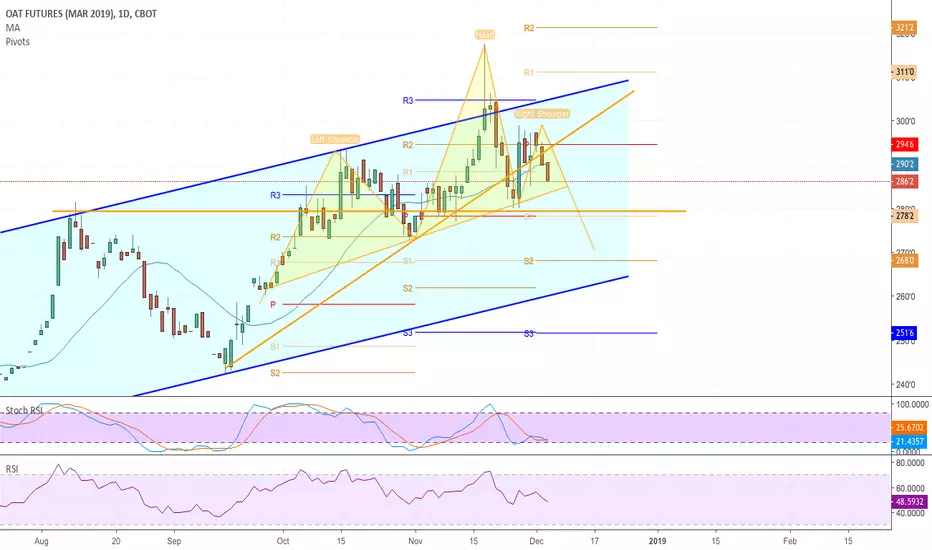
March Oats Head and ShouldersOats is rounding out that last shoulder for this H&S Neckline must be broken at 284 for this pattern to evolve. Minimum target for this setup is just above S2 at 268. Significant support comes in at 278'2 at S1.
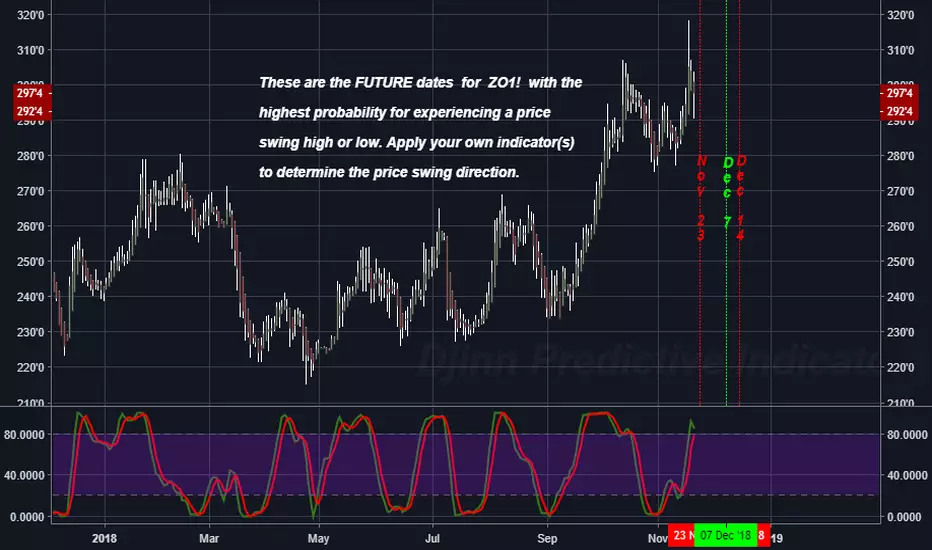
The FUTURE High / Low price swing dates for ZO1! (Oats)These are the FUTURE dates for ZO1! with the
highest probability for experiencing a price
swing high or low. Apply your own indicator(s)
to determine the price swing direction.
July Oats Bearish CypherOats coming off of down channel and rising. Hit downtrend RSI. Watching for break of this mark for further upside. Oats has just crossed 20 day MA and stayed above. Next upside target is R1 at 244'4

May Oats Head and ShouldersMay Oats has built out the last shoulder of an H&S today. Downside target is now to break neckline at S1 260'4. Oats went under the 20 day MA, which deems it bearish . S2 would be its minimal move.
