Soybeans forming a head and shoulders patternSoybeans have proved itself one of the strongest commodities the past few months. As soybeans makes another leg up it looks like a H&S pattern could be forming. Set your alerts, this could a good trade!
ZS1! trade ideas

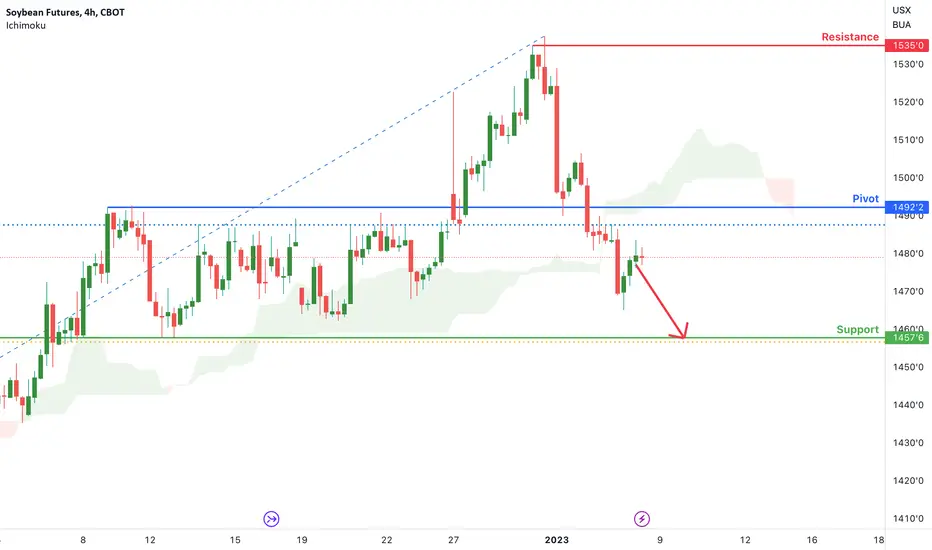
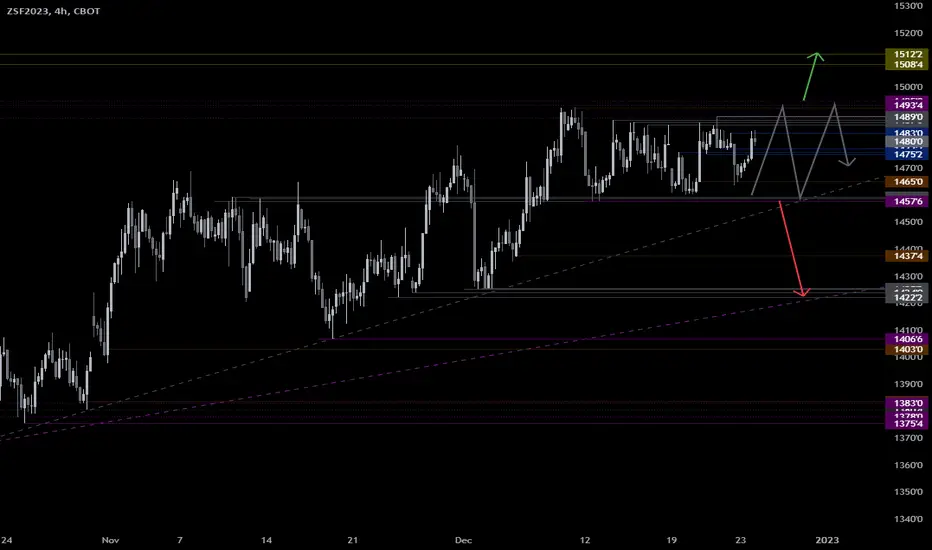
Soybean Futures ( ZS1! ), H4 Potential for Bearish DropTitle: Soybean Futures ( ZS1! ), H4 Potential for Bearish Drop
Type: Bearish Drop
Resistance: 1535.00
Pivot: 1492.25
Support: 1457.75
Preferred case: Looking at the H4 chart, my overall bias for ZS1! is bearish due to the current price being under the Ichimoku cloud , indicating a bearish market. If this bearish momentum continues, expect price to possibly continue heading towards the support at 1457.75, where the 61.8% Fibonacci line is.
Alternative scenario: Price may head back up to retest the pivot at 1492.25, where the 38.2% Fibonacci line is.
Fundamentals: There are no major news.
Soybean Futures ( ZS1! ), H4 Potential for Bearish DropTitle: Soybean Futures ( ZS1! ), H4 Potential for Bearish Drop
Type: Bearish Drop
Resistance: 1535.00
Pivot: 1492.25
Support: 1457.75
Preferred case: Looking at the H4 chart, my overall bias for ZS1! is bearish due to the current price being under the Ichimoku cloud, indicating a bearish market. If this bearish momentum continues, expect price to possibly continue heading towards the support at 1457.75, where the 61.8% Fibonacci line is.
Alternative scenario: Price may head back up to retest the pivot at 1492.25, where the 38.2% Fibonacci line is.
Fundamentals: There are no major news.
Daily ZS analysisDaily ZS analysis
Sell trade with target and stop loss as shown in the chart
The trend is down and we may see more drop in the coming period in the medium term
All the best, I hope for your participation in the analysis, and for any inquiries, please send in the comments.
He gave a signal from the strongest areas of entry, special recommendations, with a success rate of 95%, for any inquiry or request for analysis, contact me
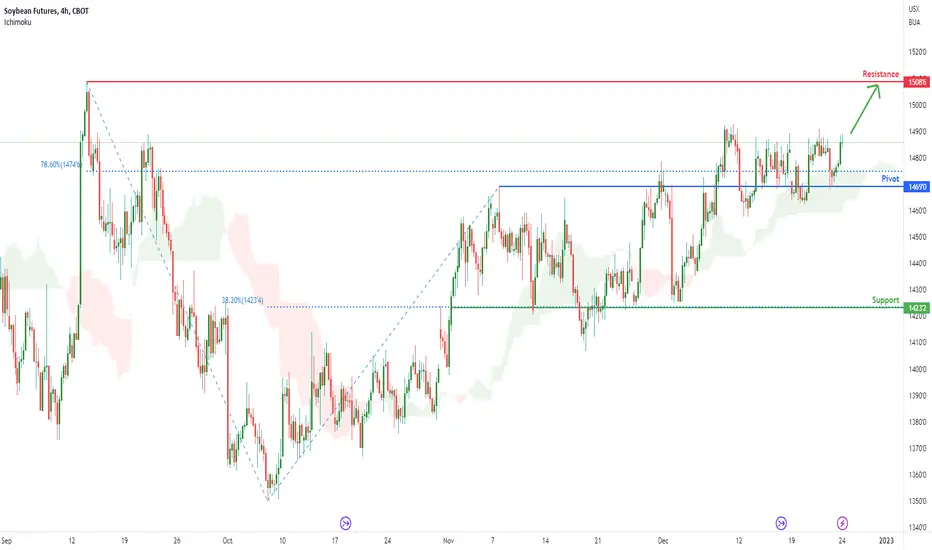
Soybean Futures ( ZS1! ), H4 Potential for Bullish ContinuationTitle: Soybean Futures ( ZS1! ), H4 Potential for Bullish Continuation
Type: Bullish Continuation
Resistance: 1535.00
Pivot: 1492.25
Support: 1457.75
Preferred case: Looking at the H4 chart, my overall bias for ZS1! is bullish due to the current price crossing above the Ichimoku cloud , indicating a bullish market. If this bullish momentum continues, expect price to possibly continue heading towards the resistance at 1535.00, where the recent high is
Alternative scenario: Price may head back down to break the pivot at 1492.25, where the 38.2% Fibonacci line is before heading towards the support at 1457.75, where the 61.8% Fibonacci line is.
Fundamentals: There are no major news.

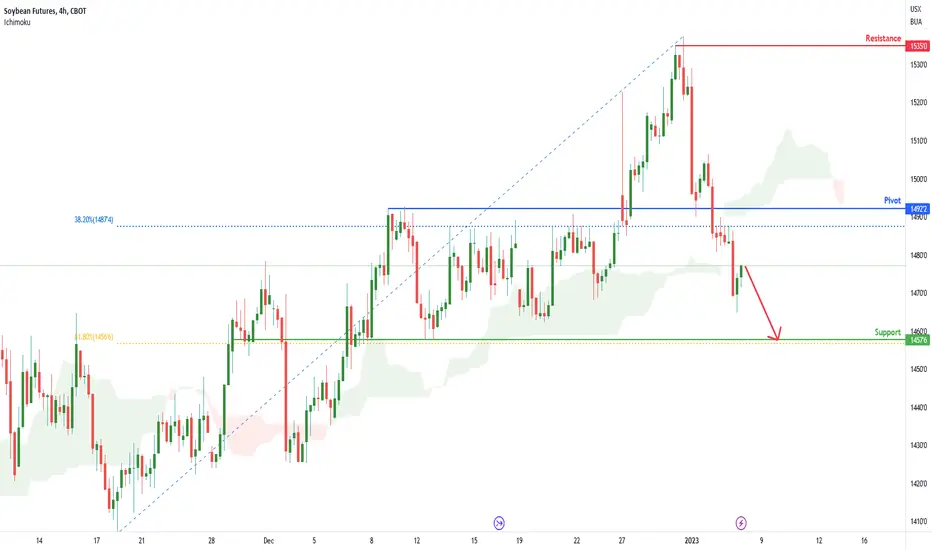
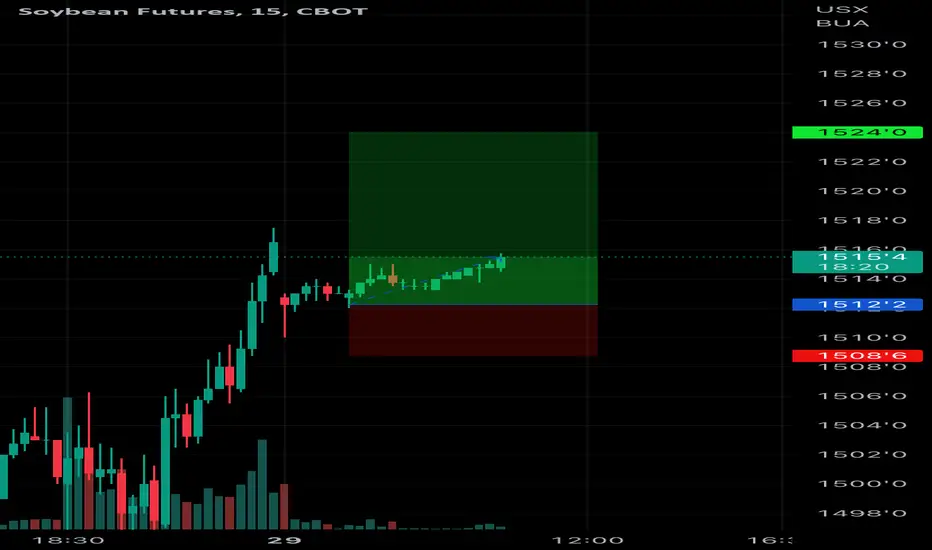
ZS1! Potential For Bearish DropLooking at the H4 chart, my overall bias for ZS1! is bearish due to the current price crossing below the Ichimoku cloud, indicating a bearish market. Looking for a sell entry at 1509.00, where the 38.2% Fibonacci line is. Stop loss will be at 1537.50, where the recent high is. Take profit will be at 1465.50, where the 38.2% Fibonacci line is.
Please be advised that the information presented on TradingView is provided to Vantage (‘Vantage Global Limited’, ‘we’) by a third-party provider (‘Everest Fortune Group’). Please be reminded that you are solely responsible for the trading decisions on your account. There is a very high degree of risk involved in trading. Any information and/or content is intended entirely for research, educational and informational purposes only and does not constitute investment or consultation advice or investment strategy. The information is not tailored to the investment needs of any specific person and therefore does not involve a consideration of any of the investment objectives, financial situation or needs of any viewer that may receive it. Kindly also note that past performance is not a reliable indicator of future results. Actual results may differ materially from those anticipated in forward-looking or past performance statements. We assume no liability as to the accuracy or completeness of any of the information and/or content provided herein and the Company cannot be held responsible for any omission, mistake nor for any loss or damage including without limitation to any loss of profit which may arise from reliance on any information supplied by Everest Fortune Group.

SHORTPrice moving within the boundary of Ellipse 2
If price stays within this ellipse then terminus is again at 1800 in May before a correction starts.
However, giving the cyclic structure completing within the square price will continue to decline if it stays below 1557 usd.
First TP is at 1142 usd.
Trade safe

Soybean Weekly Forecast (January 3 – 5, 2023)Uptrend scenario
An uptrend will start as soon, as the market rises above resistance level 1530, which will be followed by moving up to resistance level 1555.
Downtrend scenario
An downtrend will start as soon, as the market drops below support level 1508, which will be followed by moving down to support level 1487 and 1462.

Soybean Monthly Forecast, January 2023Uptrend scenario
The uptrend continuation is not expected this month.
Downtrend scenario
An downtrend will start as soon, as the market drops below support level 1508, which will be followed by moving down to support level 1462, 1433 and 1400..

Soybeans bucking the bear trends in commoditiesSoybean fund SOYB was added recently as the seasonal is positive into next summer and the technicals have been constructive. Most recently it took out resistance, turning it to support.
Daily ZS analysisDaily ZS analysis
A long position with the target and stop loss as shown in the chart
The trend is up, we may see more upside
All the best, I hope for your participation in the analysis, and for any inquiries, please send in the comments.
He gave a signal from the strongest areas of entry, special recommendations, with a success rate of 95%, for any inquiry or request for analysis, contact me
We've seen this blowoff top movie beforeBeans have topped in a similar way multiple times this year. Rallying hard and giving it back intraday for a terrible looking candlestick.

Weekly Forecast (December 27 – 30, 2022)Uptrend scenario
An uptrend will start as soon, as the market rises above resistance level 1495, which will be followed by moving up to resistance level 1512.
Downtrend scenario
An downtrend will start as soon, as the market drops below support level 1457, which will be followed by moving down to support level 1422.
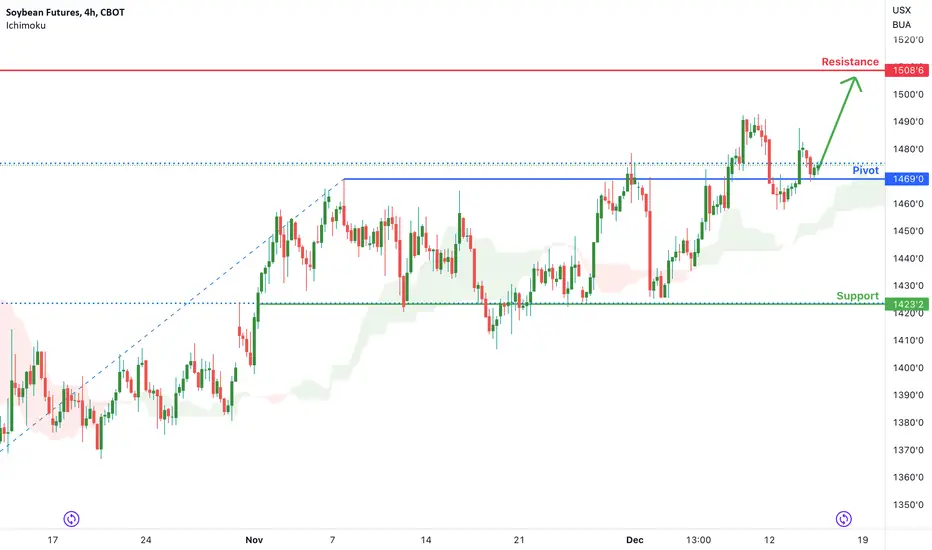
Soybean Futures ( ZS1! ), H4 Potential for Bullish ContinuationTitle: Soybean Futures ( ZS1! ), H4 Potential for Bullish Continuation
Type: Bullish Continuation
Resistance: 1508.75
Pivot: 1469.00
Support: 1423.25
Preferred case: Looking at the H4 chart, my overall bias for ZS1! is bullish due to the current price crossing above the Ichimoku cloud , indicating a bullish market. If this bullish momentum continues, expect price to possibly break the pivot at 1469.00, where the previous high and 78.6% Fibonacci line are before heading towards the resistance level at 1508.75, where the previous swing high is.
Alternative scenario: Price may head back down to the support at 1423.25, where the 38.2% Fibonacci line is.
Fundamentals: There are no major news.
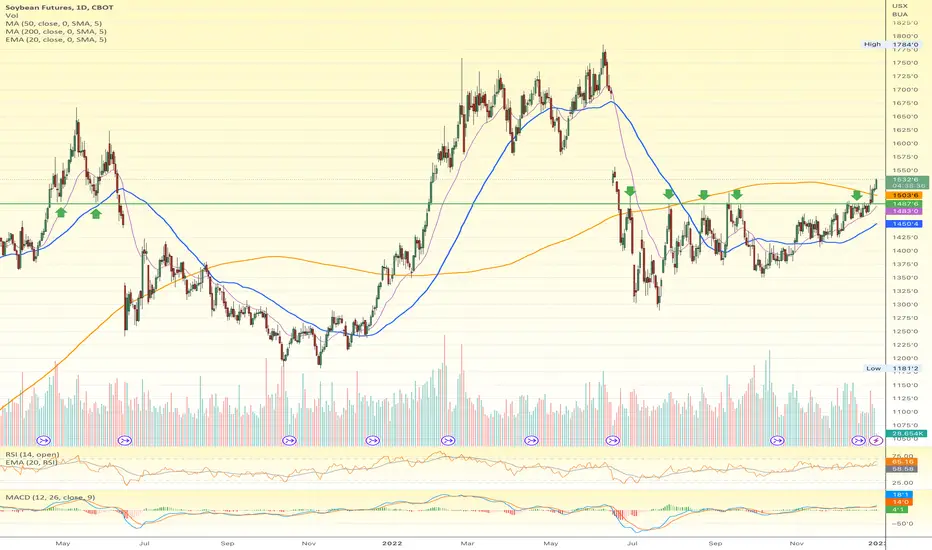
Soybeans Ten Month Buy Signal The Soybean futures market is generating a buy signal based on the monthly time frame based on the "Time@Mode Methodology".
Notice the 8 month sideways action around the green horizontal line in 2021 which set up what turned into a 7 month rally into June 2022. When "time expires" the market tends to form a new mode at that price level (within the range of the 8th month) or it returns to the mode previous to the trend. You can see there was a sharp move down in July 2021 but it didn't return to the old mode, which is constructive long term.
The white and yellow projection lines are the previous two rallies added to the current "mode" at 1434'2. The green box is the range around the mode added to the mode to provide 1x and 2x's that range for a price projection potential.
The 50% speed line is a reference line to indicate if the market is holding above the half-speed of the move from the lowest low to the highest high. You can see clearly that the 50% speed line held in that pullback in July 2021.
This has been a long time building this mode and the bigger the mode, the bigger the rally.
The risk is a move back under the mode, which is the December low.
Wishing you all well.
Happy Holidays and Happy New Years!!
Tim
1:48PM EST 12/23/2022
1490 last $ZSK2023
Wishing you all the best

Soybean Futures ( ZS1! ), H4 Potential for Bullish ContinuationTitle: Soybean Futures ( ZS1! ), H4 Potential for Bullish Continuation
Type: Bullish Continuation
Resistance: 1508.75
Pivot: 1469.00
Support: 1423.25
Preferred case: Looking at the H4 chart, my overall bias for ZS1! is bullish due to the current price crossing above the Ichimoku cloud , indicating a bullish market. If this bullish momentum continues, expect price to possibly break the pivot at 1469.00, where the previous high and 78.6% Fibonacci line are before heading towards the resistance level at 1508.75, where the previous swing high is.
Alternative scenario: Price may head back down to the support at 1423.25, where the 38.2% Fibonacci line is.
Fundamentals: There are no major news.
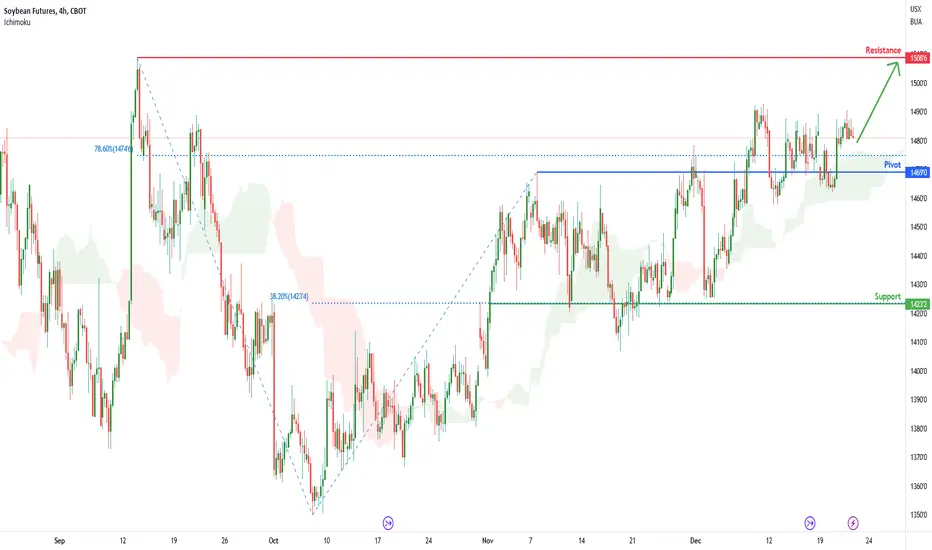
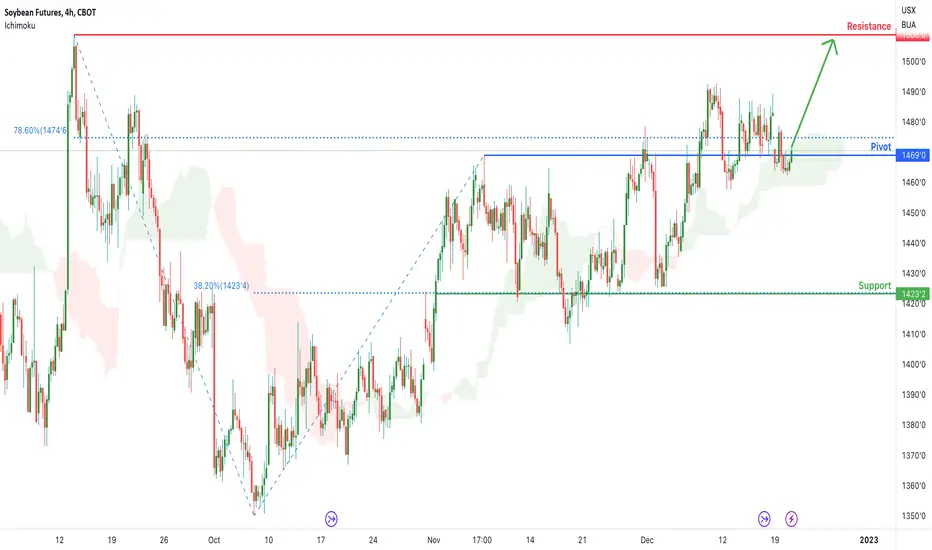
Soybean Futures ( ZS1! ), H4 Potential for Bullish ContinuationTitle: Soybean Futures ( ZS1! ), H4 Potential for Bullish Continuation
Type: Bullish Continuation
Resistance: 1508.75
Pivot: 1469.00
Support: 1423.25
Preferred case: Looking at the H4 chart, my overall bias for ZS1! is bullish due to the current price being above the Ichimoku cloud , indicating a bullish market. If this bullish momentum continues, expect price to possibly continue heading towards the resistance level at 1508.75, where the previous swing high is.
Alternative scenario: Price may head back down to break the pivot at 1469.00, where the previous high and 78.6% Fibonacci line are before heading to the support at 1423.25, where the 38.2% Fibonacci line is.
Fundamentals: There are no major news.
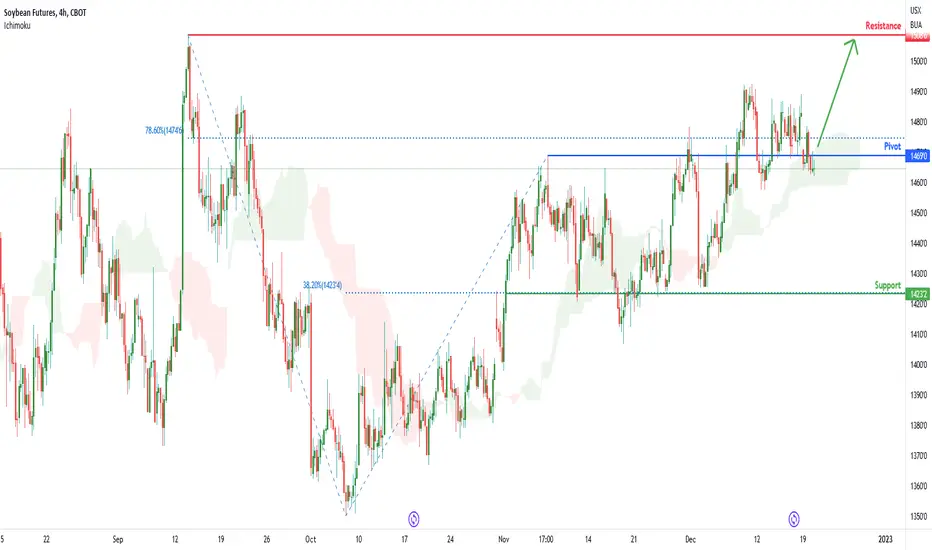
Soybean Futures ( ZS1! ), H4 Potential for Bullish ContinuationTitle: Soybean Futures ( ZS1! ), H4 Potential for Bullish Continuation
Type: Bullish Continuation
Resistance: 1508.75
Pivot: 1469.00
Support: 1423.25
Preferred case: Looking at the H4 chart, my overall bias for ZS1! is bullish due to the current price being above the Ichimoku cloud , indicating a bullish market. If this bullish momentum continues, expect price to possibly continue heading towards the resistance level at 1508.75, where the previous swing high is.
Alternative scenario: Price may head back down to break the pivot at 1469.00, where the previous high and 78.6% Fibonacci line are before heading to the support at 1423.25, where the 38.2% Fibonacci line is.
Fundamentals: There are no major news.
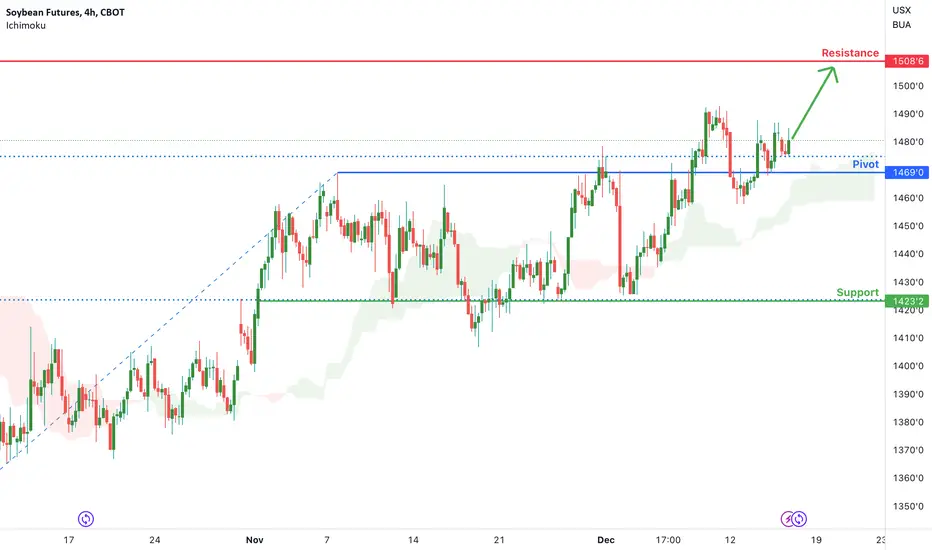