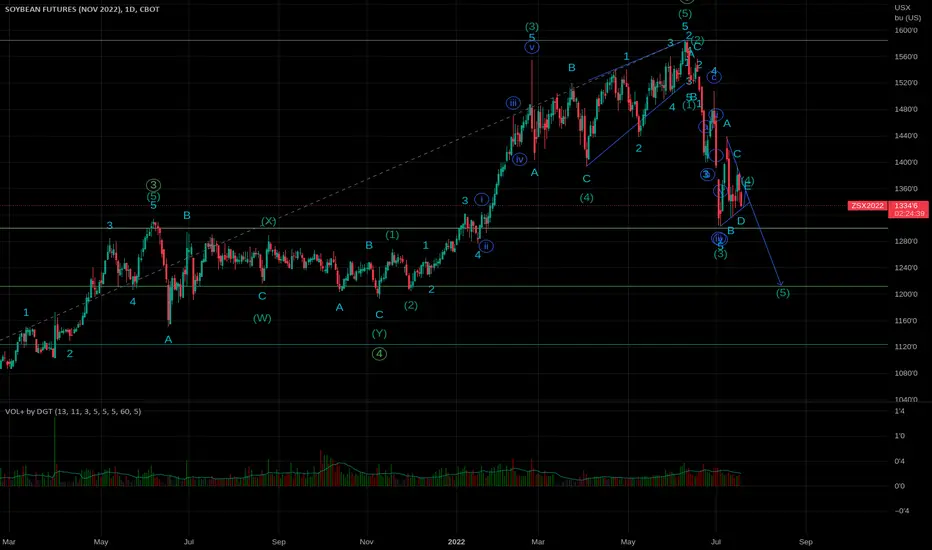
Soybean Wave Count Has Options, Seasonality is BearishSoybeans currently have two equally likely wave counts.
The preferred count above, the blue line, implies that soybeans are currently in primary wave C of a zigzag correction. All subwaves support this count, and it also agrees with soybeans seasonality, which is bearish until late September.
The alternate count above, the yellow line, implies that soybeans have already completed a WXY double zigzag correction and are currently in intermediate wave 3 up. All subwaves also support this count (I know this seems unlikely, but it is possible to count intermediate wave B above as both an impulse and a zigzag. It looks like a zigzag, but if you count it as an impulse, wave 4 doesn't overlap with wave 1) but this count contradicts soybeans seasonality.
I place more weight on the Elliott wave model than on seasonality. However, when two wave counts seem equally likely, we need a tie-breaker, and seasonality can be remarkably reliable in agricultural commodities.
MZL1! trade ideas

Soybeans Retest the Recent HighsFundamental Snapshot
Crop Progress
Yesterday’s weekly crop progress report showed further declining crop conditions. Good/Excellent conditions for soybeans were down 1%, to 59%, which was in line with expectations. However, corn G/E ratings fell 3%, to 58%, 2% lower than expectations.
Private Estimates
DTN released their yield estimates for corn and soybeans yesterday afternoon, and boy were they bullish. They have the national average corn yield at 167.2 bushels per acre, well below the USADA’s July estimate of 177. We have been assuming the market has been trading 174-175. DTN’s estimate for soybean yield comes in at 48.9, well below the USDA’s 51.5. As with corn, we’ve been assuming the market is trading closer to 50bpa.
WASDE Estimates
Reuters has complied estimates for Friday’s WASDE report. The average analyst estimate for corn yield is 175.9, with production at 14.392. The average estimate for soybean yield is 51.1, with production at 4.481.
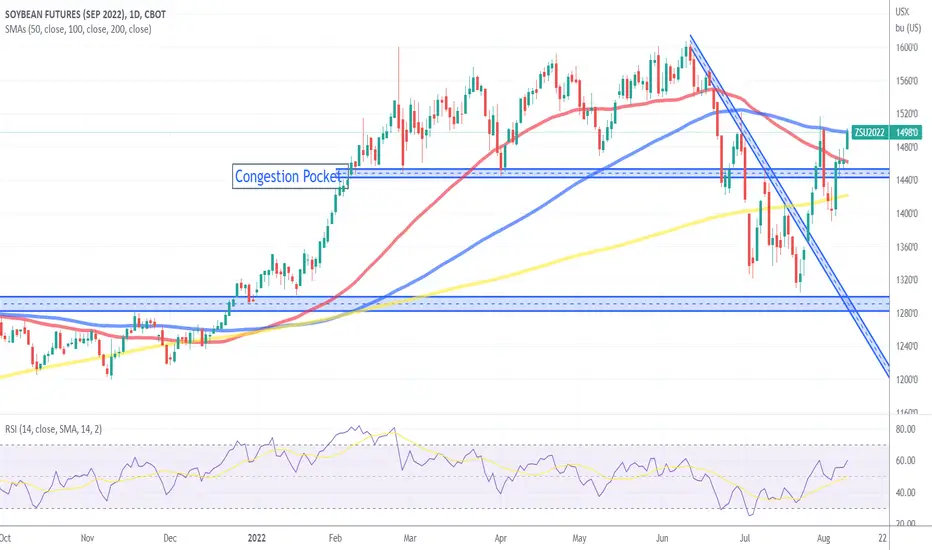
Soybeans (September): As with corn futures, soybean futures got some friendly news yesterday afternoon which has helped move prices out above first resistance, taking prices to our next pocket, 1498-1503. This pocket represents previously important price points and the 100-day moving average. Above this pocket, resistance comes in in the low to mid 1520's. If the market gets out above that area, there's not a lot of resistance until closer to $16.00.
Bias: Neutral
Previous Session Bias: Neutral
Resistance: 1498-1503***, 1521 ¼***
Pivot: 1475-1480
Support: 1444 ½-1455***, 1400-1411 ¾***, 1360-1366 ½****
Futures trading involves substantial risk of loss and may not be suitable for all investors. Trading advice is based on information taken from trade and statistical services and other sources Blue Line Futures, LLC believes are reliable. We do not guarantee that such information is accurate or complete and it should not be relied upon as such. Trading advice reflects our good faith judgment at a specific time and is subject to change without notice. There is no guarantee that the advice we give will result in profitable trades. All trading decisions will be made by the account holder. Past performance is not necessarily indicative of future results.

Soybean Futures (ZS1!), H4 Potential for Bullish RiseType : Bullish Rise
Resistance : 1508'4
Pivot: 1438'6
Support : 1400'4
Preferred Case: On the H4, with prices moving above the ichimoku indicator and broken out of the descending trendline , we have a bullish bias that price will rise from the pivot at 1438'6 where the pullback support and 23.6% fibonacci retracement are to the 1st resistance at 1508'4 where the swing high resistance is.
Alternative scenario: Alternatively, price could break pivot structure and drop to the 1st support at 1400'4 where the pullback support, 38.2% fibonacci retracement and 78.6% fibonacci projection are.
Fundamentals: Since Russia and Ukraine are major exporter of agriculture goods, their persistent war will lead to a shortage of agricultural goods and give us a bullish bias for soybean .

SOYBEAN FUTURESA good, strong ascent and now trades at a strong display area and good resistance and in penetrating it will continue to climb strongly
Soybeans Rally Over $1.00 Off Friday's LowSoybeans
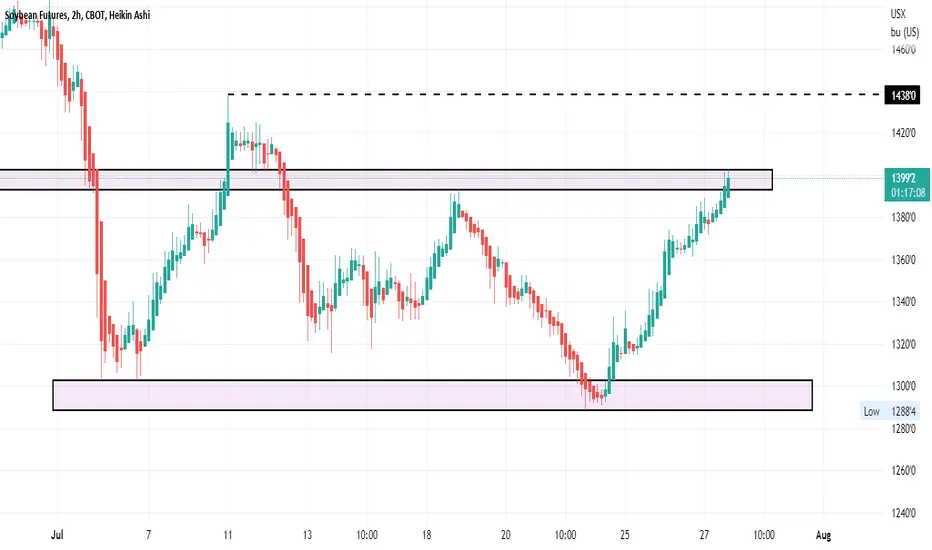
Technicals (September): September wheat futures are officially over a dollar off Friday’s low, testing the 200-day moving average and the upper end of our first resistance pocket, 1411 ¾. If the Bulls can keep the momentum going above here, we could see a retest of the congestion pocket from 1444 ½-1455. Our bias has been at Neutral/Bullish aka cautiously optimistic, but a retest of the congestion pocket may have us looking back to neutral and possibly bearish.
Bias: Neutral/Bullish
Previous Session Bias: Neutral/Bullish
Resistance: 1444 ½-1455****
Pivot: 1400-1411 ¾
Support: 1360-1366 ½****, 1321 ½-1324 ¾***, 1300-1304 ½**
Futures trading involves substantial risk of loss and may not be suitable for all investors. Trading advice is based on information taken from trade and statistical services and other sources Blue Line Futures, LLC believes are reliable. We do not guarantee that such information is accurate or complete and it should not be relied upon as such. Trading advice reflects our good faith judgment at a specific time and is subject to change without notice. There is no guarantee that the advice we give will result in profitable trades. All trading decisions will be made by the account holder. Past performance is not necessarily indicative of future results.

Go long next daysGo long next days, we have a strong probability that the soybeans will rise approximately 8% at least

Soybeans shorts always at the 0.618 levelSimply trailing the short exit stop above the two hour high

soybean shortU.S. corn futures fell to two-week lows and new-crop soybeans hit a six-month low on Thursday on improving crop weather in the Midwest and news of a deal to restart Ukraine's Black Sea grain exports, traders said.
GRAINS-Corn, soy, wheat fall on U.S. crop weather, Ukraine exports pact muabanphaisinh.vn

Soybeans Threatening the Recent Lows Soybeans
Fundamentals: This morning’s weekly export sales report showed Net sales of 203,500 MT for 2021/2022 and 254,700 MT for 2022/2023. Yesterday morning, private exporters reported sales of 136,000 metric tons of soybeans for delivery to China during the 2022/2023 marketing year.
Technicals: The 200-day moving average has held as support over the last few weeks, but it's looking as though that may be coming to an end with prices threatening the low end of the range from July 5th and 6th. A break and close below this pocket could take us closer to the psychologically significant $14.00 handle.
Bias: Neutral
Previous Session Bias: Neutral
Resistance: 1495-1505****, 1513 ¼-1516 ½***, 1530-1538***, 1552 ¾-1560***
Pivot: 1452-1461 ¼
Support: 1413 3/4-1424 1/4***, 1400-1403****
Futures trading involves substantial risk of loss and may not be suitable for all investors. Trading advice is based on information taken from trade and statistical services and other sources Blue Line Futures, LLC believes are reliable. We do not guarantee that such information is accurate or complete and it should not be relied upon as such. Trading advice reflects our good faith judgment at a specific time and is subject to change without notice. There is no guarantee that the advice we give will result in profitable trades. All trading decisions will be made by the account holder. Past performance is not necessarily indicative of future results.
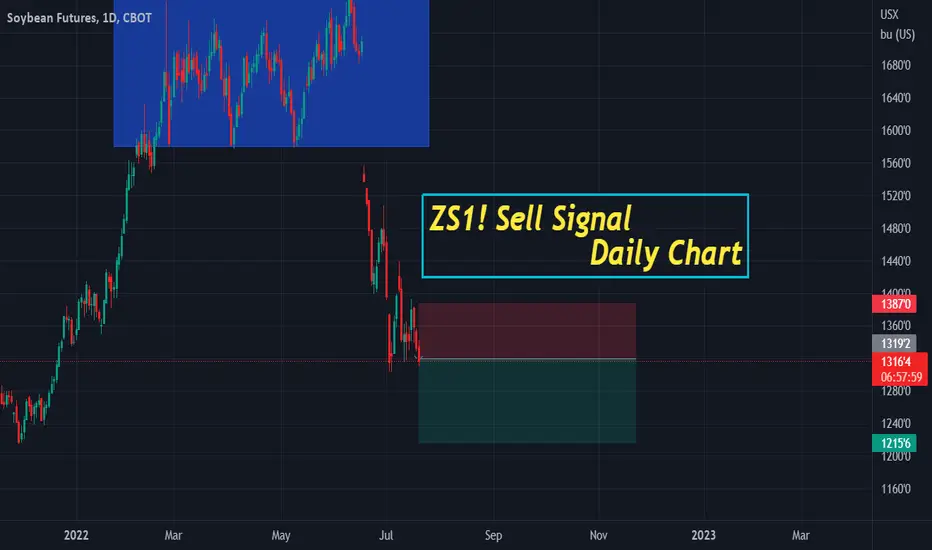
Soybeans market continue on fallingDear investors, last week soybean market confirmed the start of a bear market, and through my analysis, I concluded that the price level of ZS shows a high probability to continue its downfall next week towards the 120s.
Contact me for more details.
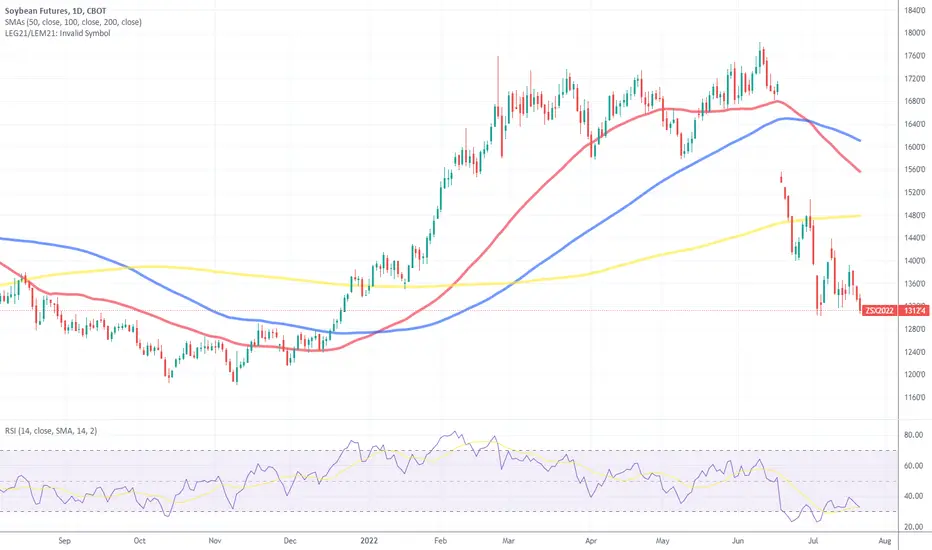
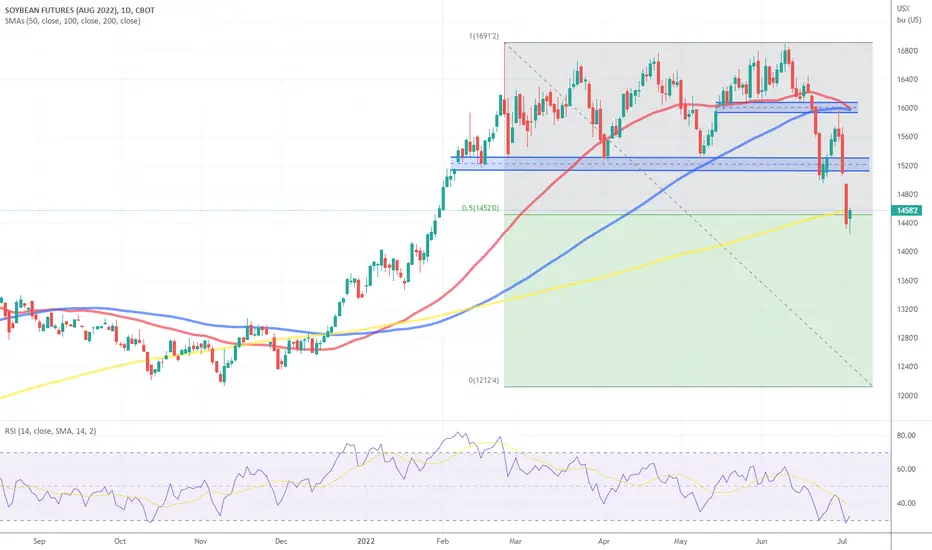
Soybeans Finishing Intermediate Wave 4 with Bearish Seasonality
Soybeans are currently in minor wave D of an intermediate wave 4 triangle. Once soybeans break out of the triangle, they will begin intermediate wave 5 down to at least the 1212'4 (0.5 Fibonacci level) area for November soybeans, possibly lower.
This is also happening during the summer months when soybean prices typically decrease. If you bought soybeans on July 20 and sold soybeans on September 28 every year for the past 8 years, you would have lost money for 6 of those years (75%).
Crop Conditions DeclineSoybeans
Fundamentals: Yesterday’s weekly export inspections came in at 362,622 metric tons, roughly 4,000 more than last week. The weekly Crop Progress report showed good/excellent conditions at 61%, 1% lower than last week. 48% of the crop is blooming.
Technicals: August soybean futures ran up into our congestion pocket yesterday, which we had listed as 1513 ¼-1516 ½. The market was unable to get out above this pocket which led to some profit taking into the close. That profit taking has continued into the overnight and early morning trade, as prices retreat to give back all of yesterday’s gains. The 200-day moving average has acted as good support over the last two-weeks, we will see if it holds again. That comes in at 1466 ¼. As with corn, our bias remains Neutral as we see short term opportunities for participants on both sides of the market.
Bias: Neutral
Previous Session Bias: Neutral
Resistance: 1513 ¼-1516 ½***, 1530-1538***, 1552 ¾-1560***
Pivot: 1495-1505
Support: 1466 ¼**, 1444-1452**, 1413 3/4-1424 1/4***, 1400-1403****
Futures trading involves substantial risk of loss and may not be suitable for all investors. Trading advice is based on information taken from trade and statistical services and other sources Blue Line Futures, LLC believes are reliable. We do not guarantee that such information is accurate or complete and it should not be relied upon as such. Trading advice reflects our good faith judgment at a specific time and is subject to change without notice. There is no guarantee that the advice we give will result in profitable trades. All trading decisions will be made by the account holder. Past performance is not necessarily indicative of future results.

August Soybean Futures Update
Soybeans
Commitments of Traders Update: Friday's CoT report showed Managed Money were net sellers of 25,717 futures/options contracts through July 12th. Majority of this was long liquidation, 17,257 contracts. This shrinks the net position of Managed Money to 95,711 contracts.
Technicals (August) : Soybeans have been frequent flyers of the 200-day moving average recently, which has held as good support. Futures are higher in the early morning trade, testing the upper end of the back half of last week's trade. If the Bulls can sustain this momentum through the open, we could see an extension towards the psychologically significant $15 handle and above that, our congestion pocket near 1515.
Bias: Neutral
Previous Session Bias: Neutral
Resistance: 1495-1505****, 1513 ¼-1516 ½***, 1530-1538***, 1552 ¾-1560***
Pivot: 1452-1461 ¼
Support: 1413 3/4-1424 1/4***, 1400-1403****
Futures trading involves substantial risk of loss and may not be suitable for all investors. Trading advice is based on information taken from trade and statistical services and other sources Blue Line Futures, LLC believes are reliable. We do not guarantee that such information is accurate or complete and it should not be relied upon as such. Trading advice reflects our good faith judgment at a specific time and is subject to change without notice. There is no guarantee that the advice we give will result in profitable trades. All trading decisions will be made by the account holder. Past performance is not necessarily indicative of future results.

On The EdgeSoybeans
Fundamentals: Chinese GDP missed expectations last night, coming in at .4% in the second quarter from a year ago. Analysts were expecting growth at 1%. Retail sales in China rose more than expected, to 3.1%. On deck is U.S. retail sales, 7:30 AM CT. This will likely have an impact on outside markets, which have recently had an impact on money-flow in commodities. Expectations are for .8% month over month.
Techncials: August soybeans continue to linger near the 200-day moving average, trading on it for 7 out of the last 9 sessions. Our pivot pocket remains intact from 1452-1461 ¼. A break and close below here could lead to a retest of last week’s lows. If the Bulls can continue to defend support, the first upside objective would be 1495-1505. With that said, our feelings on soybeans are similar to corn, where we think there could continue to be multiple short-term opportunities for market participants on both sides of the market.
Bias: Neutral
Previous Session Bias: Neutral
Resistance: 1495-1505*, 1513 ¼-1516 ½, 1530-1538*, 1552 ¾-1560
Pivot: 1452-1461 ¼
Support: 1413 ¾-1424 ¼, 1400-1403**
Futures trading involves substantial risk of loss and may not be suitable for all investors. Trading advice is based on information taken from trade and statistical services and other sources Blue Line Futures, LLC believes are reliable. We do not guarantee that such information is accurate or complete and it should not be relied upon as such. Trading advice reflects our good faith judgment at a specific time and is subject to change without notice. There is no guarantee that the advice we give will result in profitable trades. All trading decisions will be made by the account holder. Past performance is not necessarily indicative of future results.

Soybean futures - shortShort-term sell, a perfect flat structure (3-3-5).
Trade safe, mind your stops

SOYBEAN FUTURESVery strong downward momentum and God willing to continue its strong descent and achieve good bottoms
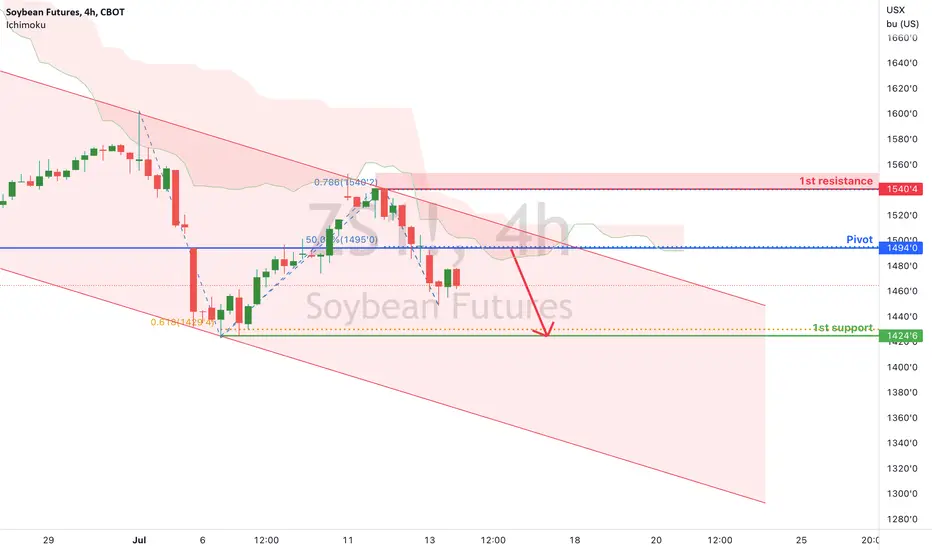
Soybean Futures (ZS1!), H4 Potential for Bearish DropType : Bearish Momentum
Resistance : 1540'4
Pivot: 1494'0
Support : 1424'6
Preferred Case: On the H4, with price moving below the ichimoku cloud and within the descending channel , we have a bearish bias that price will rise and drop from the pivot at 1494'0 in line with the pullback resistance and 50% fibonacci retracement to the 1st support at 1424'6 where the swing low support and 61.8% fibonacci projection are.
Alternative scenario: Alternatively, price may break pivot structure and rise to the 1st resistance at 1540'4 where the swing high resistance and 78.6% fibonacci projection are.
Fundamentals: Since both countries, Russia and Ukraine, are major exporter of agriculture goods and their persistent war will lead to a shortage of agricultural goods and give us a bullish bias for soybean .
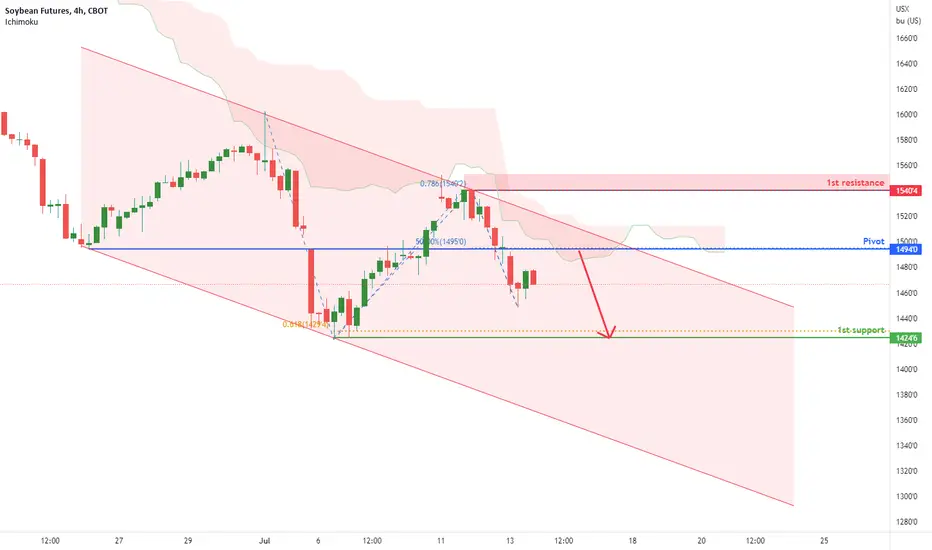
Soybean Futures (ZS1!), H4 Potential for Bearish DropType : Bearish Momentum
Resistance : 1540'4
Pivot: 1494'0
Support : 1424'6
Preferred Case: On the H4, with price moving below the ichimoku cloud and within the descending channel, we have a bearish bias that price will rise and drop from the pivot at 1494'0 in line with the pullback resistance and 50% fibonacci retracement to the 1st support at 1424'6 where the swing low support and 61.8% fibonacci projection are.
Alternative scenario: Alternatively, price may break pivot structure and rise to the 1st resistance at 1540'4 where the swing high resistance and 78.6% fibonacci projection are.
Fundamentals: Since both countries, Russia and Ukraine, are major exporter of agriculture goods and their persistent war will lead to a shortage of agricultural goods and give us a bullish bias for soybean .
Soybeans Gap Higher, Will it Hold?Soybeans
Technicacls: The market sling-shotted higher last night. Our first resistance in Friday’s report was 1495-1505. Our next resistance pocket didn’t come in until 1560-1566, which the market came very close to tagging last night. As with corn, we are in the sell rallies camp. A conviction close or consecutive close back above $16.00 would neutralize that bias. First support/our pivot point comes in from 1513 ¼-1516 ¼.
Bias: Neutral/Bearish
Previous Session Bias: Neutral/Bearish
Resistance: 1560-1566***, 1592-1597***
Pivot: 1513 ¼-1516 ½
Support: 1495-1505***, 1452-1457***, 1413 3/4-1424 1/4***, 1400-1403****
Futures trading involves substantial risk of loss and may not be suitable for all investors. Trading advice is based on information taken from trade and statistical services and other sources Blue Line Futures, LLC believes are reliable. We do not guarantee that such information is accurate or complete and it should not be relied upon as such. Trading advice reflects our good faith judgment at a specific time and is subject to change without notice. There is no guarantee that the advice we give will result in profitable trades. All trading decisions will be made by the account holder. Past performance is not necessarily indicative of future results.

Soybean: another pullback after breakout?Soybean price rebounded from previous swing high
Price may retest trendline above and probably breakout before another pullback into the range.
Bearish momentum may go a bit further..

Soybeans Treading Near Significant Levels Soybeans
Seasonal Trends in Play: Short November soybeans from 7/1-8/31. This has been profitable for 13 of the last 15 years with the average gain being roughly 40 cents, or $2,000 per one 5,000-bushel contract.
Fundamentals: Yesterday's weekly Crop Progress report showed good/excellent conditions at 63%, this is a 2% drop from last week and 1% lower than expectations. Compared to last year, that number is 4% better. 3% of the crop is setting pods and 16% is blooming. Weekly export inspections came in at 354,987 metric tons, below the range of estimates.
Technicals: Soybeans got taken to the woodshed yesterday, breaking below the 200-day moving average and the 50% retracement. That forms a pocket form 1452-1457. If the Bulls can chive a close back above this pocket, we could see an attempt at filling the gap from yesterday's open, that comes in from 1495-1505. A failure to close back of this pocket could keep the selling pressure on. There's been significant technical damage done over the last few weeks, so a rally would likely just be relief in a downward trending market. Our bias remains in bearish territory, despite the high probability of a decent relief rally.
Bias: Neutral/Bearish
Previous Session Bias: Neutral/Bearish
Resistance: 1495-1505****, 1560-1566***, 1592-1597***
Pivot: 1452-1457
Support: 1413 3/4-1424 1/4***, 1400-1403****
Futures trading involves substantial risk of loss and may not be suitable for all investors. Trading advice is based on information taken from trade and statistical services and other sources Blue Line Futures, LLC believes are reliable. We do not guarantee that such information is accurate or complete and it should not be relied upon as such. Trading advice reflects our good faith judgment at a specific time and is subject to change without notice. There is no guarantee that the advice we give will result in profitable trades. All trading decisions will be made by the account holder. Past performance is not necessarily indicative of future results.
Soybean may go bearish after a short bull runSoybean chart currently approaching a significant area - reversal zone.
The bulls might run for a while. Will see if bearish structure and momentum come in later.
