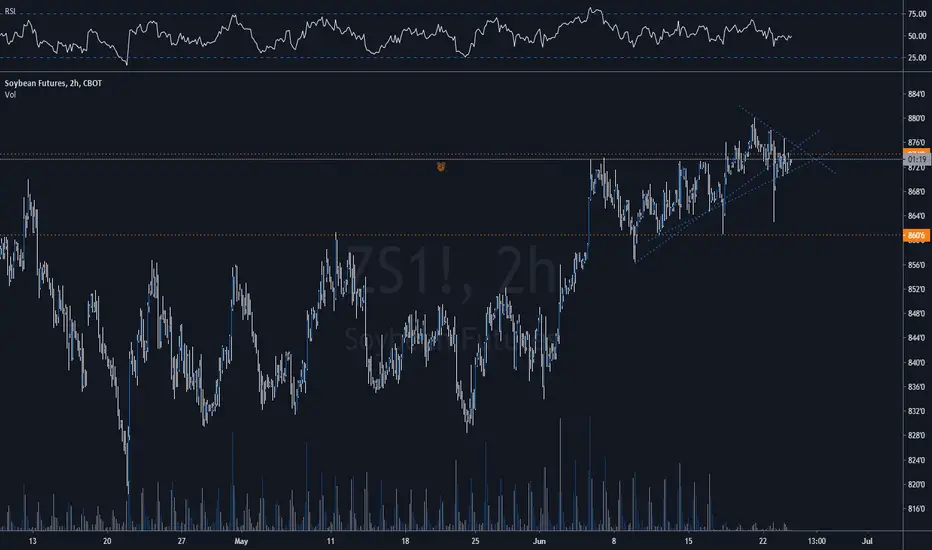
SOYBEAN IS TRYING TO MOVE AWAY FROM DOWNTREND - ZS1! - 30MNWe have observed several forces acting as a brake and pushing the price above the red down trending line. But a very strong squeeze front last tops have seen the market being inconsistent with its which to move upwards.
The two horizontal black lines are the new tops and bottoms of the horizontal trending range.
We could observe during this week a market which will try to break above by going directly to it or by finding first a a support point on the top of the red down trending line. The probability to see the market breaking above the black resistance line is less likely than seeing a pullback down again at that level. It could probably be a good sells entry point (possibily from Thursday). For the moment the last volume have shown signs of a force pushing up against sellers.
Keep an eyes on the $900 mark, still legit and try to trade it during the morning Asian session (Tokyo time from 9am30 to 12pm and opening of the Frankfurt & London 8am to 10am GMT0) as it is more stable and easy to read.
MZM1! trade ideas

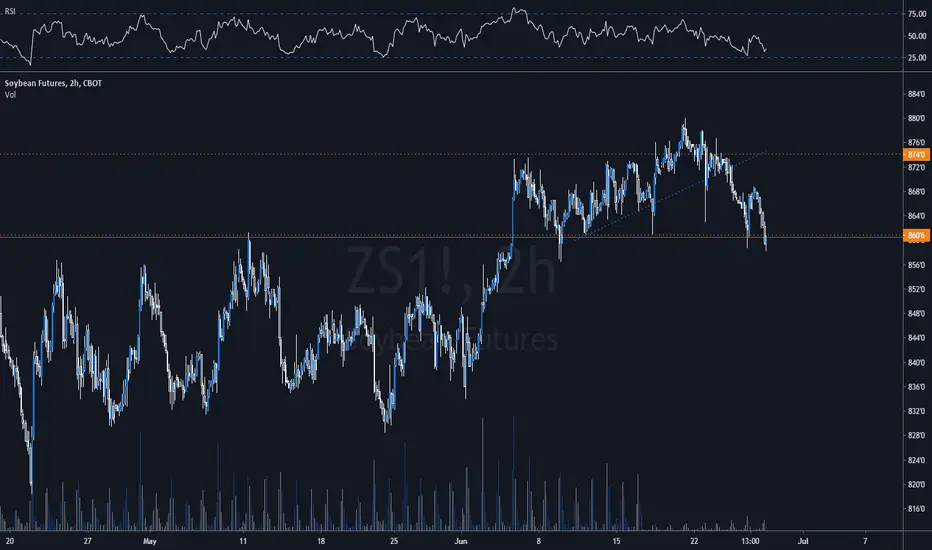
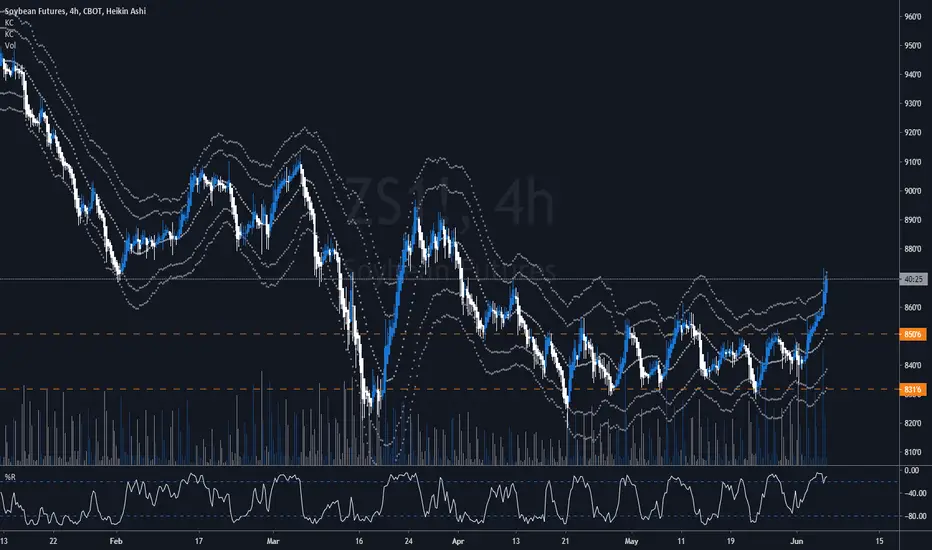
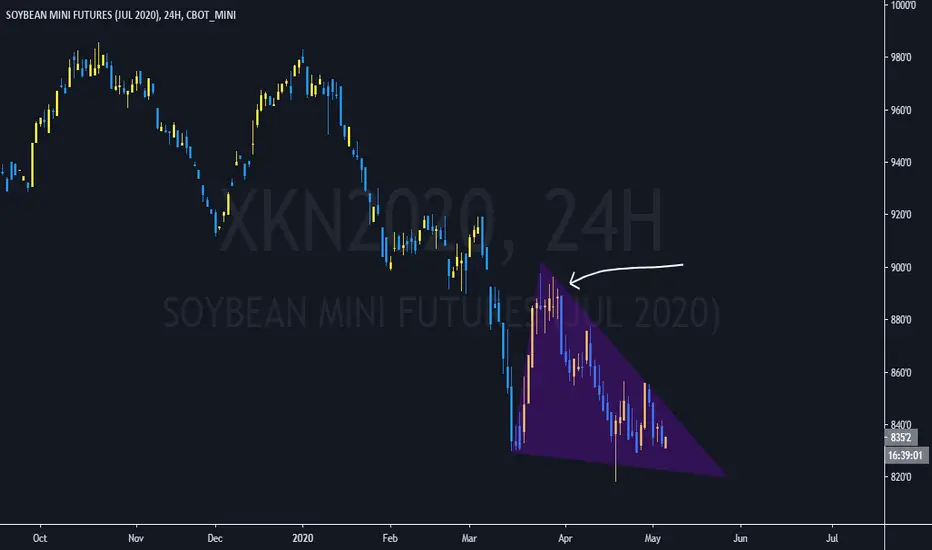
The ZS1 is showing some strong bearish down trendI see a strong movwe to the bottom since there is a strong volume confirming that. Also, it will be risky to go for long postions at least during this week.

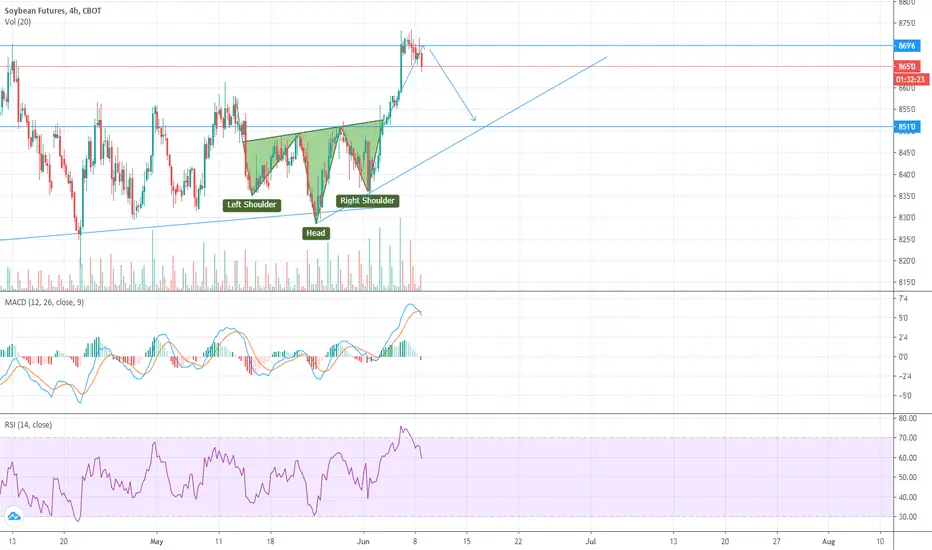
Soybean - 2 possible entriesWe already talked about coming decline in Soybean and finally, we are close to an entry. Commercials are heavily short and evaluation index shows Soybean is overvalued. If on Monday, we break below Friday’s low to form a lower high, that’s our entry. Otherway, wait till trendline breaks.

weekly SOYBEAN FUTURES analysisHello everyone
the weekly graph of this market shows the downward trend in the next week but it is necessary to wait for the breakout at 858.05 level for seller entry and be sure of gains
also we must be vigilant of the change in the direction of the market
please subscribe for more details
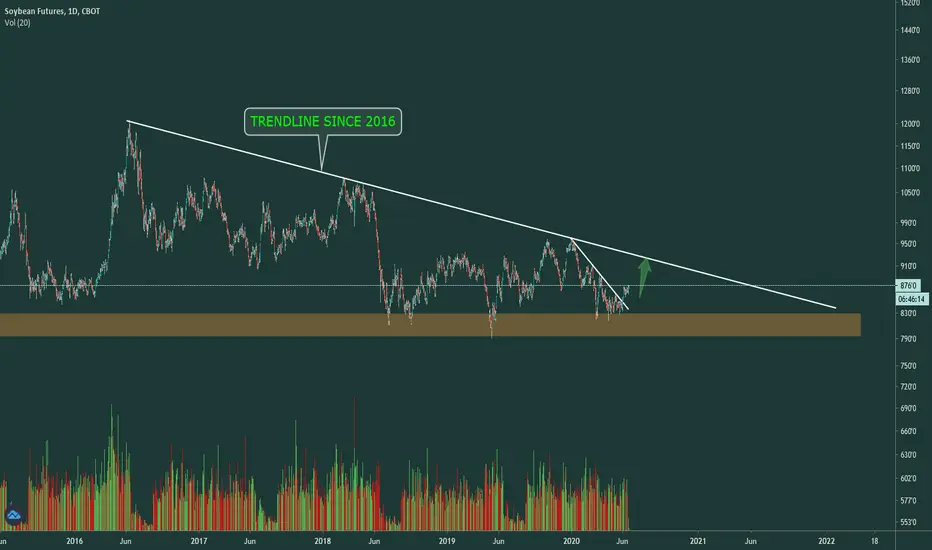
SOYBEAN FUTURES is to BUYHey traders, SOYBEAN FUTURES is in an upward push due to the filled gap, we can look for the previous one higher or even go above half of the fibonacci if the buyers manifest themselves.
Please LIKE & FOLLOW, thank you!

CRUCIAL MOMENT FOR SOYBEANS! CBOT:ZS1!
Hey traders! Before checking my idea, Please leave me a LIKE, it's free for you but precious for me!
GOOD LUCK!
BIG POTENTIAL!
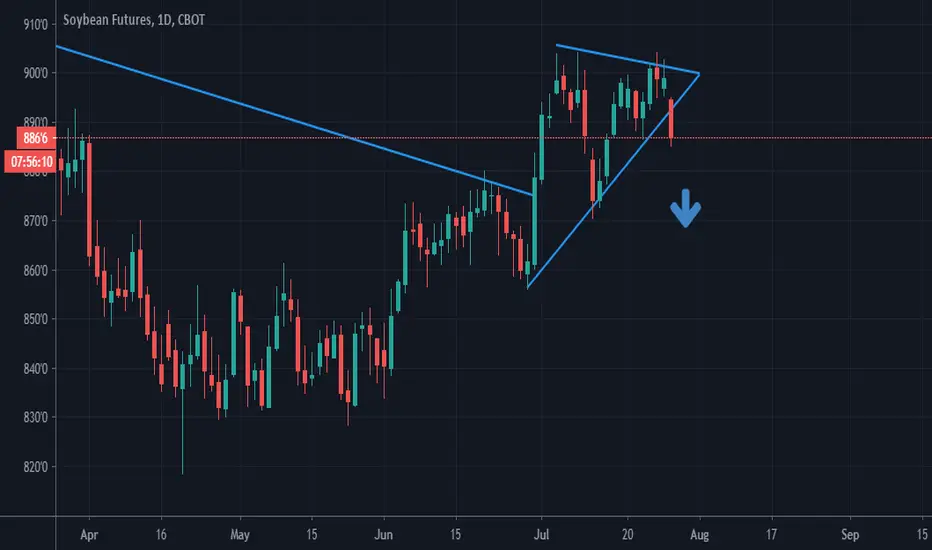
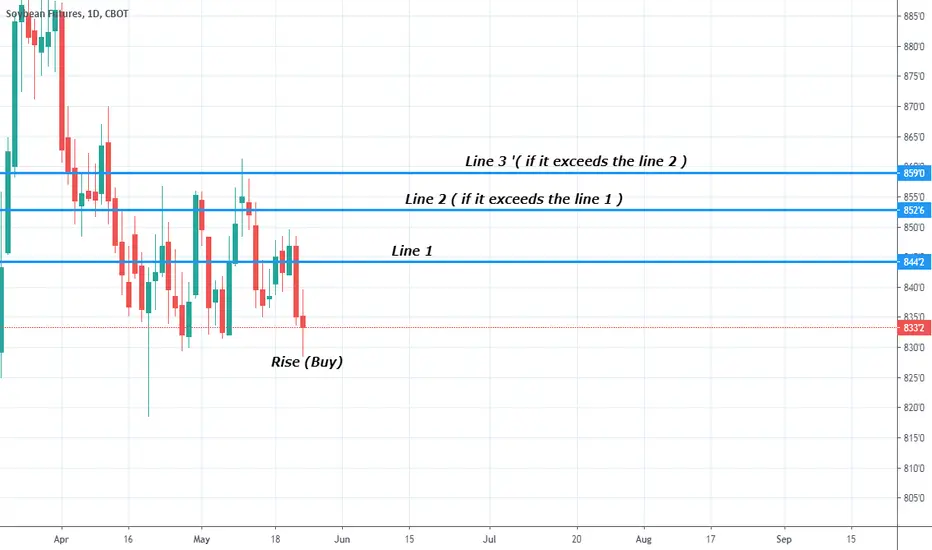
BUY SOYBEANSOYBEAN is heading toward the 903 level. If it breaks it, there is a high probability for it to test the PINK trendline and even breaks it to attain the YEARLY HIGH price of 961.
This price is very important for SOYBEAN market. If it breaks it again, there is a high probability for the price to skyrocket to the higher levels in YELLOW (1010,2) ORANGE (1069.2) and RED (1179.6).


ZS1! LONG TRADE IDEAEURAUD H4
=======
Analysis:
Big time frame
-Weekly has Price Action signal - big bull bar breakouts the daily resistance so the trend will go up to test the supply zone
Trading time frame
-Daily has big bull bar breakouts the daily resistance and pin bar rejected daily resistance, tenkan sen & kijun sen . The movement will go up to test the supply zone 1st
---------
Action:
-Wait:
1. Kumo cloud change color in daily time frame to confirm
2. RRR 2:1
=======
Bigger time frame weekly chart:

Correction on soybeansAfter reached high level ressistance on level 870 USD time to short position with take profit around 850-853 USD
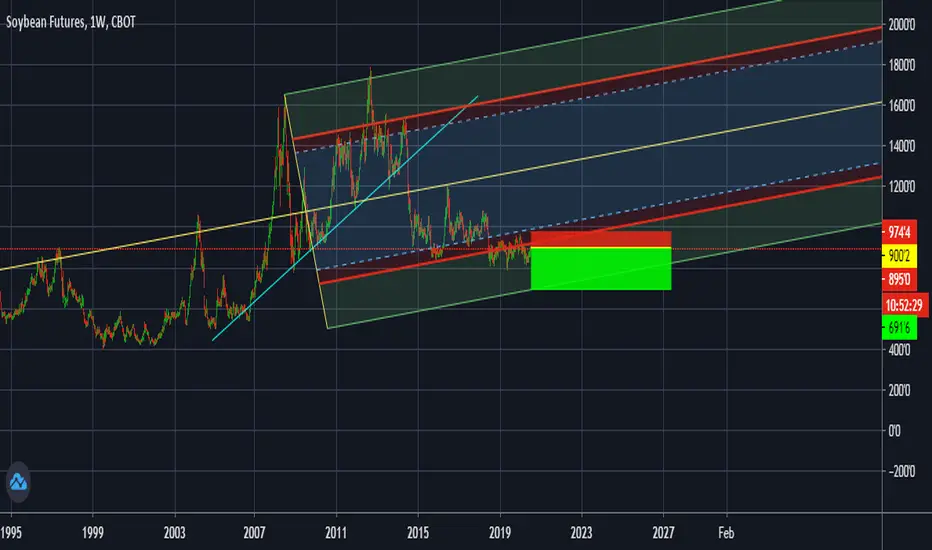
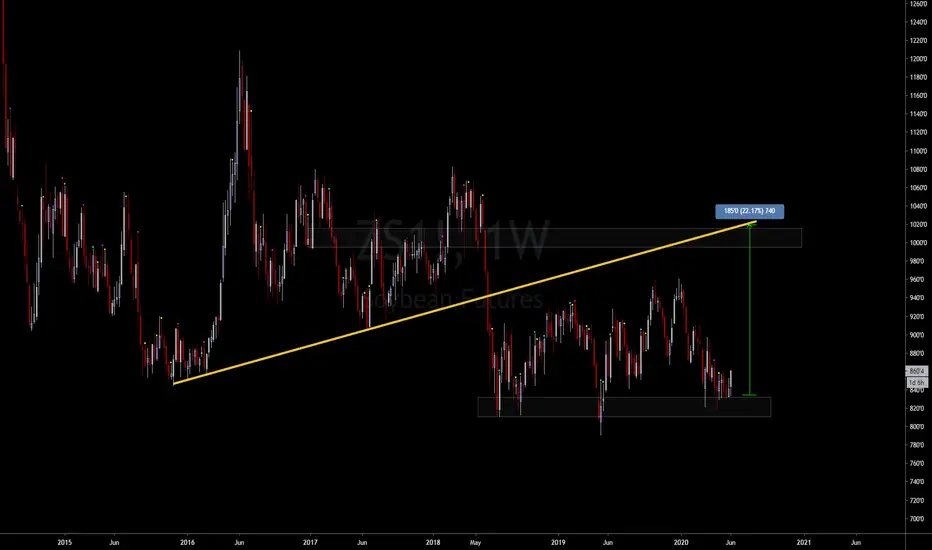
22% gains SoyBeansClear over under pattern on the Weekly.
Weekly closing strong-bullish in 1day+
Look to buy after weekly candle close with a Target of the supply overhead.
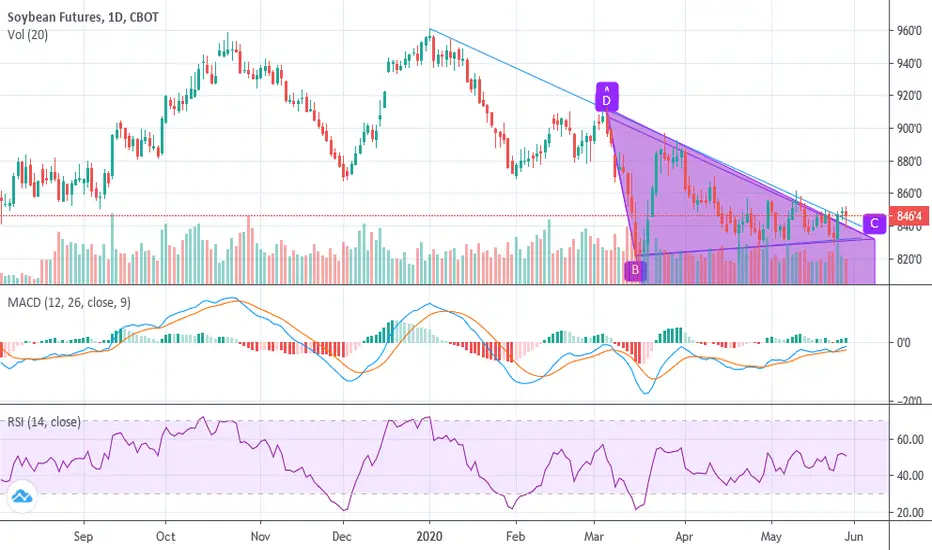
Long position on soybeansSoybeans had broke descending triangel wiht double bottom. Time to long position?

ZS1!Took profits at low end of RR. Could like for counter trend bounce here, but since bearish trend, no play for me.
Feel free/please comment!

Soybean futures looking like accumulation.Soybeans look like a solid R:R long right here. Even reaching the top of the accumulation, at $12.5 a point (for the micros, $12.5 a tick for full size Soybeans), looks like a good bet to me.
Why Your Stop-Loss Gets Hit, Even Though Your Bias Is CorrectSmall intro into Smart Money Concept
If this helped you in any way then make sure to LIKE and leave some feedback!
