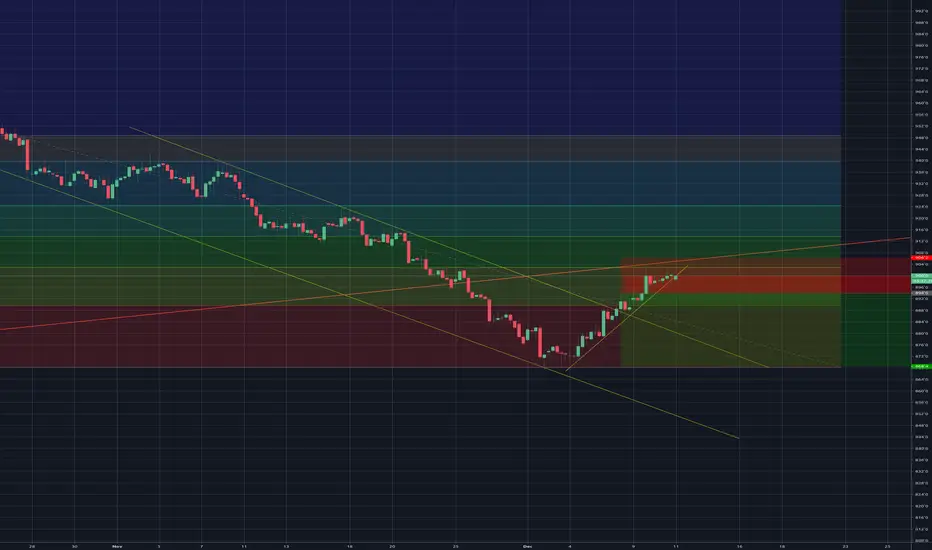
Elliott Wave View: Soybean Impulsive Rally Favors UpsideSoybean (ZS_F) cycle from May 13, 2019 low shows an incomplete 5 swing sequence, favoring further upside to end 7 swing double zigzag structure. On the 4 hour chart below, wave (X) ended at 867.4. Wave (Y) higher is unfolding as a zigzag Elliott Wave structure where wave A of (Y) remains in progress. The internal subdivision of wave A is unfolding as an impulsive structure. Up from 867.4, wave ((i)) ended at 903.4 and pullback in wave ((ii)) ended at 888.2.
The instrument has resumed higher in wave ((iii)) towards 950.4 and pullback in wave ((iv)) ended at 938.4. Expect wave ((v)) of A to end soon. Afterwards, Soybean should correct the cycle from December 3, 2019 low within wave B before the rally resumes. We don’t like selling the proposed pullback and expect buyers to appear in the sequence of 3, 7, 11 swing for more upside as far as pivot at 867.4 low stays intact. Potential target higher is 100% – 123.6% Fibonacci extension from May 13, 2019 low which comes at 1021 – 1057 area.
MZS1! trade ideas

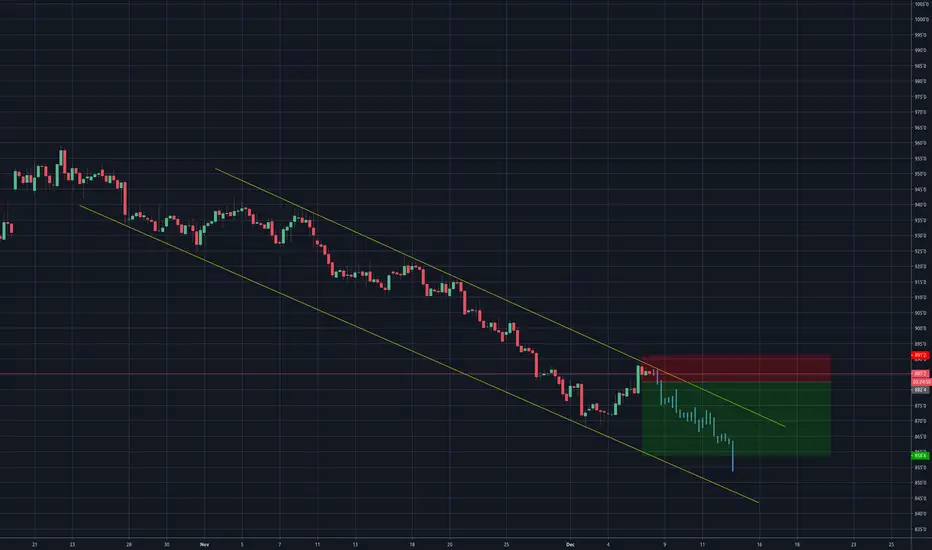
Soybean Short - Corrective wave confluenceLooking for a possible short on Soybeans down to an area of support and confluence of the channel downward channel. at 882. We are currently hitting year long ascending trendline bottom that we broke and have yet to retest, as well as the 38.2% fib entrancement level of the larger move. Price has seemed to lose momentum at this level. looking to price action for confirmation that a move to the downside is probable. This could break through that year long trendline and we could be looking for a move to test highs at 940, if not looking for TP at 2 levels, 882 and 855
Soybeans - Short | Bearish trendSoybeans has been getting pummeled the past month with aggressive selling. the past few days, soybeans has experienced a final breather and has been in a smaller corrective wave. Currently at the top of the channel after this wave, looking to see if the channel holds, otherwise looking for a breakout and retest of the channel to the long side. If price holds at top of channel and a confirms price will move back down, looking to 860 855 level as that is a strong support level.
High time to sell soybean This chart is beautiful as it presents a great selling opportunity.
Now the profit target (red dotted line) is also the 618 FIB level so if it reaches there
,expect some pullback as well. It could also retrace a little and continue to dive
southwards to meet the gap to be closed.
However, if the price action does reverse and pullback aggressively back into the bullish trend line, then this selling order is cancelled.
Be flexible, be like water.

Short ZS soybean Entry on a 30min time frame but price just had an exhaustion gap into a weekly downward trendline.
Short ZS - Soybean

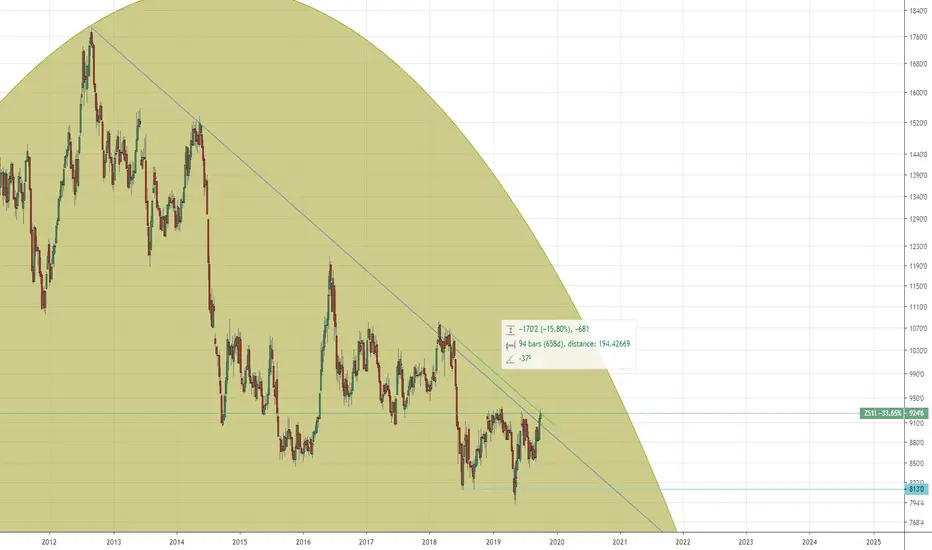
a punto de salir...... LONGLa soja esta a punto de quebrar la linea de tendencia bajista que se origino cuando fue su maximo historico en 2008, podremos empezar a ver unos 1000 pts como idea basica.
Soybeans SHORT mean reversion to 865Nov Beans is back at the 38.2 Gann retrace from CTN High to Low, meeting resistance on the 2x1 Gann Lines (purple) from CTN all time High and 2nd CTN top. Move has been based on optimism from Chinese purchases of US Soybeans as a goodwill gesture to prep for October meetings. A move to the 1x1 Gann Line (dotted) is anticipated as we drift toward October seasonal lows before talks transpire. The 5yr 50 MA price channel via Spreadcharts shows Beans extended to the 5 year SD2 MA @9.00. Expecting a move toward the 1x1 lines (8.65) median line which is also the SD mean of the 5 yr MA of price given no new developments in Chinese US relations till October talks, and typical of mean reversion of price and seasonal trend.
Sold Vertial Call Spread Short Call 910 39d exp Long Call 920 39 day exp
Sold ZSX19 @ 8.99 Stop 913, TP 8.64
Gann fan scales
1) Michael Jenkins Initial Impulse 1x8 line aligned to high 2
2) 2x1 aligned to lowest low of new swings retracements (authors method)

Using Gann Fans/Retracements with Impulse/Retrace Scaling Part 2Finished analysis of 2014 Nov Beans using price scaled Gann fans.

Using Gann Fans/Retracements with Impulse/Retrace Scaling Part 1How to setup simple price scaled Gann fans to determine support and resistance out in time. Gann's geometrical method advanced by scales derived from highs and lows in the wave formation to forecast future price expansion and SR zones.

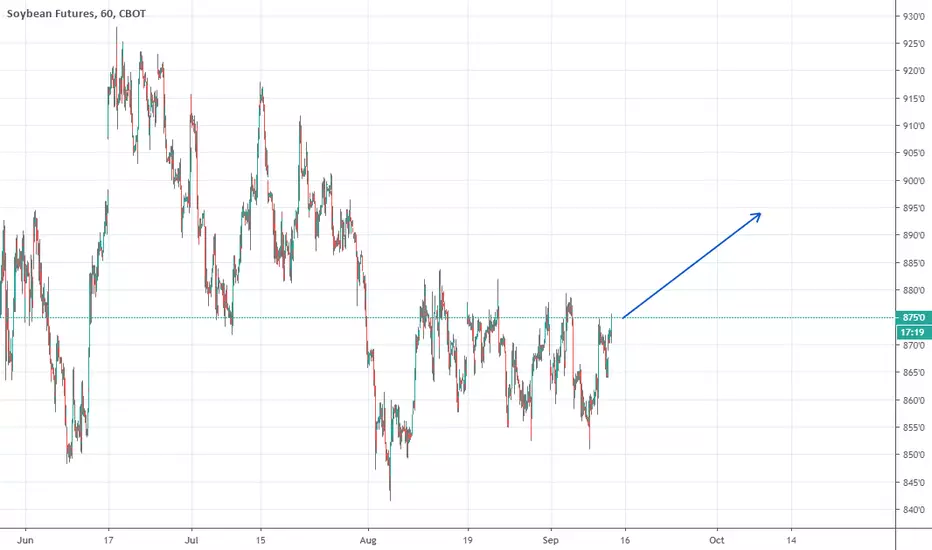
Soybean#Soybean H1 Buy
ID : 1-04
At : 874.7
SL : 868.6 - Risk 61 pip
TP : 894.0 - Reward 193 pip
Date : 2019/09/12

Soybeans itching to climb, resume the UpBollinger tightness, appropriate deep pullback, oats a harbinger signalling a go, WASDE report tomorrow, frost worries... Take your pick, maybe even a trade war truce?


bulls loosing faith in trade deal as selling pressure mountsbulls loosing faith in trade deal as selling pressure mounts
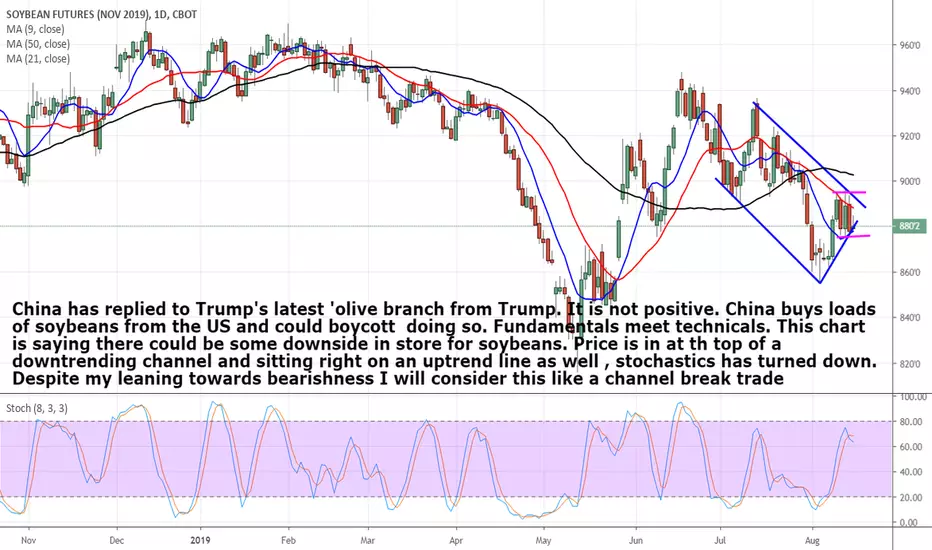
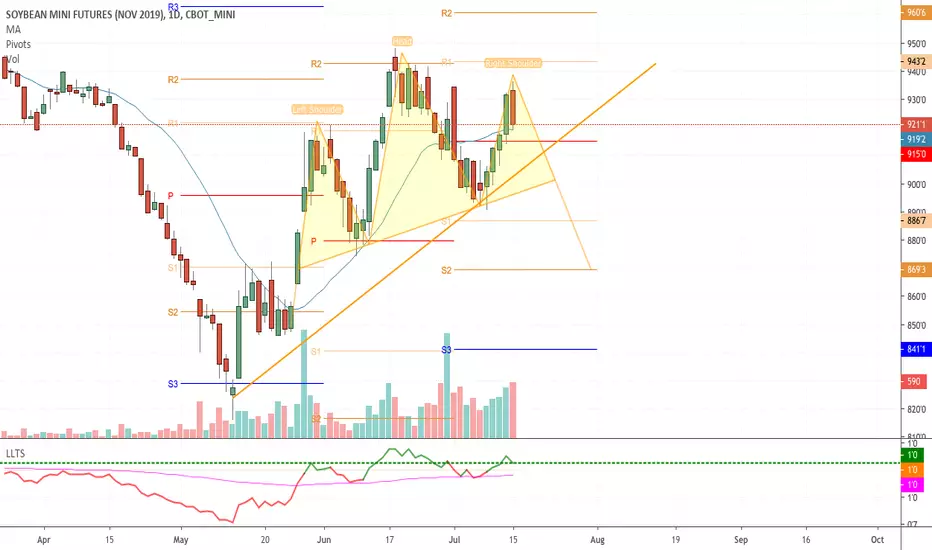
November Soybeans Head and ShouldersSoybeans could now be on its final shoulder the H&S For November needs to break upward trend for significant action. If it rebounds off uptrend then continued move higher is likely.

Soybean Futures Buy Set Up Wave AnalysisLook for a Bullish wave to the upside, in either a wave 5 or wave c

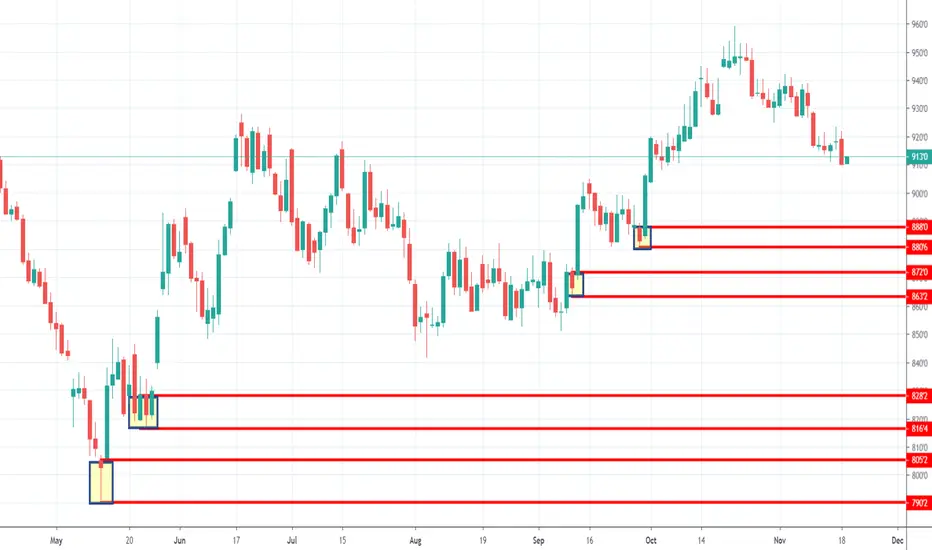
Are Soybeans Poised For a Run?Soybeans seem to defy all odds when it comes to rational and can often take things to the extreme, one side or another. This is very sweet when you are on the profitable side of this rational but equally as bitter when you are not.
During the beginning of May, I had a suspicion the market was very oversold and was due for a correction to the upside, but it seemed like the upside move would never come as the market continued to punish them. Finally, on 5/14 they came to life and gave me a good buy signal by busting the downward line of resistance. I estimated there was a 98% chance of a low and now had a move up to jump in on. It did prove to be a great one.
After clearing through $9.20 I foresee resistance around the $9.65. I believe the market will float around in between these two levels until 7/1. This will be after the Acreage report by the USDA which, many in the trade are anticipating will have fewer planted acres of soybeans than originally anticipated back in March. Also, the upward support line will start to squeeze the market into the $9.65 resistance level, I believe if the market does not move up through $9.65 prior to then it will have good technical reasons to then.
I am a bull on soybeans but will not add to my position now unless we retest the lows of $9.20. or break through $9.65.
In other words, I am sitting on my hands and remaining patient.
**Educational purposes only**

SoyBean Futures - Short IdeaI only started watching Soybeans because of poor fundamental news. Bumper crops, tariff issues. etc. (I don't trade futures often) I noticed an incredible run up...seeing a shooting star develop on the daily PLUS price is at significant levels, pivots, ema's etc. I am taking the short at the 61.8% Fib level. Lets see how this trade rolls out. 1% Risk, 2:1RR - Happy Trading!

