ZSX2021 November21 SoybeansNovember21 Soybeans: Thursday’s low at 12.40 fell short of the primary target at 12.30. If 12.40 is confirmed as a swing low, I will look at upside targets more closely. Risk below still remains between 12.30 and 12.22. Look for resistance above against any of the lines drawn. If the 12.40 low holds, nearby resistance at 13.32, 13.60 and 13.88
MZS1! trade ideas
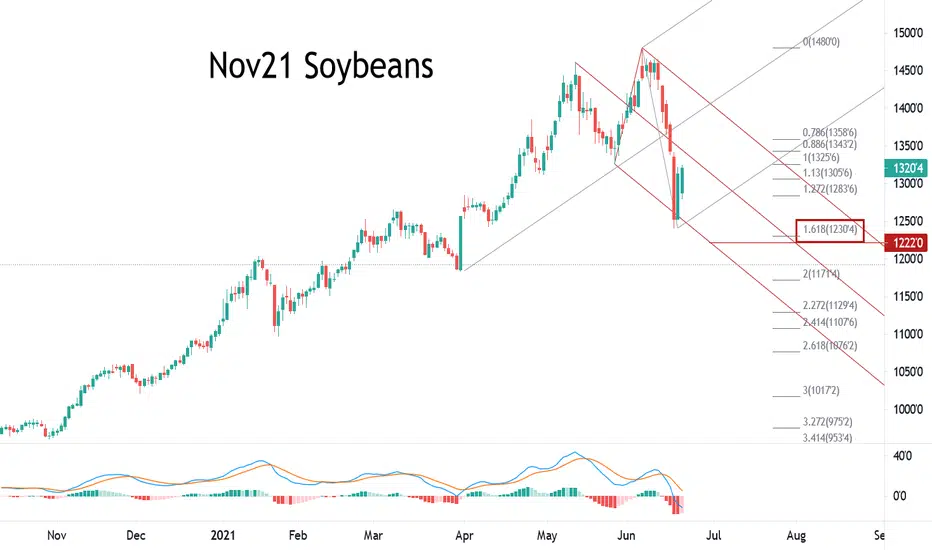
ZSN2021 July21 SoybeansJuly Soybeans – Weekly: Last week’s big ugly red bar was the first weekly close below the blue Tenkan and the red Kijun line since August of 2020. Support is last week’s low at 13.23.
Resistance is the red Kijun and 38% retracement at 14.55 and the blue Tenkan and 50% retracement at 14.95

Soyboy FuturesThe amount of Soyboys in this space is an inverse function of hyperinflation. the more soy we need = the more Soyboys you will have to put up with in your local dystopia dispensary.
in otherwords:
Have you seen the wycoff accumulation on Soy boys? this is looking like accumultion and it is being rejected at a critical zone (historically and current msm narrative speaking as well); all on the cusp and heels of G7 and inflationary fears from the dollar.
but dw fedday makes anything right as rain.
look at Gold, silver, and most other commodites.
the dollar is a dying asset and this sign of strength is your red flag.

Beans in the teens!If you look back to the lows of '06 to the highs of '08 ( $5 to almost $16) to the all time highs in 2012 of almost $18 you will see that 6 months in to this raging bean rally there is till time to get on board and enjoy the ride higher. Although I have traded in / out of the market for months, I would have been better served to have gotten long and stayed that way - period. There's room to run for many technical and fundamental reasons as well. I encourage a healthy debate, in the comment section. Thanks and good luck to both sides of the trade. That's what makes a market.

New Crop Beans Probe Below the Teens - Did Lumber Give the Clue?Last week, the commodities sector experienced more than a speed bump after an extended period of price appreciation. As July soybeans roll to the next active month and the new crop November contract in the futures market, the price became a falling knife before recovering on Friday, June 18.
Beans tank
They were not the only commodities
A Fed hint made its transitory wish come true
Lumber continues to give clues as it moves first
The legacy of COVID-19 will live on- Bull market dips can be brutal
July beans have been in the teens for most of 2021. New crop November beans rose into the teens in April and remained there until mid-June when they briefly fell below $13 per bushel.
While the weather across the critical growing regions is the primary factor driving the price of the oilseed futures, all commodity prices fell last week. Ironically, lumber has been signaling a correction was on the horizon since mid-May. The illiquid lumber market has a habit of leading commodity prices, making it a crucial sentiment benchmark. I never trade lumber because of its limited liquidity, but I watch the price action like a hawk.
Beans tank
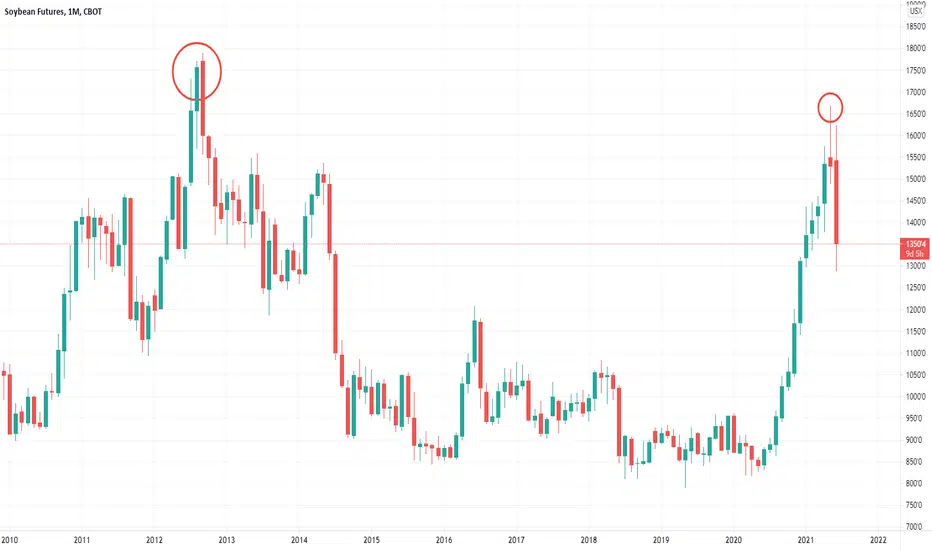
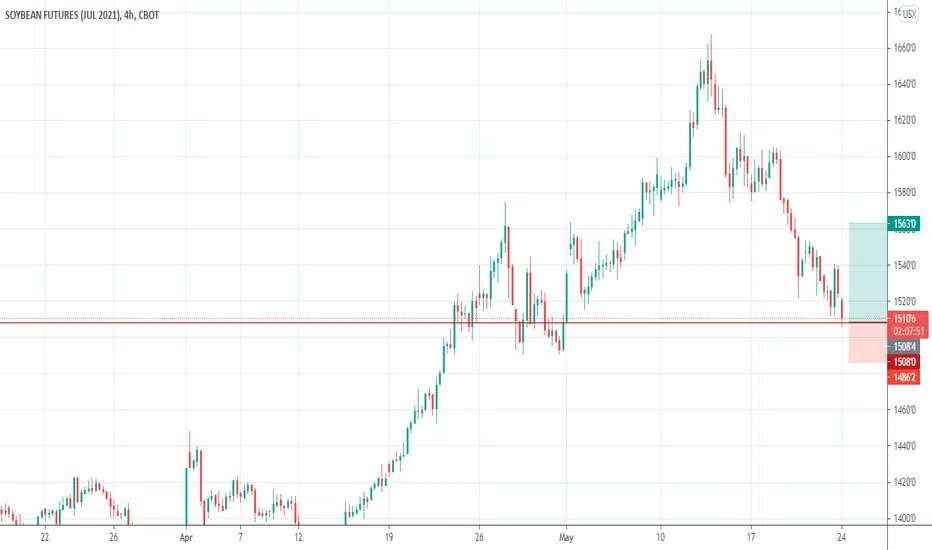
Nearby CBOT soybean futures reached a high of $16.6750 in May 2021.
The chart shows the rise to the highest price since September 2012 when soybean futures reached a record $17.8900 peak. Chinese demand, the weather conditions and COVID-19 in South America, and falling global inventories pushed the price to the high last month. Nearby soybean prices have been mainly in the teens throughout 2021, only dipping to a low of $12.98 in January.
The recent selling took the price down to a low of $13.2350 per bushel last week before it covered to around the $14 level. New-crop November soybeans have been trading in backwardation to the nearby July contract. Backwardation is a condition where nearby prices are higher than deferred prices. Backwardation is a sign of tight supplies or a market deficit.
The market has remained optimistic that the 2021 crop year will produce enough oilseeds to meet the growing global demand.
The chart of soybeans for delivery in July 2021 minus November 2021 shows the backwardation narrowed from a high of $2.29 per bushel in January to the 82.25 cents level at the end of last week. However, at 82.25 cents, the July beans continue to command a hefty premium to the new crop November beans.
The chart shows that the November futures contract entered the teens, with the price rising above $13 per bushel in late April and remained there until last week when it probed under the level. However, the November contract recovered, and new crop beans were still in the teens as of June 18. At $13.15, soybeans for November delivery corrected by over 11% from the June 7 high at $14.80 per bushel.
They were not the only commodities
Soybeans were not the only commodities to experience selling over the past weeks. Corn and wheat prices decline. Copper, a leading metal, fell from a record high at nearly $4.90 per pound in May to settle below $4.16 last week, a 15% decline. Palladium reached an all-time high of $3019 per ounce in May and was trading around the $2470 level on June 18, over 18% lower. Metals, industrial, and agricultural commodities fell sharply last week.
The only markets that remained near the recent highs were crude oil and natural gas. The strength in the energy sector is likely a function of the shift in US energy policy, causing tighter regulations on drilling and fracking at a time when demand is booming in the wake of the global pandemic.
A Fed hint made its transitory wish come true
The selloff in commodities began before the June 10 Fed meeting but selling accelerated in its aftermath. The Fed did not change monetary policy. The only concrete change was a slight five basis point increase in the reverse repo rate. However, the central bank shifted its rhetoric from “not thinking about thinking about” rate hikes or tapering QE. The FOMC members decided it was an excellent time to begin thinking. The May CPI data that shows inflation rising by 5% and the 3.8% rise in core inflation, excluding food and energy, was enough for the central bank to hint that rates could head higher and QE could begin to taper in 2022. The prospects of a less accommodative Fed caused a cascade of selling in markets across all asset classes.
On Friday, June 18, hawkish comments by Fed Governor James Bullard caused selling in the stock market. While the Fed continues to characterize rising inflationary pressures as “transitory,” the more hawkish comments and forecasts may have made its characterization comes true, at least in the short term. The correction in commodity prices will likely cause a decline in inflation data over the coming months if prices continue to fall or sit around the current levels.
Lumber continues to give clues as it moves first
The illiquid lumber futures market provides the commodity market with clues over the past months on the up and the downside. Before 2018, the lumber price never traded above $493.50 per 1,000 board feet, the 1993 high.
The annual chart dating back to 1972 shows the explosive move in lumber that took the price to a high of $659 in 2018, $1000 in 2020, and $1711.20 in 2021.
The weekly chart shows lumber futures rose above the 2020 high in mid-February 2021, months before other commodity prices reached record or even multi-year highs. Lumber peaked at $1711.20 during the week of May 10 and became a falling knife. The turn came before other commodity prices corrected dramatically in June.
Lumber may be an illiquid market that does not offer trading or investment opportunities, but it has been an impressive barometer for the future path of least resistance for raw material prices. I never trade lumber, but I watch the price action in the wood market like a hawk.
Last week, nearby lumber futures fell to a low of $855.10 per 1,000 board feet and settled below the $900 level on June 18. Lumber has nearly halved in price from the early May high, just six short weeks ago. Put lumber on your radar as a critical indicator of commodity market sentiment. Over the past year, lumber rallies have been a harbinger of bullish trends in the raw materials asset class. Falling lumber prices have signaled that corrections are on the horizon.
The legacy of COVID-19 will live on- Bull market dips can be brutal
Meanwhile, the correction in commodities was brutal last week, but the asset class remains in a bullish trend since the March and April 2020 lows. Even the most aggressive bull markets rarely move in straight lines. The higher prices move, the odds of brutal corrective periods rise. The cure for high prices in commodities is those high prices as producers increase output, and demand tends to decline when raw materials become too expensive for consumers.
We are still in the early days of the post-pandemic era. The tidal wave of central bank liquidity and tsunami of government stimulus continue to overwhelm the financial system. The CPI data told us that inflation is a clear and present danger. Whether it is “transitory” is a question that remains. Real estate prices are soaring; the stock market remains near its all-time high. Digital currency prices suffered severe corrections, but they remain far higher than 2020 levels. The US dollar may be bouncing against other world currencies, but that could be a mirage. Measuring the dollar’s value against other foreign exchange instruments provides an incomplete picture. If all fiat currencies are losing purchasing power, the dollar may only be the healthiest horse in the foreign exchange glue factory.
Inflationary pressures will not go away overnight. Even if the Fed begins increasing the short-term Fed Funds rate and tapers QE, the liquidity in the financial system remains at unprecedented levels. Government spending is not likely to decline under the current administration in Washington, DC.
The impact of liquidity and stimulus in 2008 drove commodity prices higher until 2011-2012. The levels in 2020 and 2021 are far higher than in 2008. As I recently wrote, Albert Einstein defined insanity as doing the same thing repeatedly and expecting a different result. Professor Einstein would likely be a buyer of commodities on the current price dip as we are still in the early days of the bullish cycle if the period from 2008-2012 is a model.
As vaccines create herd immunity to COVID-19, the virus will continue to fade into the market’s rearview mirror. However, the legacy will live on for years. I will be watching lumber for clues. When the wood price hits bottom and turns, it could provide another hint that commodity prices will reach higher lows sooner rather than later.
When it comes to the soybean and other agricultural markets, rising inflation is bullish, but Mother Nature will dictate the path of least resistance for prices. The 2021 crop will be a function of the weather conditions across the fertile plains in the US and other growing regions in the northern hemisphere over the coming weeks. Commodities remain in bull markets, despite the recent selloff on the back of the Fed’s rhetoric. Any significant shift in monetary policy remains months away. A rising dollar and higher interest rates could cause lots of turmoil in markets across all asset classes, but the damage from the liquidity and stimulus that stabilized the economy and financial system will last for years to come. I remain a commodity bull, despite the recent selloffs and view them as buying opportunities.
Picking bottoms in markets is a fool’s game, so we trade with the trends. However, the odds and fundamentals favor higher lows in the inflation-sensitive asset class.
Sign up for the free Monday Night Strategy Call using the link below!
Trading advice given in this communication, if any, is based on information taken from trades and statistical services and other sources that we believe are reliable. The author does not guarantee that such information is accurate or complete and it should not be relied upon as such. Trading advice reflects the author’s good faith judgment at a specific time and is subject to change without notice. There is no guarantee that the advice the author provides will result in profitable trades. There is risk of loss in all futures and options trading. Any investment involves substantial risks, including, but not limited to, pricing volatility , inadequate liquidity, and the potential complete loss of principal. This article does not in any way constitute an offer or solicitation of an offer to buy or sell any investment, security, or commodity discussed herein, or any security in any jurisdiction in which such an offer would be unlawful under the securities laws of such jurisdiction.
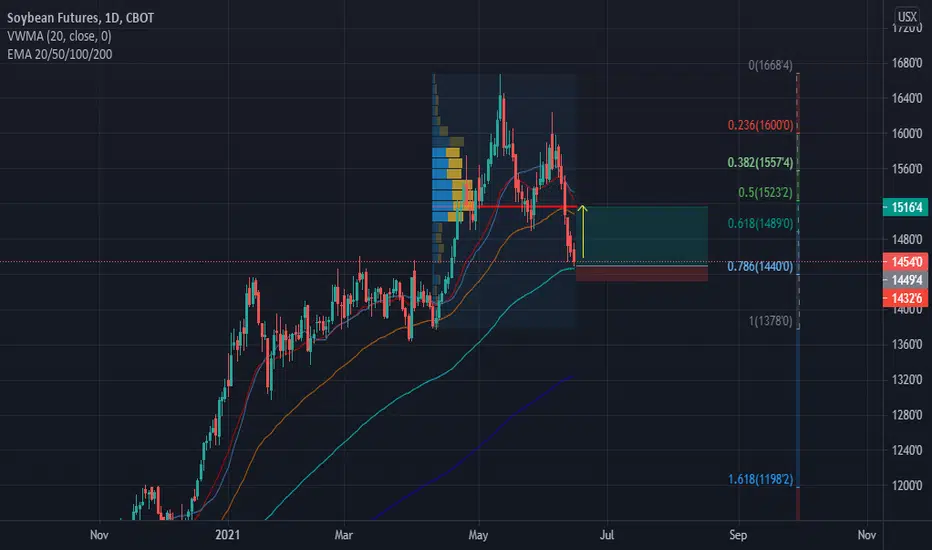
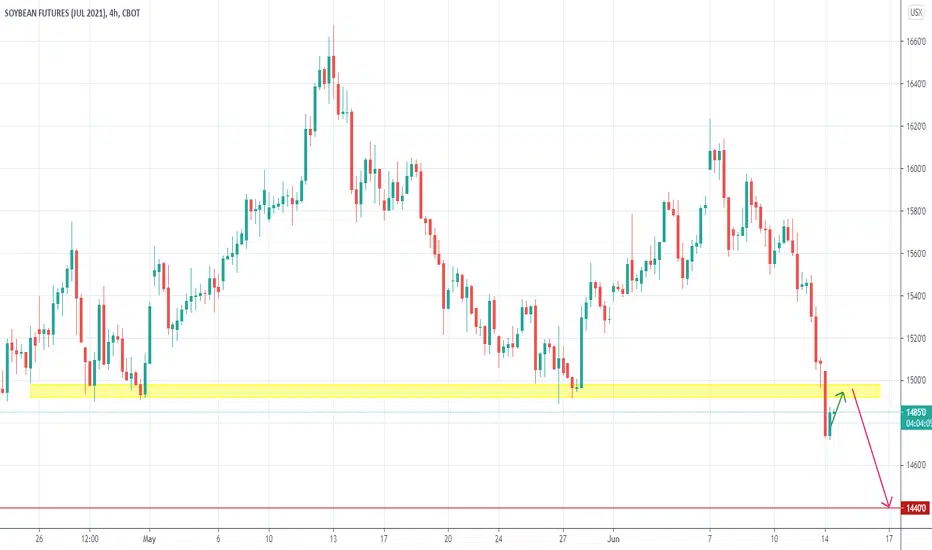
Week 24: ZSN2021 A short consolidation prior going down againLast week the seller fought back with momentum, it broke the support level $15.00 and going down further.
Normally after a series of drop in price, we will wait until the price normalizes (this is where "short" trader will take profit by buying back).
From the current price movement, we can wait and ready to short again at $15.00 area and our target to take profit is at $14.40.
Week 23: ZSN2021 Be ready to short at $1585Last week price broke the channel and continuing upward consolidation.
Yesterday we saw an aggressive move by the Seller, however, it doesn't mean that the price will plunge straight-away.
However, feel free if you want to short it now; in my view, the best level to short is at $1585 level/area. That's where your RR is more favourable.
So here is the signal for our discussion:
Pending Short Order at $1585
Stop Loss at $1616
Take Profit at $1530
RRR = 1.56R
Good luck!
Week 22: ZSN2021 Consolidation periodThis week we are anticipating the price to range in a downtrend channel.
If the price breaks the channel (upward), then the immediate target is at $1600 level.
However, if the price continues ranging in the channel; let it springs up to $1540 area, then we can short it (Higher probability it will break the support level).
For now, just wait and see.
PS: If you are still holding your BUY/LONG position from last week, close it manually at $1545.

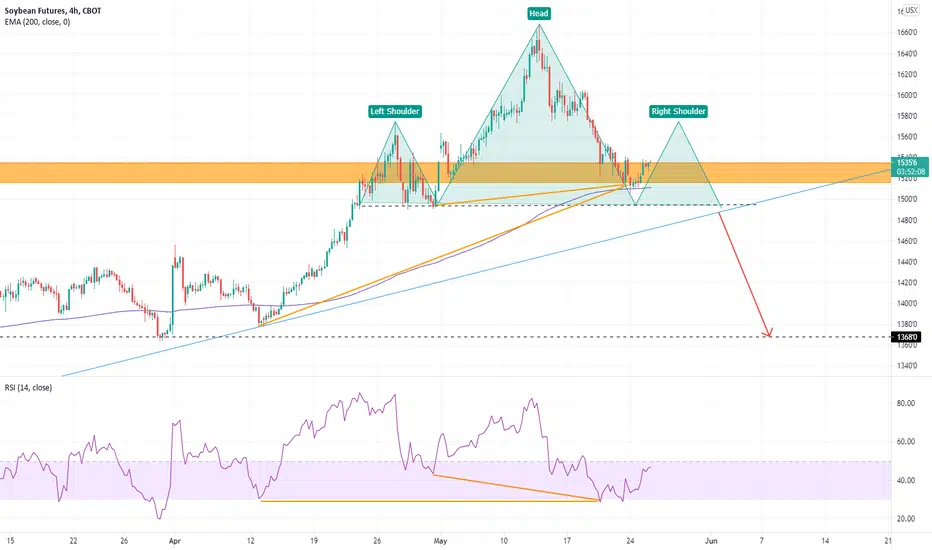
ANALYSIS OF US SOYBEANSBearish clues: LONG-TERM
- In weekly time unit, declining buying volumes during the uptrend initiated in July 2020
- Price has reached an important resistance zone around 1,530 cents per bushel ($15.30/bu, with 1 bushel of soybeans equal to almost 27 kg ).
- End of the uptrend and RSI < 50
- Fundamental analysis: increase in planted areas and yield in the United States of America => increase in the US production and stocks + increase in Chinese imports + increase in demand from crushers + increase in next campaign production in Argentina and Brasil
=> Possible reversal in US soybean prices
Bullish clues: SHORT-TERM
- Price rebound on the 200 exponential moving average
- Double hidden bullish divergences on the Relative Strength Index ( RSI ) initiated in April 2021
- Price closes outside Bollinger Bands + RSI oversold (< 30)
- Fundamental analysis: decrease in US exports and the US stock is still at a low level, even if it increases
The price of US soybeans could form a Head and Shoulders chartist pattern. If the price respects this chartist pattern, it could break the neckline and a daily bullish slanted support at the same time (coincidence of these two elements) and reach the level of 1,370 cents per bushel ($13.70/bu).
Feel free to share, comment and give your opinion if it is constructive ;)
DISCLAIMER: This is not investment advice
SoyBean Forecast!! /ZS /XKLooks like them beans are UP to something... They will make it there... Eventually ; )
Not Financial Advice. Trade Beans at your own risk.
Cheers,
-SKYLOBSTER

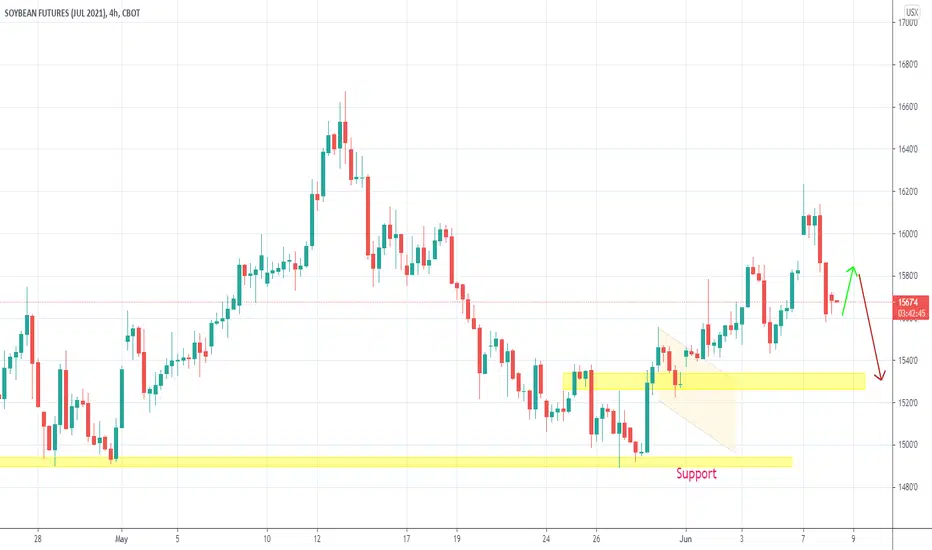
Week 21: ZSN2021 Let's flip it in the swap zoneOur trade last week was successful, it takes a week to finally hit our Profit Target.
Now the price is reaching the flip zone or demand zone; I would anticipate the price will have some rejection in this area.
This week we will LONG ZSN2021, here is my trade:
Buy now at market
SL is at $14.86
TP is at $15.45
RRR = 2.45R
Always move your SL when:
1. You see a higher low, and ...
2. Your position is in the profit area.
Hit me in the comment below for a discussion if you have any questions.


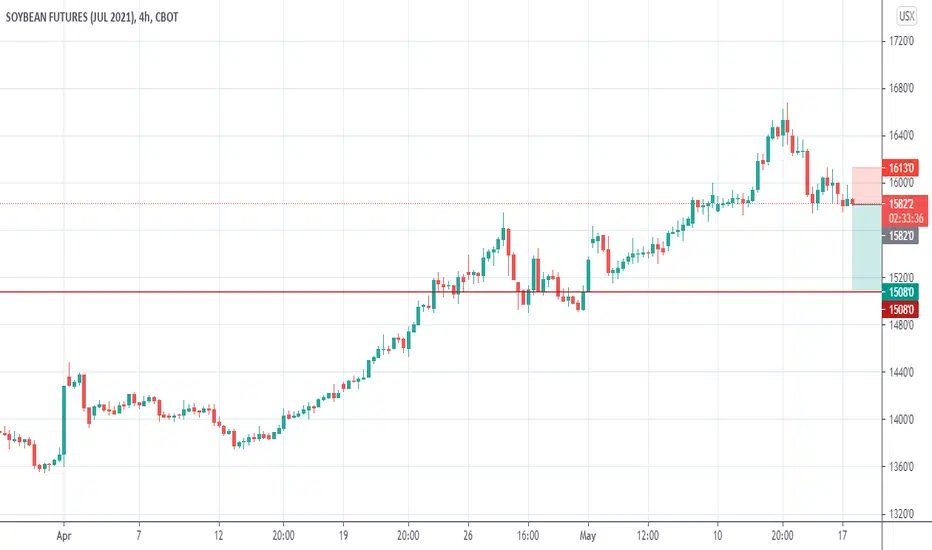
Week 20: ZSN2021 Sign of weakness and opportunity to shortThis morning during Asian market, volatility was low and structure wise, it is trending down to break the $15.82 support level.
I am on bearish bias and will place a spot short order:
Entry: $15.82
Stop Loss at $16.13
Take Profit at $15.08
RRR = 2.39R
It may not be a short drop, protect your profit when you are already in profit zone.
I will update again tomorrow if there is a change in outlook.
Soybean SHORTI have been waiting for the support to be broken. As you can see the 1H TRENDLINE will hopefully be in play when we retrace to the support that will now be resistance, I will be selling from there. (Look at my analysis for SL's and TP'S)

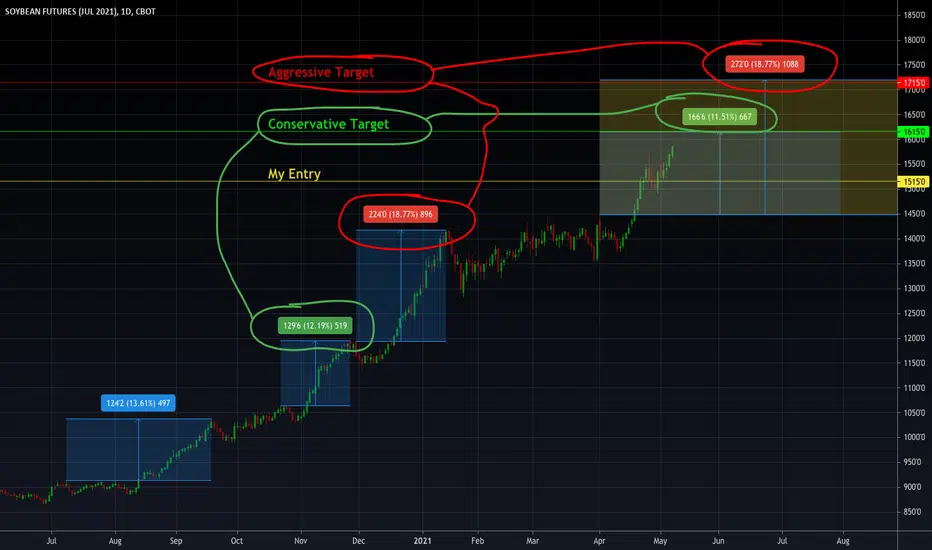
Looking at previous breakouts and resulting percentage gainsand coming up with conservative and aggressive price targets. Currently in long trade, considering when to take profits. I may close at the conservative or the agressive target depending on how aggressively the price action continues going up.
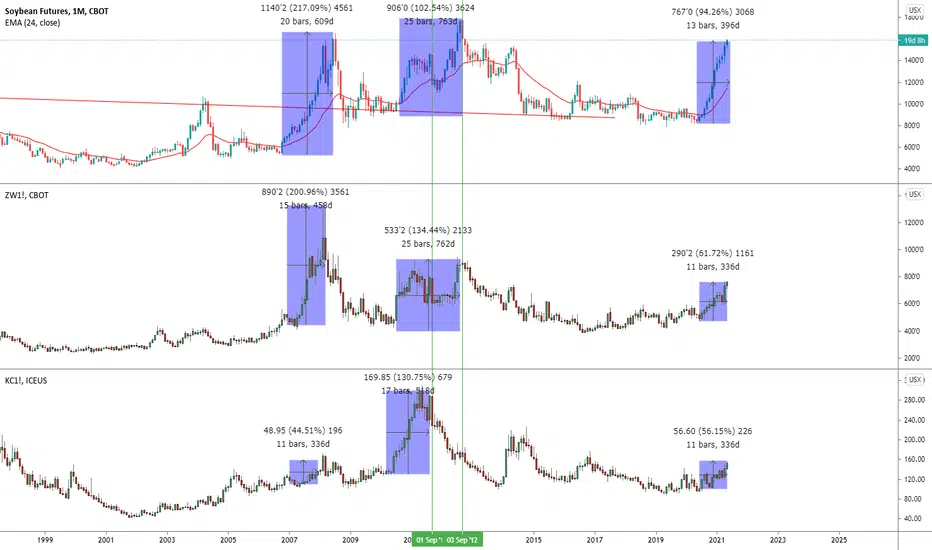
Soybean net non-commercial longs trending up, PT: 2000'As indicated by data from Commitments of Traders reporting, the net non-commercial long commitments are trending up and appear to have put in a new low at the trendline. This same scenario occurred in October of 2007 when soybeans were rallying toward the 15-year high, except now they're rallying towards the all-time high. The price increase that took place following the manifestation of this situation in 2007 would suggest that $20 per bushel or higher soybean prices in the foreseeable future are a very real possibility.

$ZS_F Soybean futures monthly RSI above 70.....Soybean futures monthly RSI is above 70 for only the 5th time in the last 33 years.

This is just the beginningCommodity prices are still going, several commodities have gone past all time highs, such as Palladium, Lumber, Steel...
And grains are also going up very strongly, Corn hit an 8 year high after 6 years of price stability, and they're all not far from ATH.
Corn imports have fallen as buyers are put off by the high prices (they are going against the trend, what if it never goes back down?).
Soybean demand should continue to increase, it is in high demand for the green transition (as a meat replacement, fuel additive or replacement, lubricant, etc).
And based on past years it seems farmers do not sell before summer (they plant in April-May).
This is now the 12th month in a row food prices have been going up.
History will show this was more than just some short term fluctuation or some economic recovery.
If we look at the past 10 years we might expect that soybean volatility is set to soar, every year as farmers plant their crops volatility increases by about 50%.
It fits with what you would expect after a range breakout, a trend that gets stronger and stronger ending parabolic (and bears screaming "this is ridiculous"), followed by a significant correction.
Corn has been the big runner and I think I will avoid it now, but wheat is interesting, after a long period of being choppy and lagging behind other grains, it has gone vertical finally!
If this keeps going I will look to go long wheat on a pullback.
Resistance (ATH) is far away:
The price stopped at the $15 psychological level, gathered reinforcements, and then continued up.
In many ways the situation is similar to 2007, but much crazier, with Rudolf Havenstein running the central bank.
We have seen this several times in the last year: After hesitating a bit around resistance, the price makes a new high giving confirmation to sidelines traders.
No reason to think this time is different, and as more people notice the trend it can be expected to get stronger.
We can look at previous vertical price rallies, and expect it to go at least to $18. It does not make sense to me that the rally would stop now.
It would be like a big truck running at full speed instantly stopping for no reason.
On the weekly chart clearly it does not have that much distance left to get to all time high, it's not far fetched at all, especially with all the other commodities that went well beyond ATH.
The trick is getting in on H4 to grab a fantastic risk to reward.
The main difficulty with these crazy vertical price moves is you can never enter and once you get in it reverse.
But with Soybeans... It is granting perfect pullbacks and breakouts, at least it has for the past 9 months.
And cherry on the cake, it could just fly past ATH, again. Who knows how far it can go? If this was the winter low volatility, what could the year peak volatility be? Up 25% in a week? Hey it's even possible it ends up in the news and retail goes insane and starts a bubble with dumb money arguments "new paradigm", "market of 7 billion eaters with the green transition", "we are very early" and so on.
The past centuries were full of all sorts of commodity bubbles, tulips that's the one everyone knows about, rabbits, silk, and others ones no one knows about but still have a few traces left in old books.

Week 19: ZSN2021 No Sellers in the market This week onwards we are using ZSN2021 chart.
In H4 charts we can see the rejection candle at $16.00 however there is no seller yet.
Prices are ranging in a tight range and the only sign for bearish if the price is closed at or below $15.60
For the time being, not much movement on Monday. We shall see the candle movement in the next few hours.

Coffee, Tea or me?Pictures show how the big inflation era really make the charts go,
As shown for Soybean, wheat and Coffee,
PPl should listen to FED closely bout how they gonna act,
3AM for the party,stay tuned
call a cab before drunk.
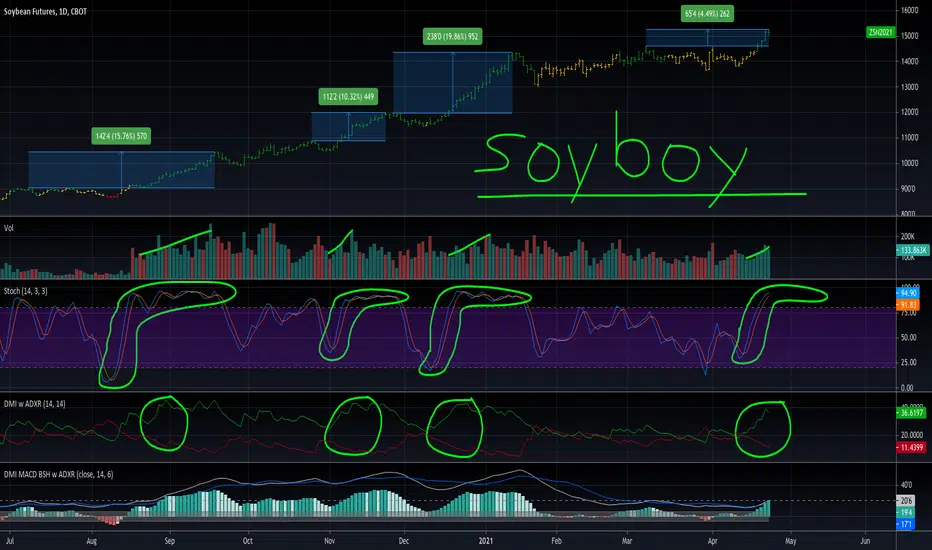
Don't Mind Me, I'm Just Confirming My Soyboy BiasThis recent breakout in soy has similarities to previous moves which have gained a lot more than this one currently has in terms of percentage gain and cents/bushel gain. These differences are noted on the top price chart.
Indicator Similarities:
Volume increasing after making a new high
Stochastic shooting up from below 50 without pause into overbought territory
Directional Movement Index achieving a large spread between +DM and -DM
The bottom indicator is a custom pine script indicator that shows the ADX (white), ADXR (blue), and the spread of the +DM and -DM in histogram format. The price chart colorization is based on this spread being above (green), inside (yellow), or below (red) the gray box which is a zone that makes sense from a historical-performance standpoint. One concern I have is that the ADXR level is low and ideally it would be above 20 which is the dotted line. The good news is that it is quickly rising and the first breakout from last August which is the most important one started with a similar setup.