Future wheat Long.My 1st look at Wheat future. What are the Fundamentals for Wheat prices? I see a nice technical support off of a Monthly support.
XW1! trade ideas

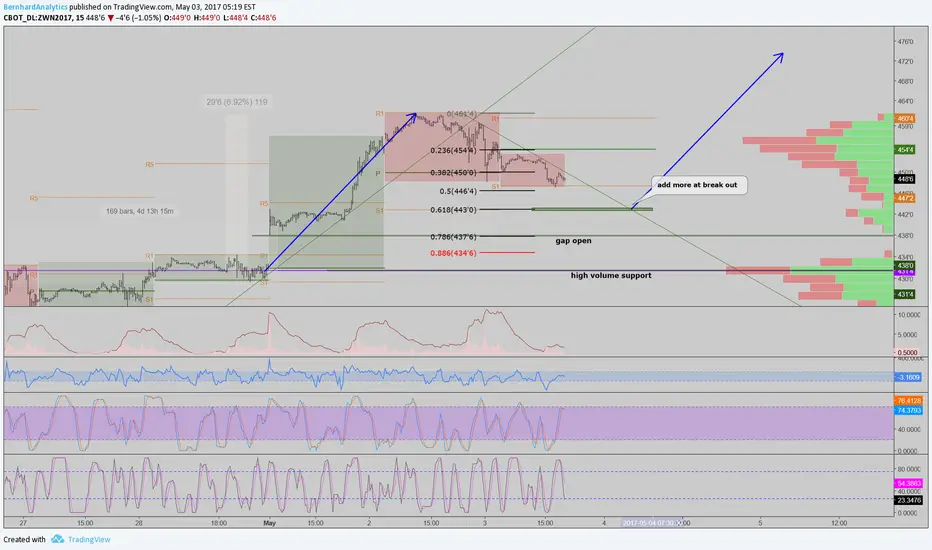
Break away gap, volatility release in wheatMinor supply above, entering strongest seasonal quarter $ZW_F
Long wheat!!Hello all
Let's take a look at wheat.
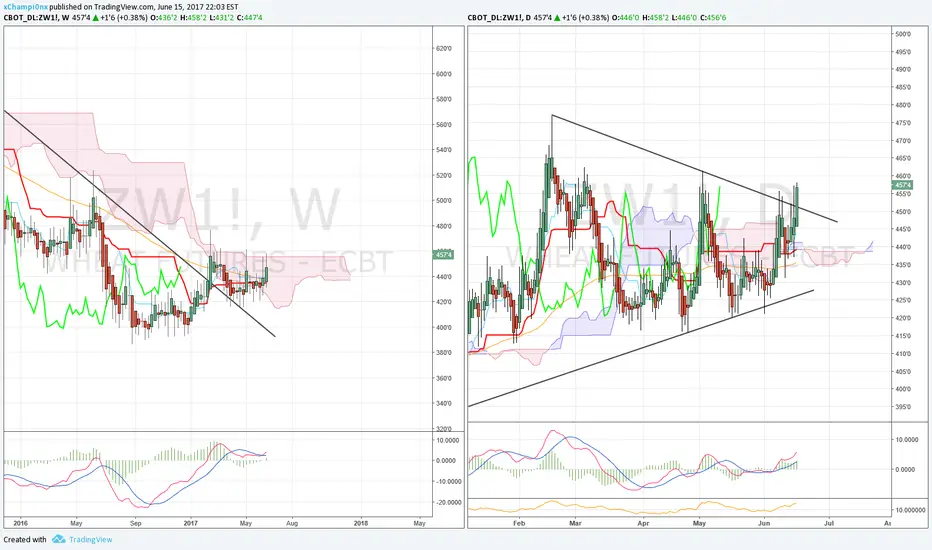
Weekly : Price broke LT trendline. Tested it and failed at kumo cloud top twice. This is third attempt and i expect a breakout. Weekly macd is above zero and crossed up.Chikou is above price and price above TK.
Daily: Price broke the triangle. Daily macd is above o and crossed up. Chikou is above price. Price above TK.
I am long and looking for a test of monthly kijun.
Big question is can this be starting of bigger multi year rally in corn and wheat?
Thanks
Short wheatNo signal but touched upper limit trend so good chance to go lower to the low limit around 400

ZW (Futures) - Short here Stop is 44 ticks above entry (This is max loss). Take profit is close below 444. Will update over any changes


Wheat Turn Around? Cypher?Wheat RSI has floored. Elliot wave 1-5 complete, and wheat is still trying to sell itself off of a bearish flag. There is an outside chance of this becoming a Shark. More likelihood a Bearish Cypher. If up trend forms, looking at 430'4 and then 444'2. After 452. This could also fall more into extension in which case target numbers may change.

Short PUT on ZW
Volatility has risen in the last days
Commercial Traders are going extremely long since a few weeks
no distribution in the last weeks

Wheat Still in DowntrendJuly Wheat has made a bullish flag and tried to escape it today. Wheat still in downtrend and market full of wheat right now, so still looking for further downside. Upside target reversal may come at 449 downtrend line if flag doesn't decay. If broken and stable we could see a short term turn around. RSI has come to downtrend line so caution should be taken.

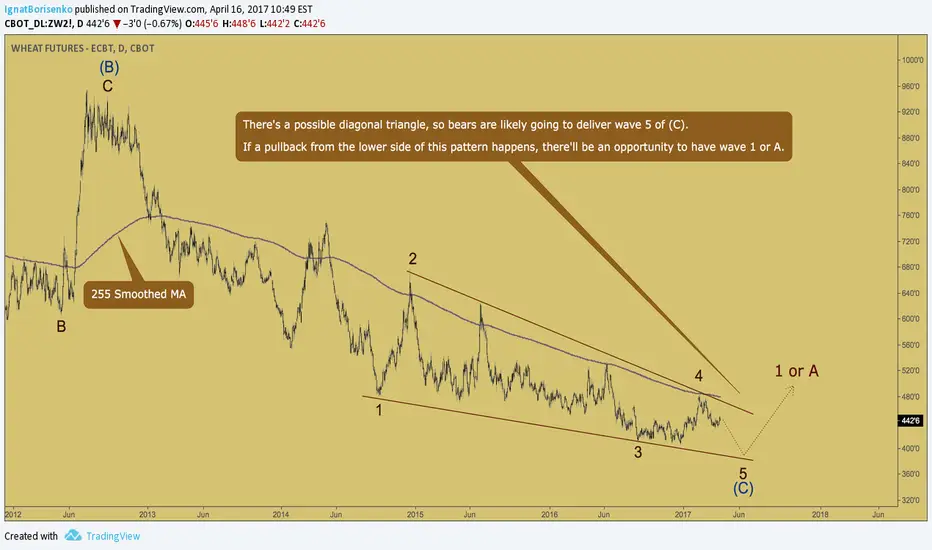
Wheat - diagonal triangleThere's a possible diagonal triangle, so bears are likely going to deliver wave 5 of (C)
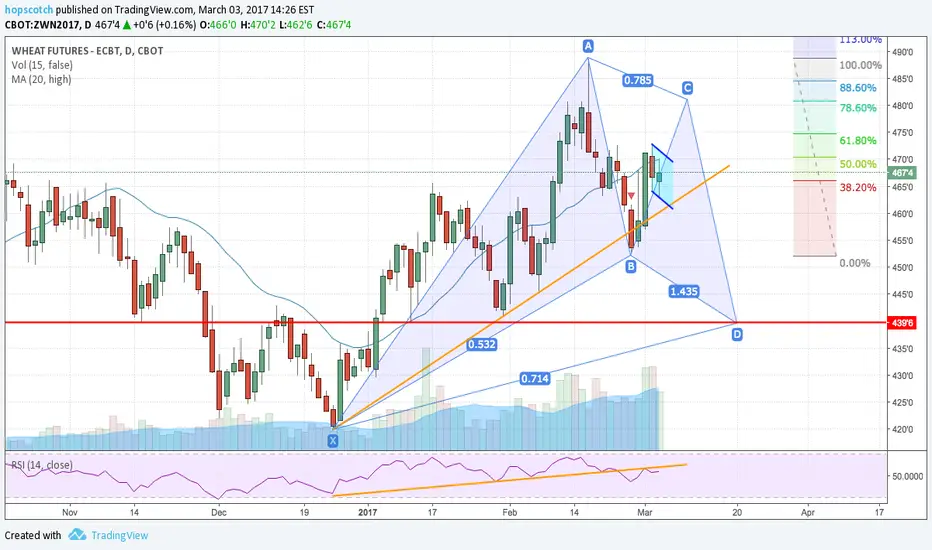
Wheat Bearish FlagJuly Wheat created a bearish flag today. Next downside target is 428 which would make a bullish Bat. If it goes through that and continues further we would be entering a bullish butterfly.

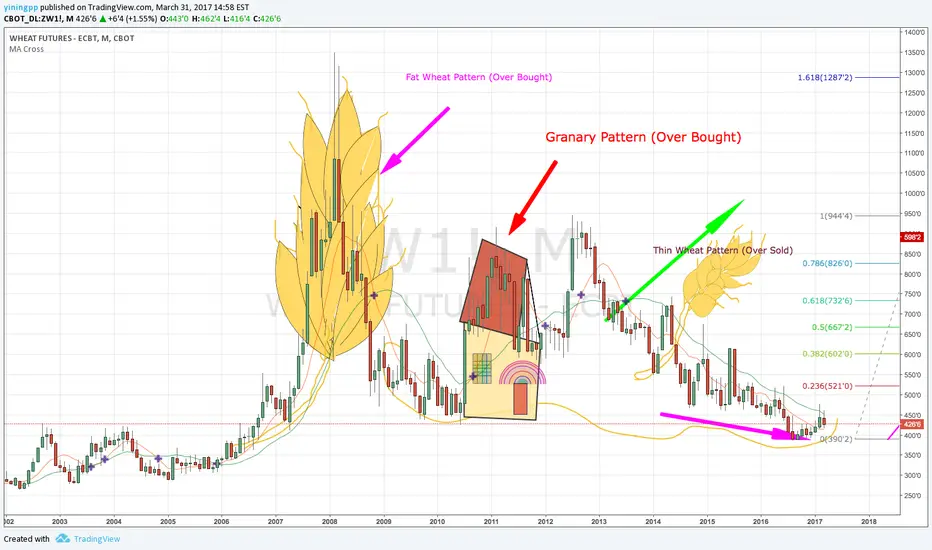
Super Bullish on Wheat Master Technical analysis - Lulu Capital
#Fat Wheat Pattern
#Thin Wheat Pattern
#Granary Pattern
#Target 600+
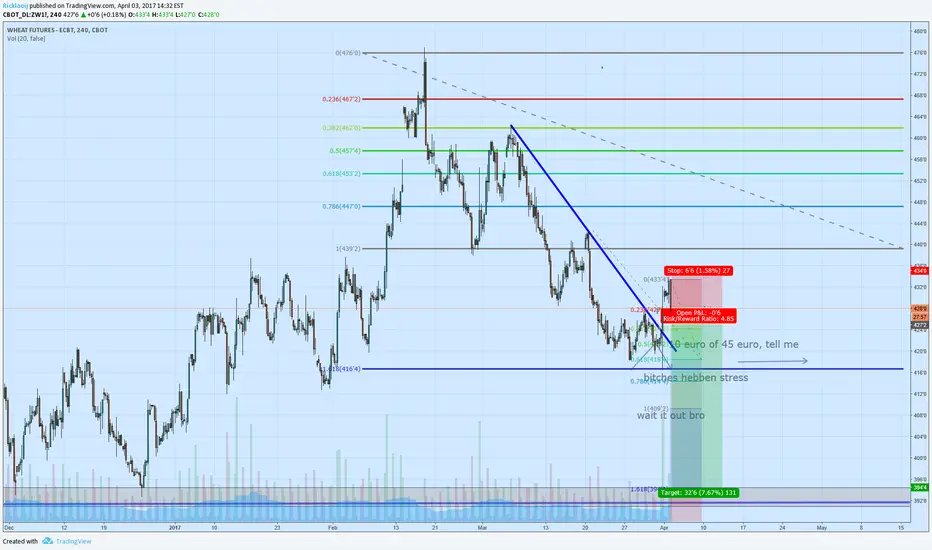
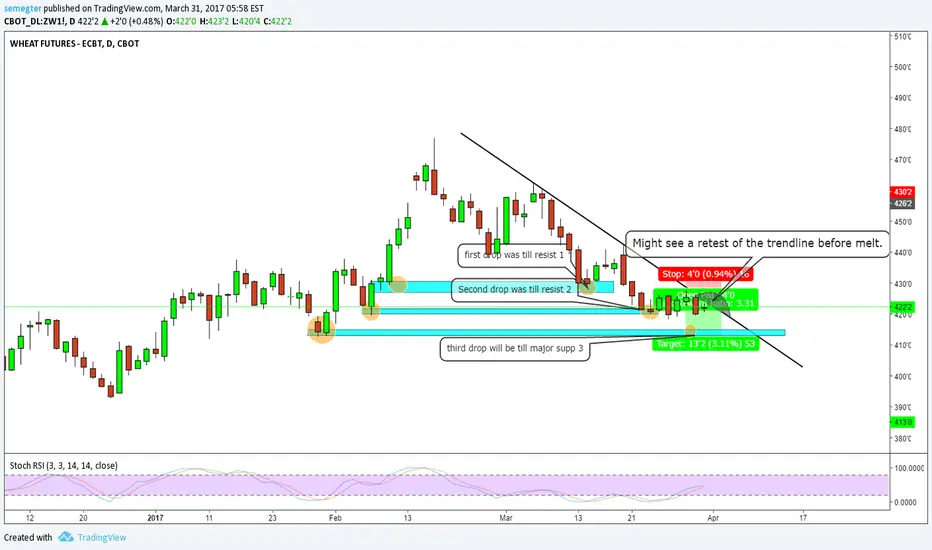
Wheat Position Swing Trade IdeaJust put this idea together. I don't have a long history in futures trading. Just an idea.
Wheat - Mar $4 Support?Bulled up... just a matter of weather* $4 support holds or we drop down to 3.5 levels
Trend line resistance erroded

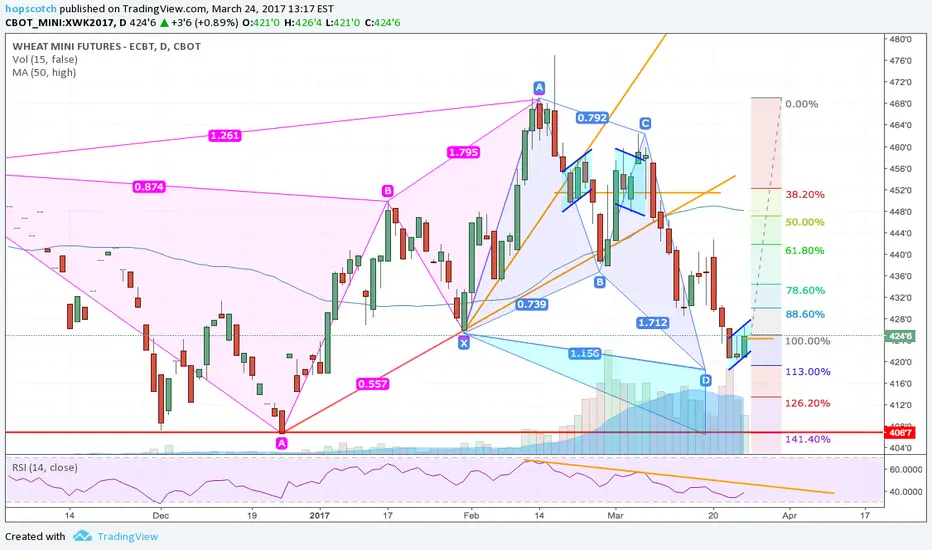
Wheat Bearish FlagMay Wheat is forming a bearish flag. Could fall into Cypher extension heading for a double bottom. Looking for confirmation of a start near centre of the flag downwards and continues downwards. RSI still trending downwards
Wheat - bullish opportunityIf we see a pullback from the lower side of this channel and the 144 Smoothed MA, bulls are going to deliver wave {v}

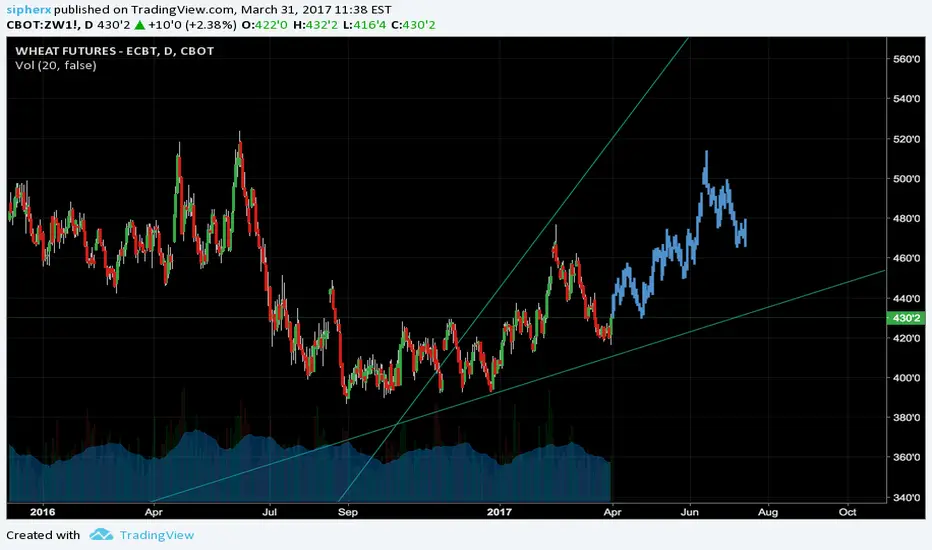
WHEAT close to a YUGE breakoutWheat is testing important long-term cloud and trend line resistance. A breakout above 470-480$ area could signal a very big move ahead. Minimum target will be close to 600$. Must be patient and wait for breakout.

Wheat Bullish FlagJune Wheat produced a bullish flag today. Upside target 475 area. Looking for Bullish Gartley completion at 480 and above. Long term target double top at 488
Positive, but not there yet!I just adjusted the weekly multi-year bearish trendline to candle peaks.
Indication is bullish (see EWO, MACD and haDelta), but the break has not yet happened.
If price dips in coming weeks, then we will have to look for buy signals in 435-445 range, otherwise just buy the break and close above 475.

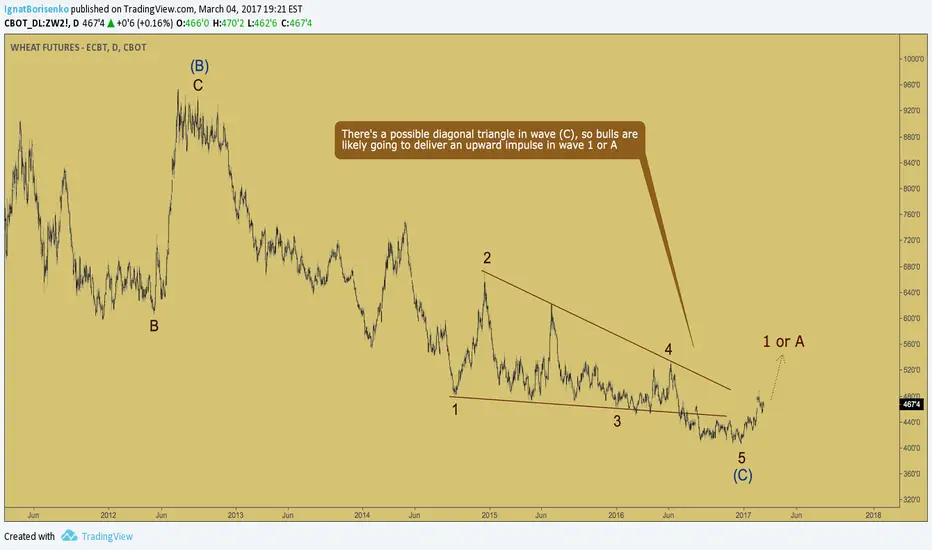
Wheat - diagonal triangleThere's a possible diagonal triangle in wave (C), so bulls are likely going to deliver an upward impulse in wave 1 or A