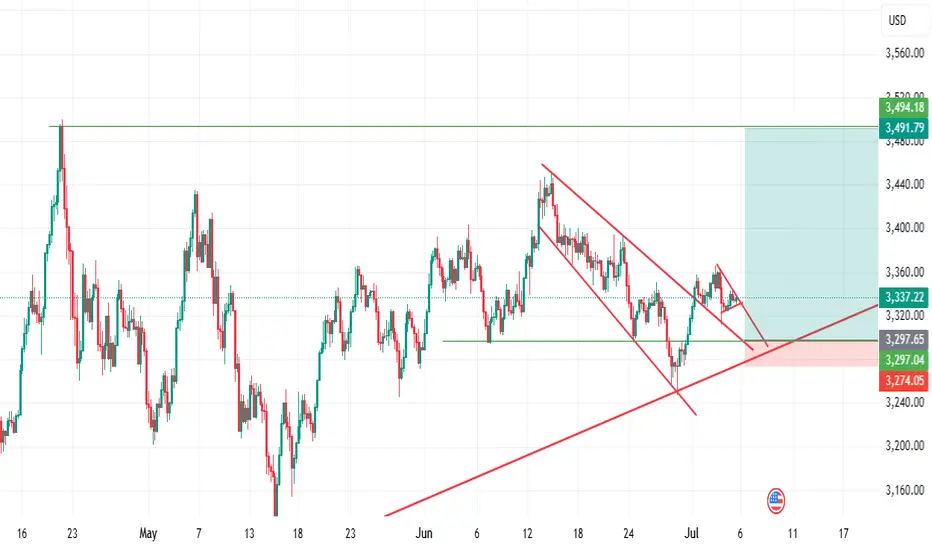
Gold (XAUUSD) Trade Setup – Valid Until July 10, 2025This 15-minute chart shows a clean technical breakout from a falling channel. Here's how to interpret and potentially trade this move:
🧠 Context: What Just Happened
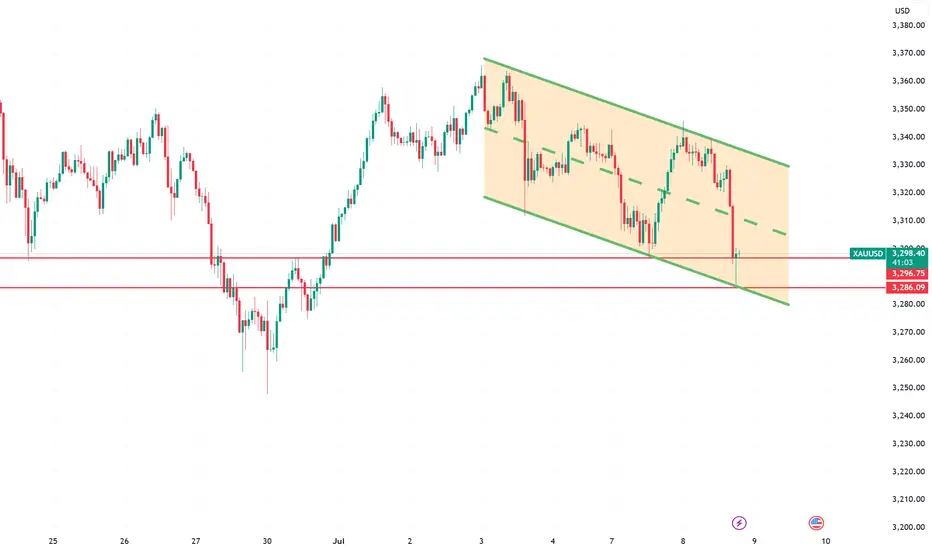
Price was locked inside a descending channel (blue) for multiple sessions.
A breakout occurred above the channel, indicating a potential short-term bullish reversal.
The bounce aligns with recent tariff-related headlines easing off and short-covering momentum building.
I trade these support and resistance lines daily on micro gold futures.
What these lines represent:
Golden Line: Heavy Support or Resistance depending on the price direction towards the lines for major reversal or $10-$15 swings.
Silver Lines: Consolidation areas or mid way support and resistance for a scalping few touches.
Bronze dotted lines: Low volume days support and resistance for a quick $5 up or down.
Also, I can see a directional setup. Here is a hypothetical scenario that could play out:
📌 Key Zones to Watch
🔼 Resistance $3,342 Next major target / sell zone
🟧 Resistance $3,319 Current breakout level retest
⚪ Support $3,307–$3,316 Minor consolidation area
🔻 Support $3,295–$3,289 Strong demand / invalidation
🚨 Bear Pivot $3,272 Break below = bearish return
🧭 Trading Playbook
Bullish Bias (Preferred Scenario)
✅ Break and hold above $3,319 = potential move to $3,342
🎯 Target: $3,340–$3,342
🔒 SL below: $3,307
Optional re-entry on retest of $3,316 zone
Bearish Reversal (If Bulls Fail)
⚠️ If price fails $3,319 and breaks back below $3,307, sellers may reclaim control
📉 Look for short setups toward $3,295 and even $3,272
SL above: $3,319
📌 Key Tip
Watch for volume confirmation and 5m candle closes at each level. Don’t chase — let price come to your levels.
⏳ Validity
This setup remains valid through July 10, or until $3,342 target is hit or $3,272 is broken.
This is not financial advice; it's for educational purposes only.
CFDGOLD trade ideas
Buy Gold! The short-term bottom may have appeared!Gold continued to retreat yesterday and hit a recent low, reaching around 3287. Then gold gradually rebounded to above 3300. Relatively speaking, the rebound momentum was weak. It is expected that the long and short sides will fight fiercely around 3300. However, from the recent characteristics of gold operation, it can be seen that although the short position of gold is strong, it is difficult to continue in the short term, and I think the short-term decline of gold is basically in place, so at this stage, in terms of short-term trading, I do not advocate shorting gold directly;
As gold did not continue to fall after reaching around 3287, on the contrary, it gradually rebounded to above 3300, which may strengthen the market's consensus on the short-term bottom, thereby attracting the favor of off-site funds; from the current gold structure, if gold can maintain above 3300-3295, it may be combined with the 3287 low to build a "W" double bottom structure, which is conducive to supporting the rebound of gold.
However, as gold fell below 3300 again, the bearish trend is relatively strong, so we need to moderately lower our expectations for a gold rebound. In the short term, gold is under pressure in the 3315-3325 area, so we can temporarily look to this area for the rebound target. Therefore, in short-term trading, I do not advocate shorting gold directly, and you can first consider going long on gold in the 3300-3295 area, TP: 3310-3320-3330.
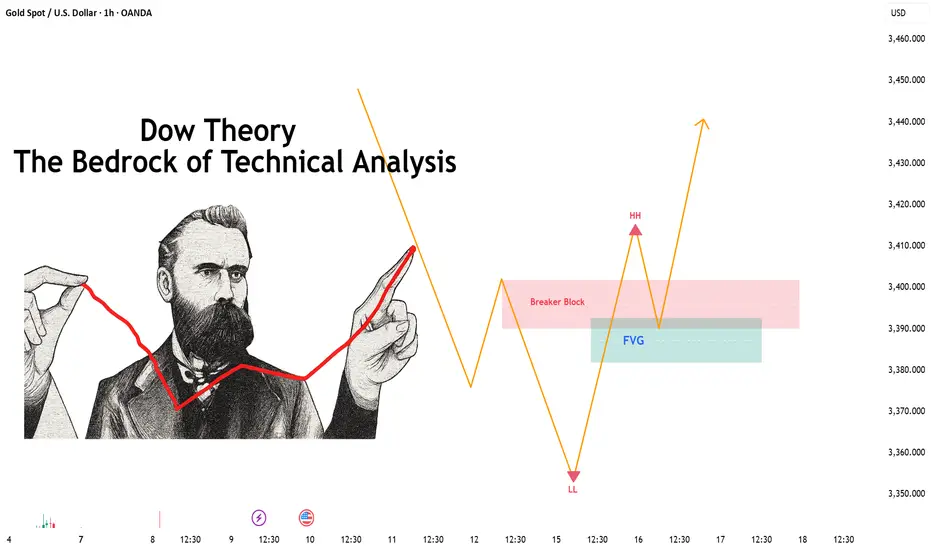
Dow Theory – Where Every Market Story BeginsDow Theory – Where Every Market Story Begins
Before Japanese candlesticks, before RSI or MACD — Dow Theory laid the very foundation of technical analysis. It’s not just a dry academic concept — it’s a mental map for understanding how the market truly behaves.
According to Charles Dow, markets always move in trends — and those trends unfold in natural psychological cycles: quiet accumulation, rapid momentum as the crowd joins in, and finally distribution, where smart money exits.
Sounds familiar? That’s because it still holds true to this day.
Why do I believe it’s the best?
Because it’s not an indicator.
It’s not reliant on flashy tools or complex algorithms.
Dow Theory is a mindset — a framework that teaches you how to read price charts like a seasoned analyst reads behaviour.
Over my 15 years in this industry, I’ve tested countless systems. Some worked temporarily. Most didn’t. But the one concept that’s never failed me — especially during market crashes and wild volatility — is the elegance and clarity of Dow Theory.
Once you understand how price moves with purpose, you’ll no longer:
Panic when the market swings
Enter impulsively out of fear
Or chase setups without structure
Instead, you’ll trade with calm, with logic — and with confidence.
The core concepts you must master:
First, the market moves in trends.
There are 3 types:
Primary trend – the dominant direction, lasting months or years
Secondary trend – corrections within the primary move
Minor trend – short-term noise
Second, every primary trend has 3 clear phases:
Accumulation – smart money enters quietly, while the public is still fearful
Public Participation – price breaks out, news gets good, and the crowd jumps in
Distribution – price is high, everyone’s optimistic, but the big players are already selling
Third, volume must confirm price.
A true trend is backed by commitment — and volume is the proof.
Lastly, a trend remains valid until there’s clear structural reversal.
We don’t guess tops or bottoms. We wait for break of structure — then act.
How do I apply this in the real market?
Simple. I start by asking:
What phase are we in?
Are institutions accumulating?
Is this breakout backed by volume?
Has the previous high been broken with momentum?
If yes — I wait for a pullback.
Then I look for a Pin Bar, Engulfing, or Fakey backed by volume.
Then I strike.
Not emotionally. Strategically.
That’s Dow Theory in motion:
Structure before signals
Patience before action
Precision before profit
When is Dow Theory most effective?
When the market has a clear trend
When you trade on H1 and above
When you use price action but need a solid framework
When you want to trade based on behaviour and structure, not just indicators
It works best when you’re not chasing noise — but following narrative.
Final thoughts I want to share with you:
Markets will change.
Tools will evolve.
But the one thing that remains constant is human emotion.
Dow Theory is your compass in that emotional jungle.
It won’t make you rich overnight.
It won’t flash signals every five minutes.
But it will keep you aligned with the market’s true rhythm.
“Great traders don’t just follow price — they understand what’s behind it. Dow Theory teaches you that.”
Would you like me to turn this into a voice-over script, YouTube video outline, or training slides for your class or content platform? Just say the word!
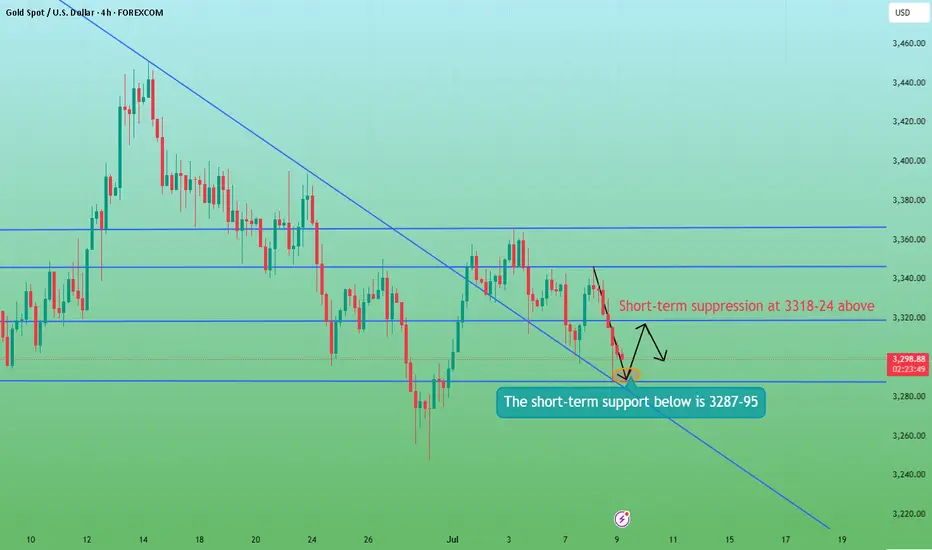
There is still a chance to rebound from the bottomFrom the 4-hour analysis, the support line of 3287-3295 is concerned below, the short-term resistance line of 3316-24 is concerned above, and the watershed of 3345-50 is concerned. The overall main tone of participation in the high-altitude and low-long cycle remains unchanged. In the middle position, watch more and do less, and follow orders cautiously, and maintain the main tone of participation in the trend. Wait patiently for key points to participate. I will remind you of the specific operation strategy in the link, so pay attention in time.
XAUUSD Short Term Possibility AnalysisGold has an are between 3324 to 3328. It hold for a while there and target back to one hour OB which is residing on 3355 to 3365. Previous day gold move shows intense buying which is sign of potential buying in gold. As weekly candles show strong uptrend the possible move for gold will be in uptrend therefore two scenarios are shared here. If gold breaks 3324 to 3328 support it will possibly target the daily low which is residing on 3295.

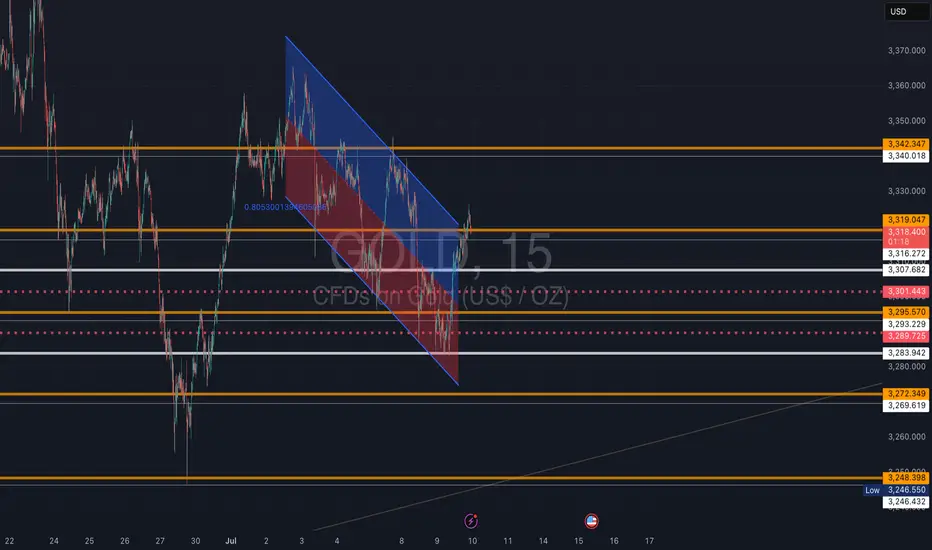
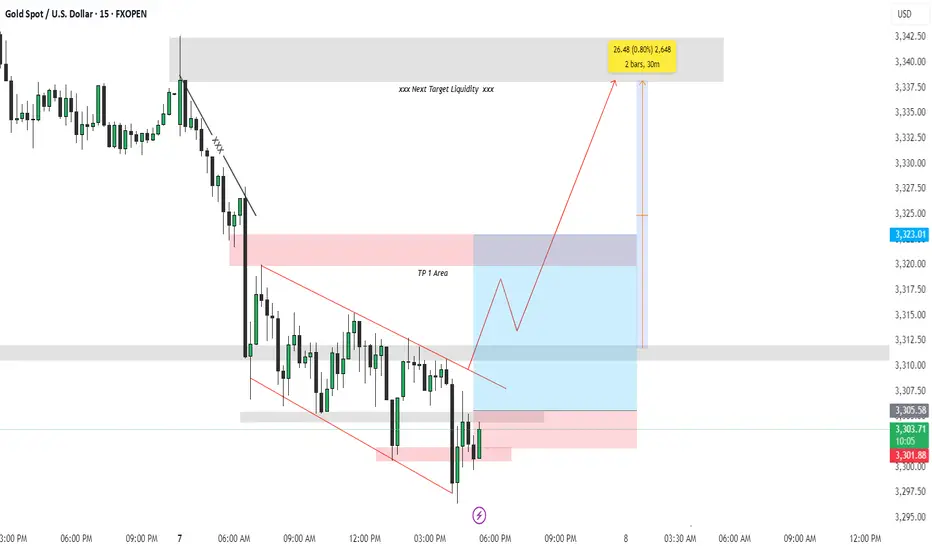
Trade Breakdown: XAUUSD 15-Min | Liquidity Grab + Reversal PlayOANDA:XAUUSD
Psychological Setup
This trade is rooted in the psychology of smart money and retail behavior. After a sharp drop in price, most retail traders expect continuation (trend-following). However, institutions often manipulate liquidity zones — hunting for stop-losses before a true reversal. This trade capitalizes on that behavior.
🔍 Technical Explanation:
🔻 1. Market Structure:
Price was previously in a downtrend, forming lower highs and lower lows.
A falling wedge pattern (red lines) formed after a strong bearish move, signaling potential bullish reversal.
Price broke the wedge to the upside — a classic reversal signal.
🔁 2. Liquidity Concept:
Below the wedge: The market grabbed liquidity by taking out stop losses of buyers who entered too early.
Above the wedge (TP Areas):
TP 1 Area (red box): This is the first logical resistance where previous supply sits — many sellers will enter here, providing buy-side liquidity.
Next Target Liquidity (grey box above): This is a major imbalance zone and likely where stop-losses of early short sellers are stacked.
Price is expected to grab liquidity from that area (marked by the red arrow).
✅ Entry & Trade Logic:
Entry Zone: After liquidity was swept at the bottom of the wedge, a bullish engulfing candle formed near demand — signaling institutional interest.
Risk-Reward Setup:
Targeting 0.80% move (approx. 26.48 points).
Trade is based on reversal from demand zone + wedge breakout + liquidity grab confirmation.
🎯 Target Projections:
TP1 Area: Conservative target, just above recent structure.
Final Target: High-probability liquidity zone where market is drawn to clean up resting orders (grey zone).
🧠 Why This Trade Matters (Trading Psychology Insight):
Most retail traders get trapped in emotional entries — entering shorts after a drop or longs too early in a wedge.
Smart money waits for liquidity sweeps before moving price in the desired direction.
This setup shows the importance of patience, structure, and understanding market psychology rather than reacting emotionally to price action.
📌 Key Takeaways:
📉 Trap: Falling wedge builds false bearish confidence.
🧠 Psychology: Stop hunts create fuel for reversal.
📈 Reaction: Smart money absorbs liquidity, moves price toward next inefficiency.
Hashtags:
#XAUUSD #SmartMoney #LiquidityHunt #TradingPsychology #GoldTrade #PriceAction #WedgeBreakout #FXOpen #TechnicalAnalysis #SupplyDemand
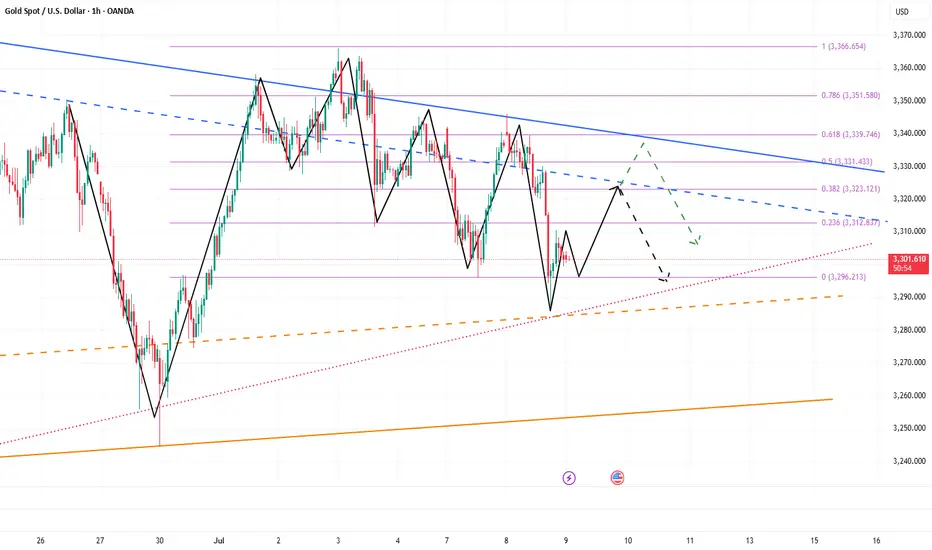
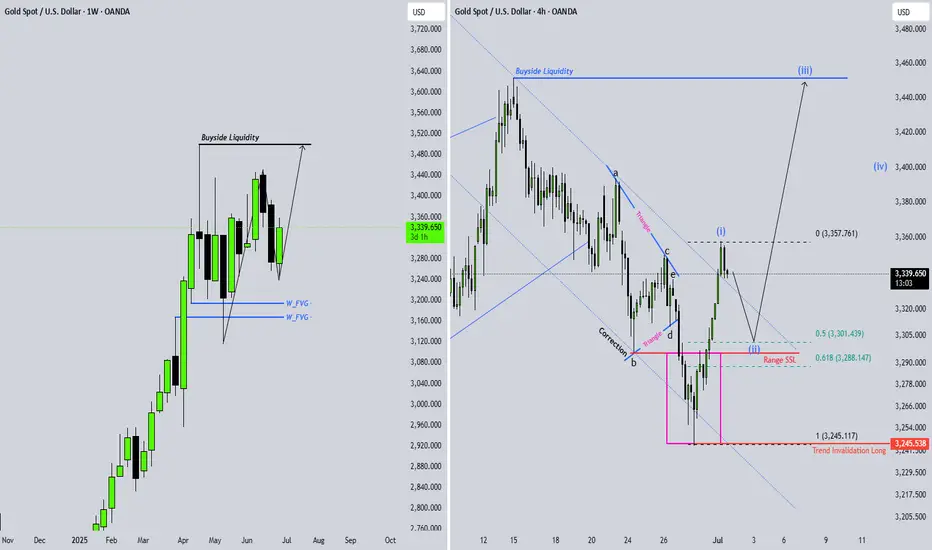
Gold BullishAfter exiting a correction, the first impulse (Wave 1) appears. I expect a retracement of at least 50% of the Fibonacci.
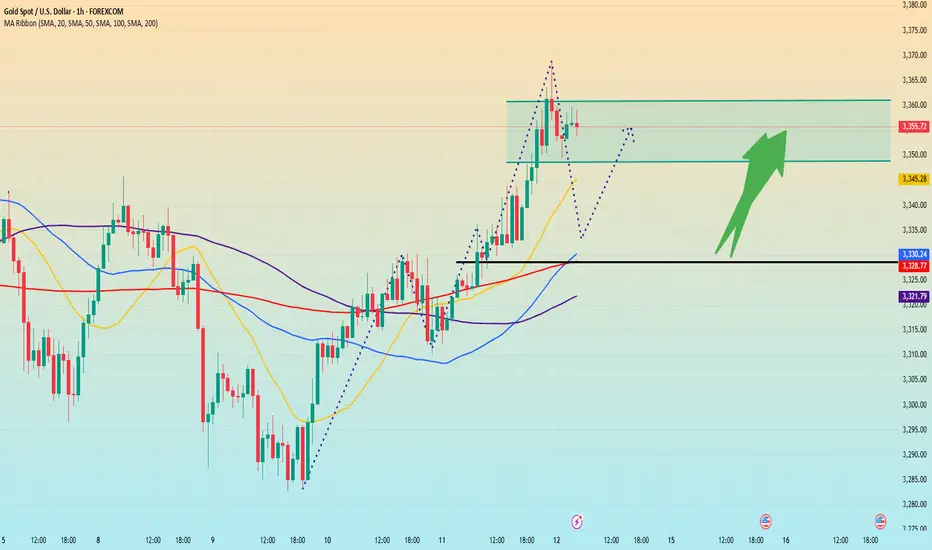
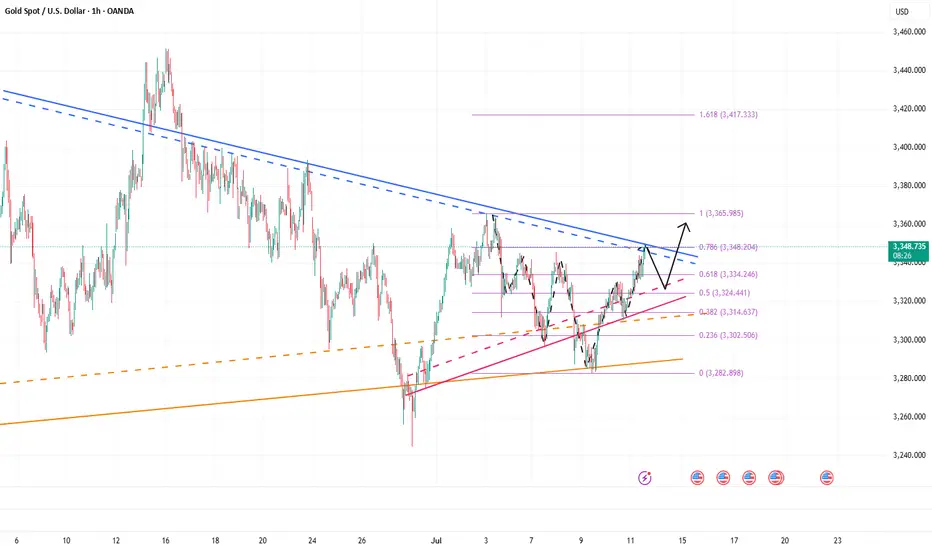
Gold breaks through. Will it continue?After breaking through the position predicted by Quaid on Friday, gold rose strongly and finally maintained the fluctuation range of 3345-3360 that I predicted. Gold bulls are now strong. If there is no major change in the news over the weekend, the price will likely continue to rise after a slight decline at the beginning of next week. I think we can still follow the strategy of Dutou.
The 1-hour moving average of gold continues to diverge with a golden cross and upward bullish arrangement, and the bullish momentum of gold is still there. The current strong support level of gold has also moved up to around 3330. After gold broke through 3330 over the weekend, the price fell back to 3330 and stabilized and rose twice. In the short term, this position has formed a strong support.
There is a high probability that the price will have a small correction at the beginning of next week. We can continue the bullish strategy after the price falls back.
Market transactions should abandon personal preferences. Preconceived subjective consciousness will eventually be taught a lesson by the market. The market is always right. We should follow the fluctuations of the market. Instead of having a head full of random thoughts. There are always traces of market changes, and you need to have the ability to discover them or follow those who have the ability. The market changes rapidly, so pay attention to more timely changes.
Gold elliot wave. a new one at the making.Could this be the case for the next weeK? if this is the case then its bullish and will break above 400.

Continue to try to find the top of the band to short goldGold maintained a slow and volatile rise structure during the day. The highest has reached 3348, and it is only a step away from 3350. Will gold continue its upward momentum as usual?
In fact, it was beyond my expectation that gold could break through 3345 in the short term. According to my original expectation, the intraday high of gold was almost around 3345. Although the rebound of gold exceeded expectations, it is currently located near the resistance of 3348-3350, so I will definitely not give priority to chasing gold at high levels in short-term transactions.
Moreover, gold is currently in the resistance area of 3348-3350. The volatility of gold has converged, and the upward momentum has declined. As gold continues to rebound and faces the key resistance area again, the bulls are relatively more cautious. In this context, this resistance area may act as a catalyst, and the bears will react, leading the decline in gold. However, as gold rebounds and the support below gradually stabilizes, we can appropriately reduce the expectation of gold's decline and adjust the decline target to the 3330-3320 area.
So for short-term trading, I will still short gold based on the resistance area, trying to find a swing top in the 3340-3350 area, and look at the target area of 3330-3320.
Gold price rises as expected, is 3400 far behind?
💡Message Strategy
Trump announced on Friday that he would impose a 35% comprehensive tariff on Canadian imports, which will take effect on August 1, which caused a market shock. As Canada's largest trading partner, the United States accounts for 76% of Canada's exports in 2024. This move will undoubtedly have a profound impact on the global supply chain and trade pattern.
In addition, Trump's tariff policies on copper and Brazil have further exacerbated market uncertainty, pushing gold prices to break through key technical resistance levels and move towards the $3,400 mark.
The Fed's policy moves also have an important impact on market sentiment. The minutes of the June meeting released on Wednesday showed that the Fed's internal concerns about tariffs potentially pushing up inflation are growing. The minutes pointed out that "most participants emphasized that tariffs could have a more lasting impact on inflation."
Despite this, the Fed reiterated that it would remain on the sidelines and wait for further clarity on inflation and economic activity. At present, according to the market forecast of the CME FedWatch tool, the probability of a 25 basis point rate cut in September has risen to 62.9%, reflecting investors' expectations that the Fed may ease early.
📊Technical aspects
Yesterday’s strategic recommendations mentioned that the effective support level for gold was in the 3280-3285 range. Today, gold fell back to the 3280 level, stabilized, and began to rise, perfectly reaching the target.
From a technical perspective, gold has shown significant upward momentum this week. The daily chart shows that the price of gold has successfully broken through the symmetrical triangle resistance and touched the 20-day simple moving average (SMA) of $3,339.97.
This breakthrough marks a strengthening of the short-term technical pattern, showing that bulls have the upper hand. The relative strength index (RSI) has rebounded to around 55 on the daily chart and is trending upward, indicating that there is slight bullish momentum in the market.
However, in the short term, the upside of gold may be limited by the 23.6% Fibonacci retracement level ($3,370). If this level can be effectively broken, the psychological level of $3,400 and the June high of $3,452 will become the next target.
💰Strategy Package
Long Position:3335-3340,SL:3320,Target: 3370-3400
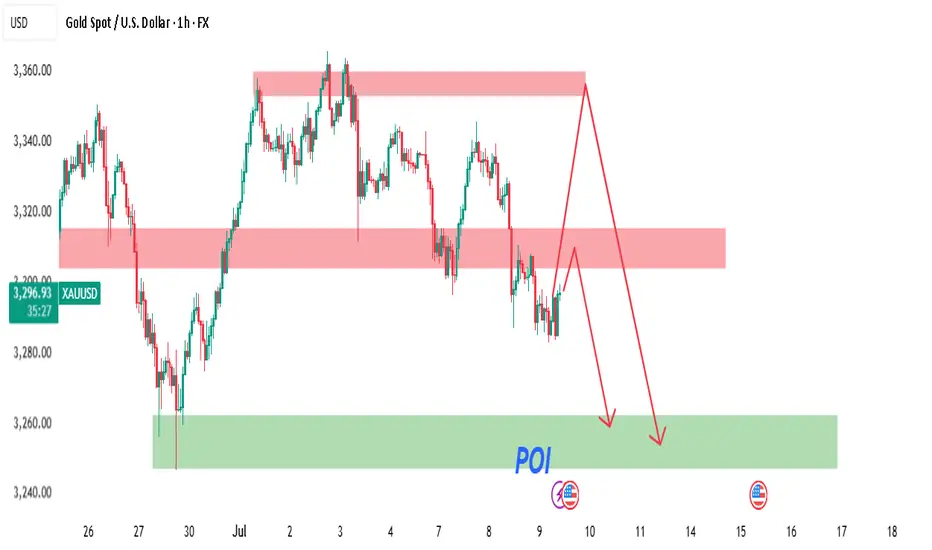
XAUUSD (GOLD) – 1H Analysis – Smart Money ConceptPrice is currently reacting around the 1H bearish order block (OB) within the supply zone near $3,300 – $3,320. We expect a short-term bullish retracement into this premium zone before a potential bearish continuation toward our Point of Interest (POI) at the green demand zone ($3,245 – $3,260).
📌 Two scenarios in play:
Sell from current supply zone ($3,300–$3,320) → First TP near $3,265 → Final TP at $3,250.
If price breaks above, next entry is at higher supply zone ($3,340–$3,360) for a deeper sell.
⚠️ Watch for price reaction around the POI (Demand Zone) for potential bullish setup later in the week.
🧠 Smart Money Concept (SMC) in play:
Supply zone respect
BOS/CHOCH confirmed
POI (Demand) targeted
FVG/Imbalance below being filled
📅 NFP & CPI events this week – expect increased volatility.
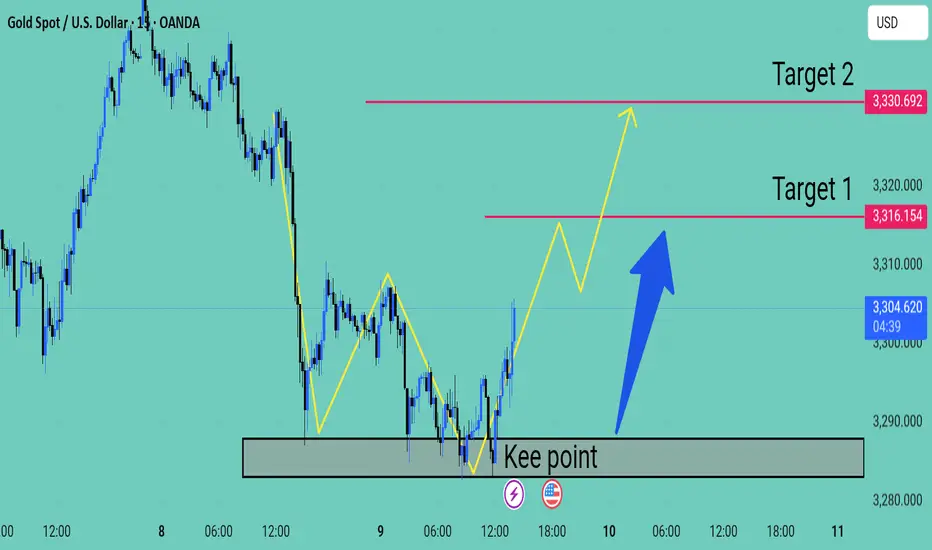
Expecting Gold bullish Movement The chart illustrates a potential bullish reversal setup for Gold XAU/USD on the 15-minute timeframe Price action has recently tested and respected a key demand zone marked as the Kee point around the 32853 level This area acted as strong support with multiple rejections suggesting buyer interest
Following this, the price has started forming higher lows and higher highs indicating the beginning of a bullish structure The large blue arrow suggests bullish momentum is expected to continue, aiming for upside targets
Key Levels
Kee Point Support Zone 3285 Crucial area where the reversal initiated
Target 1: 3316 First resistance level and a potential take-profit zone
Target 2: 3330 Final bullish target if momentum sustains
Outlook
As long as the price holds above the Kee Point, bullish continuation is favored
Breaking and closing above Target 1 could lead to further gains toward Target 2
A break below the Kee Point would invalidate this bullish scenario
This setup presents a potential buying opportunity with defined upside targets contingent on sustained bullish pressure
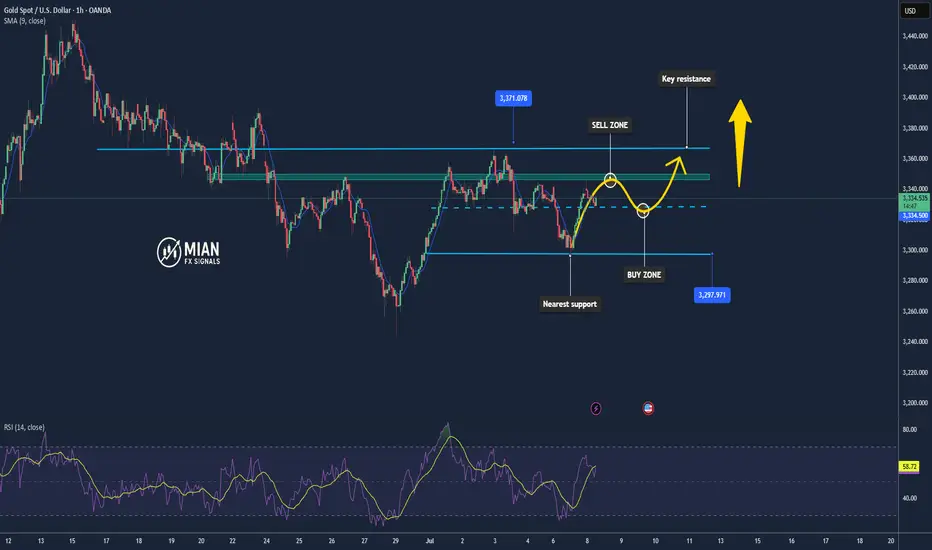
Gold Ranges at $3,330–$3,335 – Ready for the Next Move📊 Market Overview:
Gold is currently trading around $3,330–$3,335/oz, supported by a softer US Dollar and cautious sentiment ahead of key US labor data. According to TradingView, gold is consolidating in a tight range, reflecting market indecision while awaiting a clear breakout signal.
📉 Technical Analysis:
• Key resistance: $3,345–3,350 – a strong supply zone that recently rejected price.
• Nearest support: $3,320–3,330 – multiple bounce points observed here.
• EMA09: Price is hovering around the 09 EMA on both 1h–4h timeframes → neutral/slightly ranging.
• Candlestick / Volume / Momentum:
o A “bearish flag” pattern appears to be forming, suggesting potential for a downside breakout.
o Weak buying volume during upward moves signals limited bullish strength.
📌 Outlook:
• Gold may continue to consolidate between $3,330–$3,345.
• A break above $3,345 with strong volume could open the path to $3,360–$3,380.
• A break below $3,330 could lead to further correction toward $3,300–$3,320.
💡 Suggested Trading Strategy:
SELL XAU/USD at: 3,343 – 3,345
🎯 TP: 40/80/200 pips
❌ SL: 3,355
BUY XAU/USD at: 3,330 – 3,327
🎯 TP: 40/80/200 pips
❌ SL: 3,320
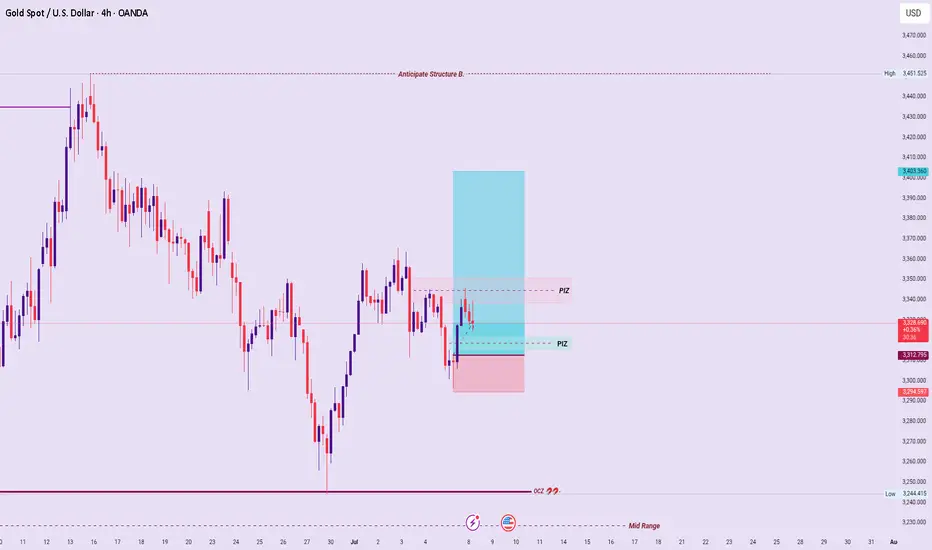
XAUUSD – Trade Projection (Post-London Open)
Current Market Context:
Price is currently oscillating between two Higher Timeframe Price Inefficiency Zones (PIZ), resulting in a neutral bias for initiating new positions.
Anticipated Scenarios & Bias Filters:
If both upper and lower PIZ zones reject price, confirming compression and exhaustion, bias will shift toward a Sell-Side Bias Environment (SBE).
If the lower PIZ acts as support and price trades decisively above the upper PIZ, it strengthens alignment with the HTF Ascend Sequence and confirms a renewed Buy-Side Bias Environment (BBE).
Execution Plan:
Preferred entry confirmation: Momentum Breach Entry (MBE) post-structural resolution from the PIZ boundaries, in line with breakout momentum.
Summary :
Neutral bias in the interim; awaiting directional clarity from PIZ reactions. Prepared to align with the first strong rejection-confirmation sequence and respond with momentum-based entry.
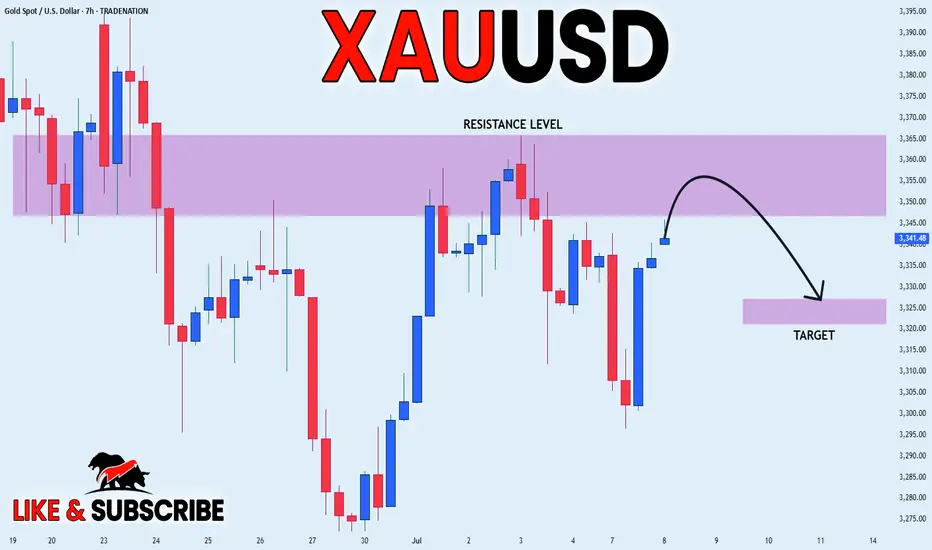
GOLD RESISTANCE AHEAD|SHORT|
✅GOLD is going up now
But a strong resistance level is ahead at 3360$
Thus I am expecting a pullback
And a move down towards the target of 3325$
SHORT🔥
✅Like and subscribe to never miss a new idea!✅
Disclosure: I am part of Trade Nation's Influencer program and receive a monthly fee for using their TradingView charts in my analysis.
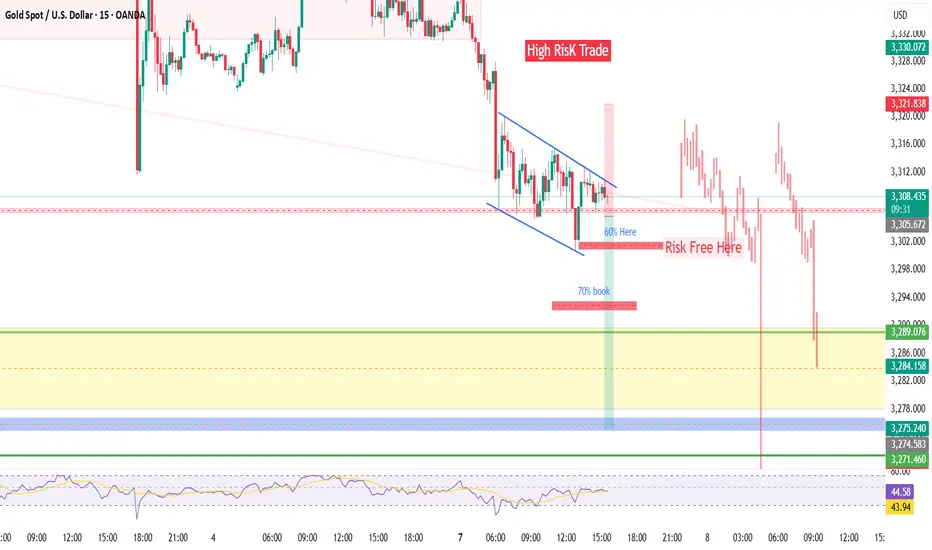
XAUUSDHigh Reisk Trade Short Planned
SL
TP
EP
Risk managment defined (risk free trade means move SL To ENtry)
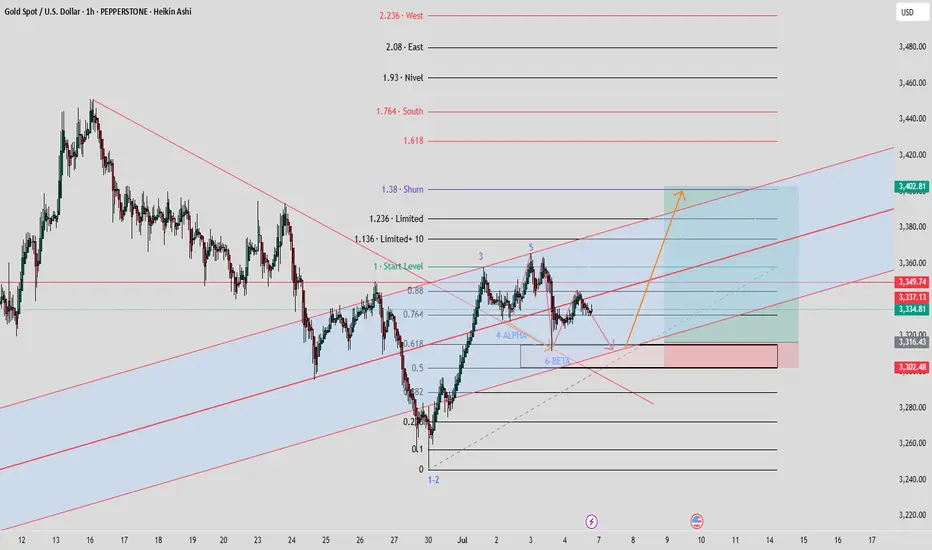
#GOLD_05.07.2025#COMBINED FRACTAL THEORY WITH ALMAZOV + FIBO CHANEL MANDELBROT FRACTAL
GOLD TREND LINE BREAKOUT + FIBO ZONE FOR PULLBACK, THIRD WAVE PENDING
fibo spiral #ALMAZOV
Fibonacci projection with golden numbers, A. A. Almazov's course, closing of the bearish trend cycle, reaching reversal levels, for longs
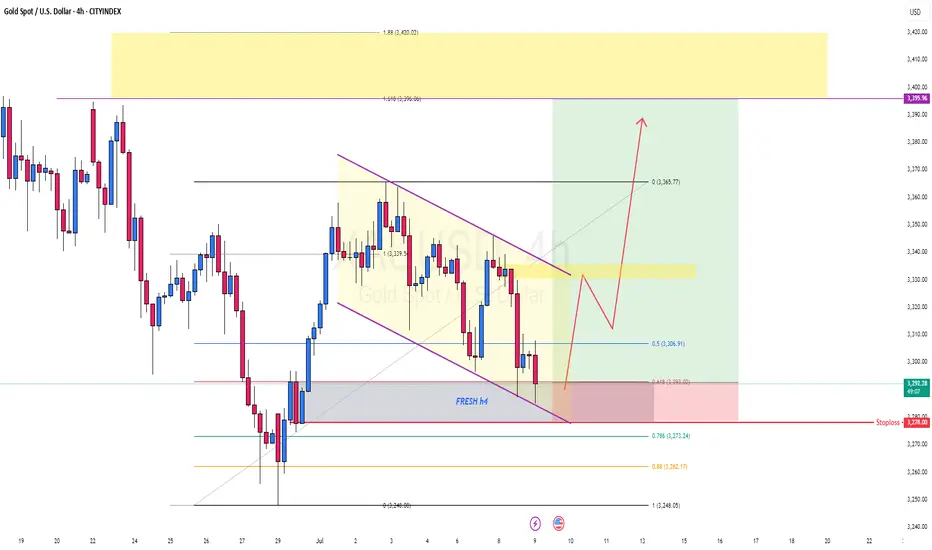
gold long viewbuy gold now regret later.. here my view bullish flag for gold.. Now market react on fresh zone 4h. Careful if breakout below.
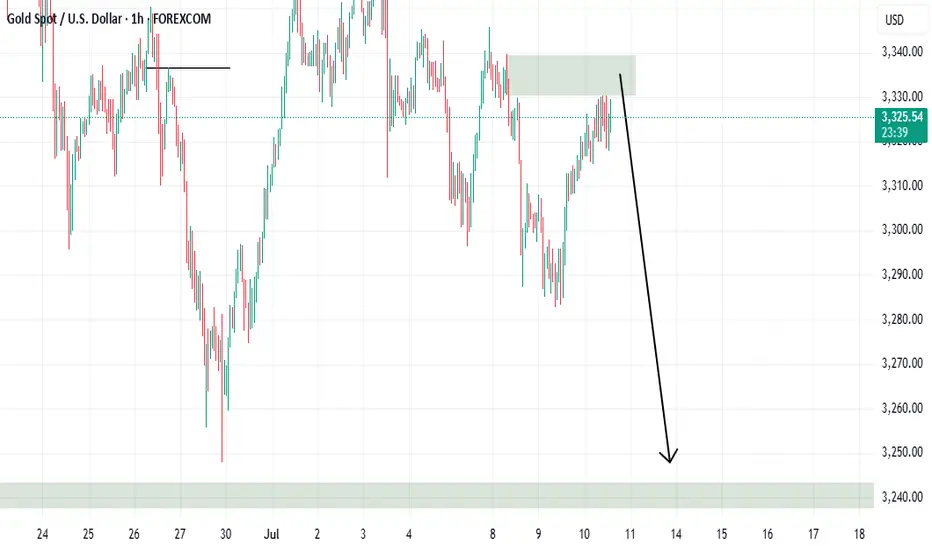
Sell idea!Market returned from a WA and it is time to react to an Special LOZ. let see what happened(wink)
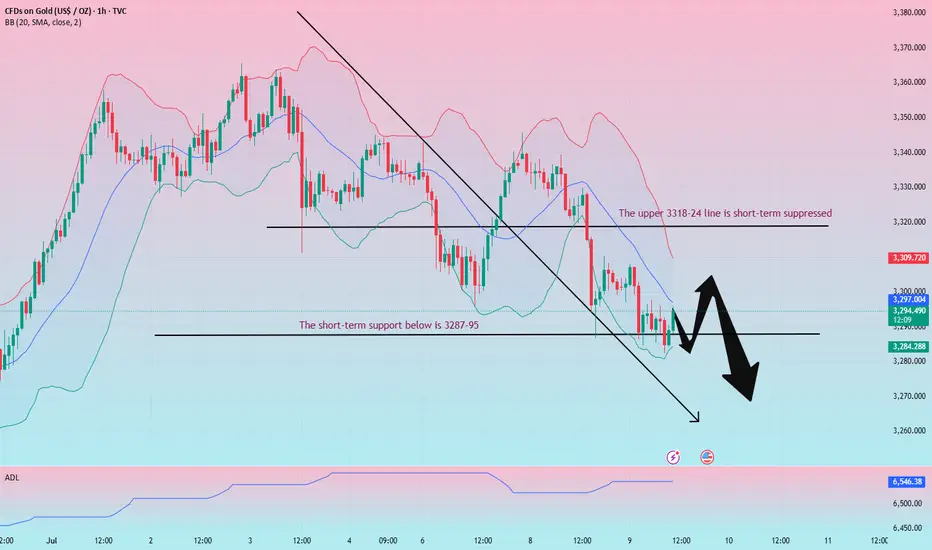
Don’t chase shorts when gold is at a low level, wait for a rebou
From the 4-hour analysis, today's upper short-term resistance focuses on the hourly top and bottom conversion position near 3318-24. The intraday rebound relies on this position to go short once and look down. The lower short-term support focuses on the vicinity of 3280. The overall support relies on the 3280-3325 area to maintain the main tone of high-altitude low-multiple cycles. In the middle position, watch more and move less, and follow orders cautiously, and wait patiently for key points to enter the market.
Gold operation strategy:
Gold 3285-3287 line long, stop loss 3277, target 3315-23 line, break and continue to hold
XAUUSD_1H
XAU/USD is currently in an upward trend, trading within a defined ascending channel. According to the trendline projection, the price could potentially reach the 3335 level.
xauusd is bullishAlthough xauusd have break the falling wedge pattern, it is still retesting before the main bullish run.
wait for confirmation at the entry zone before entry... Always have patience.