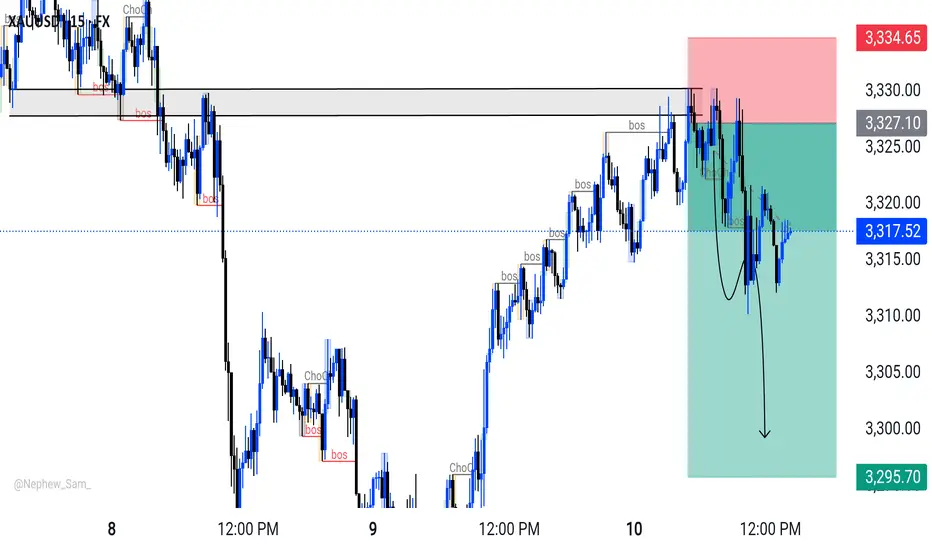
XAUUSDSELL Plan XAUUSD
GOLD rejecting from 4h resistance zone book partial profits risk free once yuo got 1:1
Best of luck
CFDGOLD trade ideas
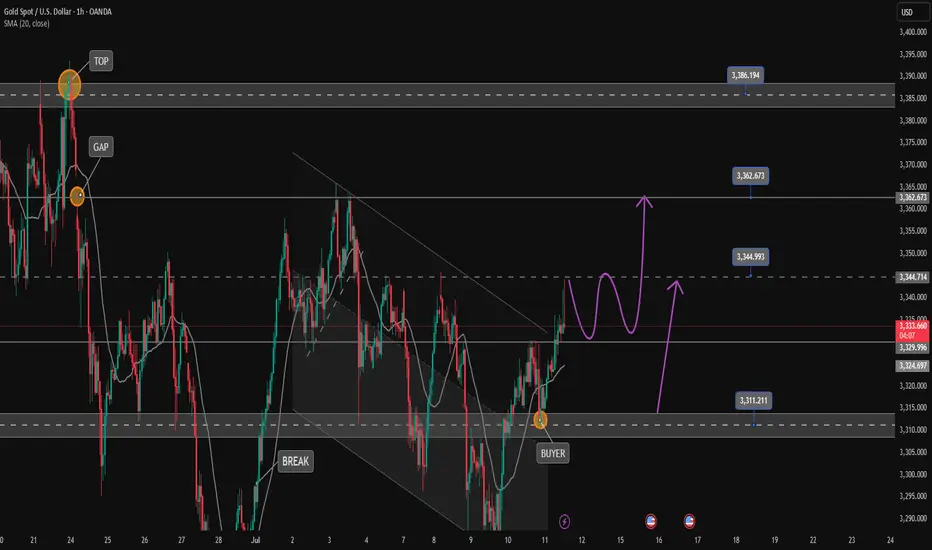
Gold breaks trendline towards 3390, Uptrend resumes✏️ OANDA:XAUUSD The price increase will continue today and will be even stronger. After breaking the trendline, gold has strong support. SELL strategies are only considered to find short-term reaction points waiting for the next trends.
Gold has confirmed the uptrend is back, heading to 3390 today.
📉 Key Levels
Support 3330-3314
Resistance 3345-3362-3388
Sell trigger: rejection from 3345 with bearish confirmation
Sell zone: 3362–3387 (Strong resistance)
BUY trigger: 3330-3314 support with bounce confirmation
Leave your comments on the idea. I am happy to read your views.
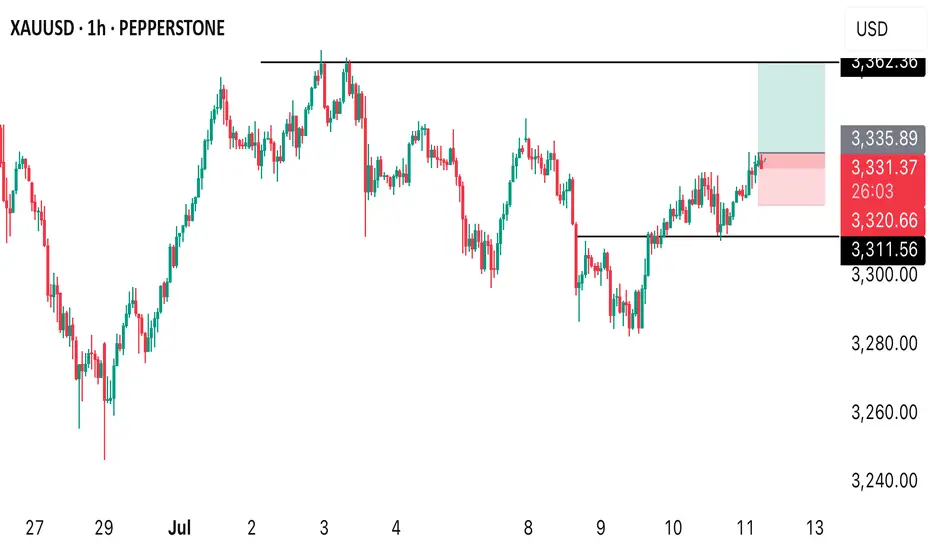
A buy opportunity on gold!Price broke and retested the level of 3311.56 therefore, from the technical perspective, a double button pattern is already formed and the neckline is broke. So, buy opportunity is envisaged.
The latest gold analysis and strategy on July 10:
Core logic of the market
Risk aversion supports gold prices: Trump postponed tariffs but threatened to increase them in the future. Market concerns about trade frictions remain, and gold is still supported as a safe-haven asset.
Impact of the US dollar trend: If trade tensions escalate, the US dollar may be under pressure, which is further beneficial to gold.
Technical side is bullish and volatile: The daily line closed positive and stabilized the lower Bollinger track. The H4 cycle rebounded with consecutive positives, but it has not yet broken through the key resistance of 3345. Be wary of repeated fluctuations.
Key point analysis
Support level: 3310-3300 (short-term), 3285 (strong support)
Resistance level: 3340-3345 (Daily Bollinger middle track), 3365 (target after breakthrough)
Key day of change: The rebound may continue on Thursday. If it breaks through 3345, it may further attack 3365-3400 on Friday.
Trading strategy
1. Low-to-long (main strategy)
Entry point: 3310-3315 (retracement support area)
Stop loss: 3305 (prevent false breakthrough)
Target: 3325 (short-term), 3335-3345 (key resistance area)
Logic: H4 cycle continuous positive shows bullish momentum, and it is expected to continue to rebound after retracement support.
2. High-level short-selling auxiliary trading strategy (if key resistance is touched)
Entry point: 3340-3345 (first test resistance area)
Stop loss: 3350 (prevent breakout and upward movement)
Target: 3325-3320 (short-term correction)
Logic: 3345 is a strong pressure from the middle track of the daily Bollinger. You can short before breaking through, but you need to enter and exit quickly.
Key observation points
3345 breakthrough situation:
If it stands firmly at 3345, you can go long with a light position after the correction (target 3365, 3400).
If it falls under pressure, it may return to the 3310-3340 oscillation range.
3300 defense situation:
If it falls below 3300, it may fall back to 3285, and we need to be alert to short-term weakness.
Summary
Main idea: Low-long (3310-3315) as the main, target 3345, and look at 3365+ after breaking through.
Auxiliary strategy: 3340-3345 short, fast in and fast out.
Risk control: Strictly stop loss, avoid chasing up and selling down, and pay attention to the changes in the momentum of the US market.
Trump blasted Powell again. Interest rates remain unchanged.Information summary:
Trump blasted Powell on Wednesday, saying that the current interest rate is "at least 3 percentage points higher" and once again accused Fed Chairman Powell of "making the United States pay an extra $360 billion in refinancing costs each year." He also said that "there is no inflation" and that companies "are pouring into the United States," and urged the Fed to "cut interest rates."
During the U.S. trading session, gold also showed a significant rebound momentum, rebounding from a low of 3285 to above 3310 in one fell swoop. As of now, gold has stood above 3320.
Market analysis:
From the daily chart:
It can be seen that the first suppression position above gold is currently at 3325, followed by around 3345. Gold did not close above 3320 on Wednesday, which means that even if gold is currently above 3320, as long as today's daily line closes below 3320, it is still in a bearish trend. On the contrary, if the closing price today is above 3320, then the subsequent test of the suppression position near 3345 may be further carried out.
Secondly, from the 4-hour chart, the current suppression position above 4 hours is around 3330-3335. Therefore, today we should focus on this position. If we cannot stand firm and break through the range suppression here in the 4-hour chart, we may retreat again in the future. The key support position below is around 3310, which is the opening price today. If the price is to retreat, it is likely to fall below 3310. But it may also remain above 3310 for consolidation.
However, as long as it falls below 3310, I think the low point near 3285 may be refreshed, so pay attention to this.
Operation strategy:
Steady trading waits for 3310 to fall and break through to short, and the profit range is 3385 or even lower.
Aggressive trading can short near 3340, with a stop loss of 3350.
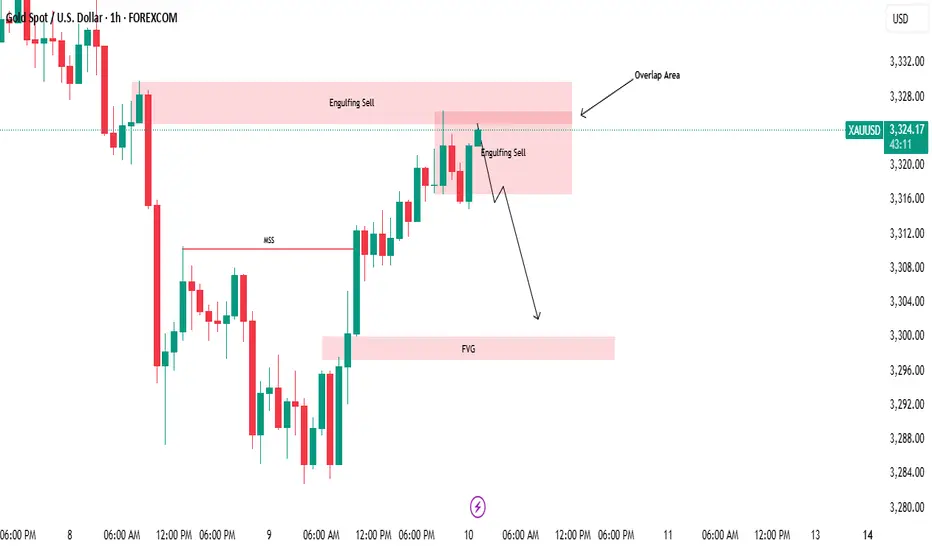
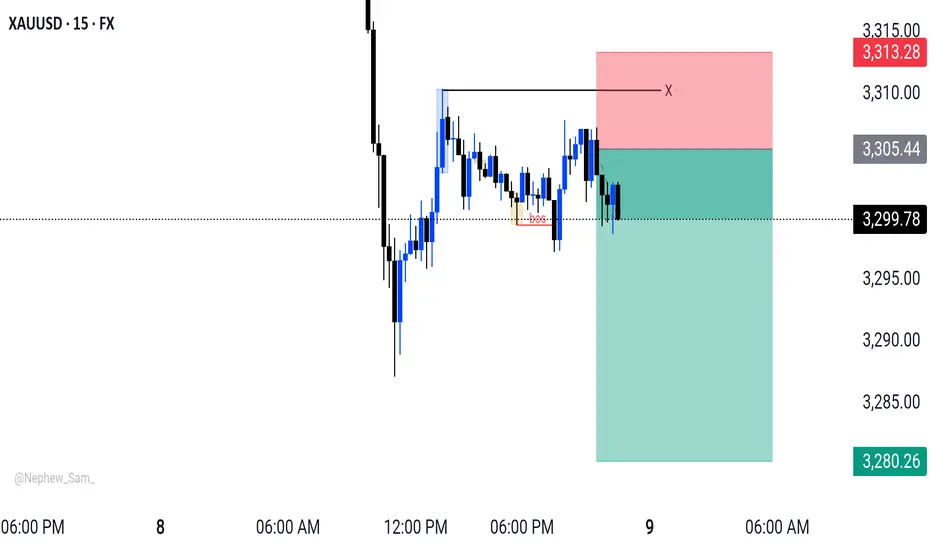
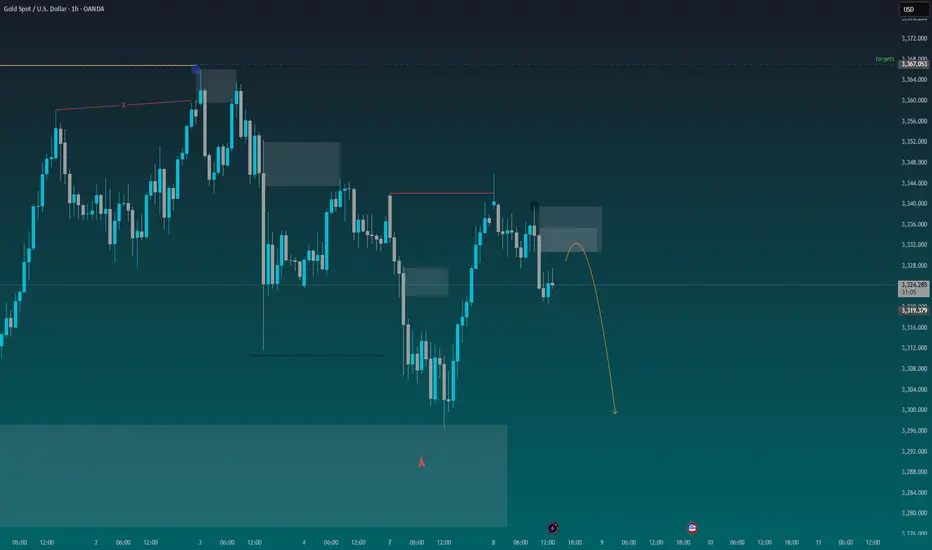
Market Structure Break & Bearish Reaction from Supply Zone.🔍 GOLD – Market Structure Break & Bearish Reaction from Supply Zone
Gold has recently broken its market structure (MSS), which is a significant shift in momentum and a potential indication of a change in the prevailing trend. Following this break, price retraced into a key supply zone, where it was rejected sharply—this rejection came in the form of a strong bearish engulfing candle, highlighting aggressive selling interest.
Interestingly, the market has now printed a second consecutive bearish engulfing from the same zone. This is a powerful signal that sellers are active and defending this level, making it a valid and confirmed short-term resistance zone. The repeated rejection suggests that smart money or institutional sellers may be positioned here.
Given this price action, we can anticipate a potential retracement from the current levels. The most probable downside target for this retracement would be the Fair Value Gap (FVG) that has been marked on the chart. If price respects the FVG and reacts bullishly from there, we may then see a resumption of the uptrend, possibly taking price higher again.
This setup presents a good opportunity for both short-term intraday traders and swing traders to watch for confirmation signals before entering the trade.
📌 Key Takeaways:
MSS indicates shift in trend
Consecutive bearish engulfing candles from supply zone
Sellers likely active in this area
Potential retracement toward marked FVG
Possible bullish continuation from FVG zone
🚨 As always, Do Your Own Research (DYOR) and manage your risk accordingly before making any trading decisions.
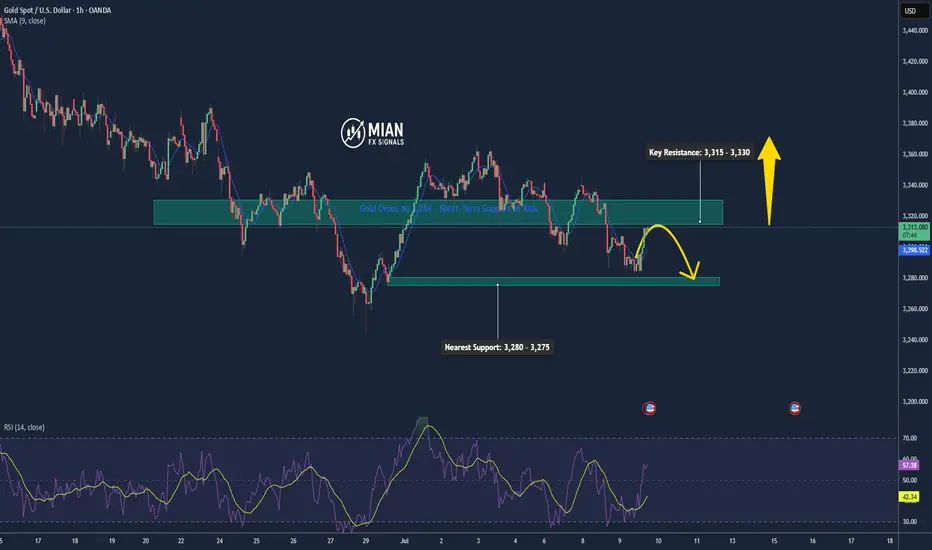
Gold Rebounds from 3283, Eyes 3315 Resistance📊 Market Overview:
• Gold dropped sharply to a low of $3283 earlier today before rebounding strongly back to around $3312, supported by renewed buying interest.
• The recovery is fueled by risk-off sentiment amid ongoing trade negotiation uncertainty and a mild pullback in the U.S. Dollar Index.
• Central bank buying continues to underpin gold’s base, despite mild pressure from rising U.S. bond yields.
________________________________________
📉 Technical Analysis:
• Key Resistance: $3315 – $3335
• Nearest Support: $3280
• EMA 09: Price is trading above the 9-period EMA, signaling a short-term bullish trend.
• Candle pattern / Momentum: A strong bullish engulfing candle formed after bouncing from $3283 on the H1 chart. MACD is crossing upward, and RSI is approaching the 60 level, suggesting bullish momentum.
________________________________________
📌 Outlook:
Gold may continue to recover in the short term if it holds above the $3300 level and successfully breaks through $3315 resistance. However, failure to break above this resistance could lead to a short-term pullback toward $3290–$3280.
________________________________________
💡 Suggested Trading Strategy:
🔻 SELL XAU/USD at: $3315–3325
🎯 TP: $3295
❌ SL: $3330
🔺 BUY XAU/USD at: $3285–3295
🎯 TP: $3315
❌ SL: $3280
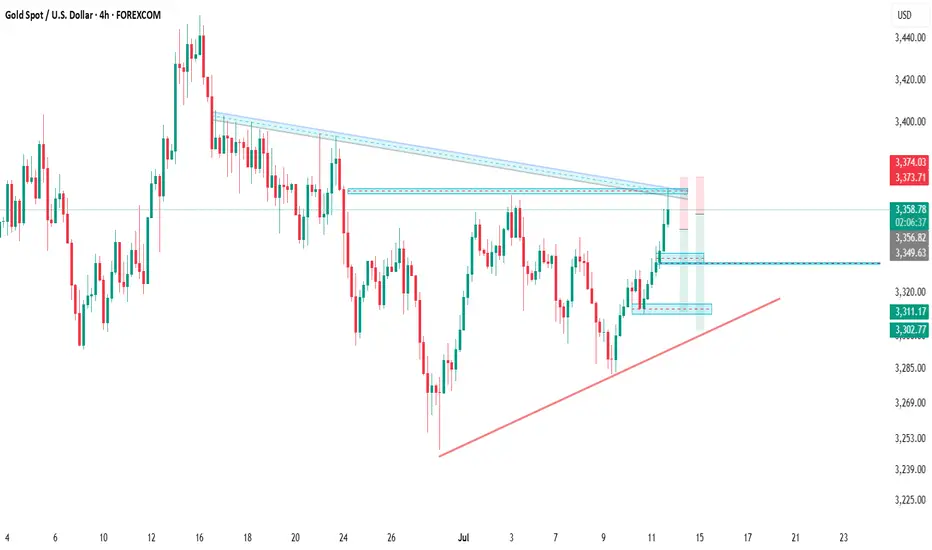
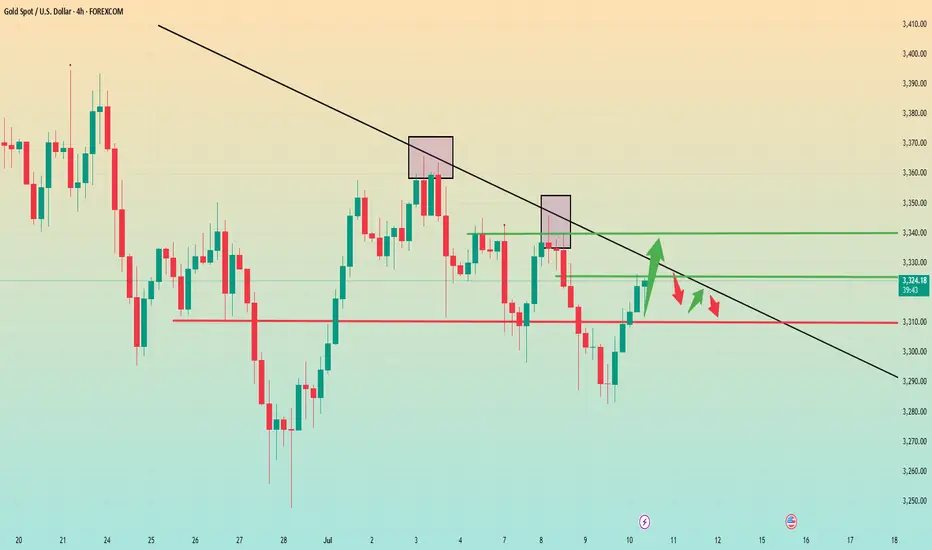
XAUUSD – Bearish Pressure Continues Below the TrendlineGold remains in a downtrend as price consistently gets rejected at the long-term descending trendline. After a short-term rebound toward the $3,341.300 level – near the trendline – XAUUSD is likely to resume its decline toward the support area at $3,254.400. The visible FVG zones indicate that selling pressure is still dominant.
In terms of news, the upcoming U.S. CPI data release on July 11 is the key event that could trigger strong volatility in gold prices. Previously, market sentiment turned cautious after the U.S. government delayed new tariffs on 14 countries, reducing risk-off demand and pulling capital away from gold. If the CPI data comes in hotter than expected, it could further fuel the downside momentum.
Keep an eye on the $3,254.400 level – this is the final support before gold potentially extends its drop to lower price zones.

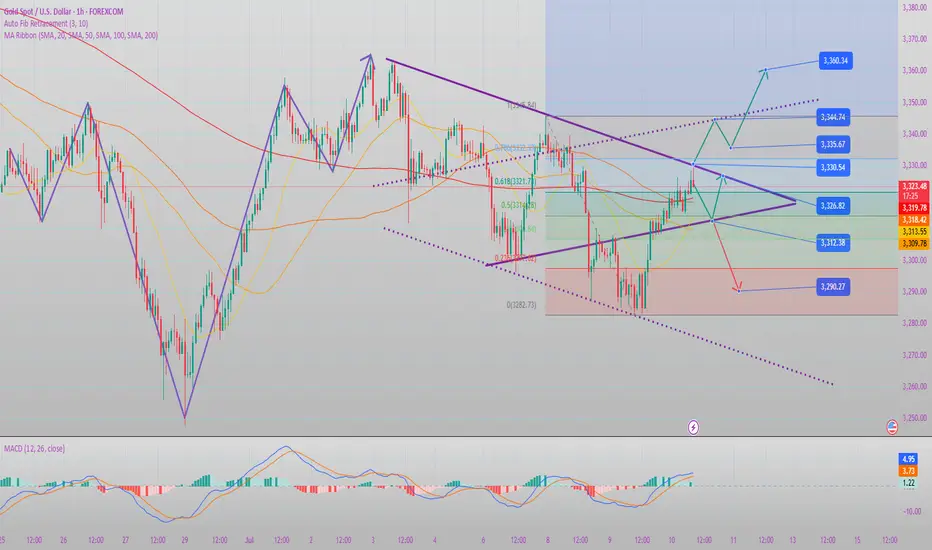
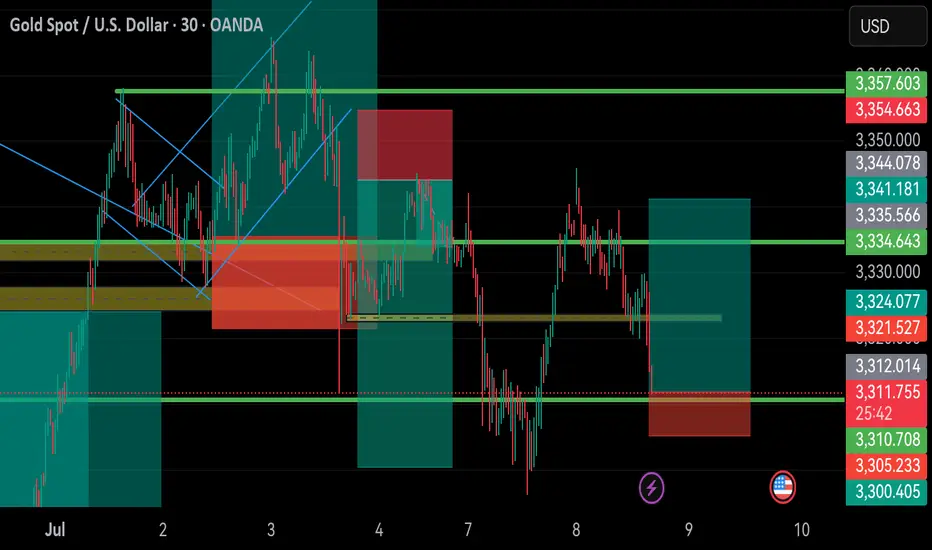
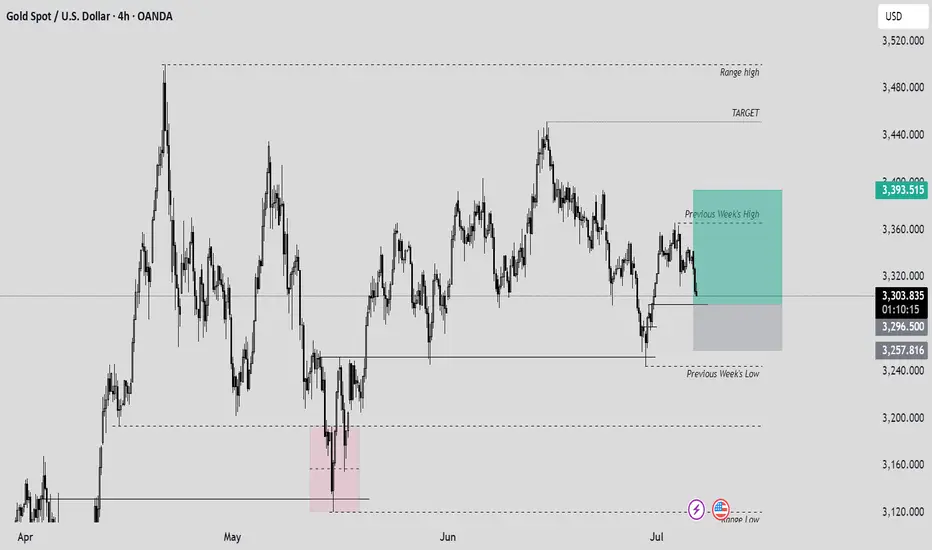
Gold’s Bullish Range Holds – Is This the Dip to Buy?With tensions easing in the Middle East and risk appetite moderating, gold has settled into a bullish daily range. The metal recently broke a key high, confirming its upward momentum, but now appears to be consolidating. The central question is whether gold will break lower for a deeper correction or whether this is merely a pause before the next leg higher.
Reduced geopolitical risk has tempered the “risk-on” rally in gold, but the metal remains firmly within a bullish daily range. This indicates that the underlying bid has not disappeared—only short-term speculative flows have adjusted.
Gold recently breached a protected high—likely a higher high or significant resistance level—reinforcing the prevailing bullish momentum. A pullback into imbalance or demand zones is anticipated; however, if a catalyst emerges, price could resume its advance from current levels, with the 0.328 Fibonacci retracement acting as a strong support.
Meanwhile, the DXY is exhibiting signs of a pullback but lacks the fundamental drivers necessary to sustain a broader rally.

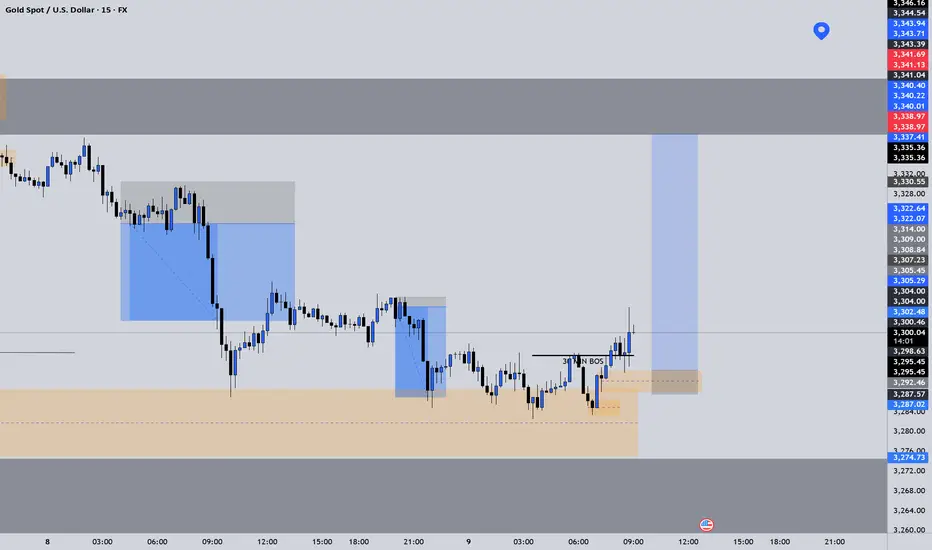
XAUUSD LongElite Analysis
Price came to primary OB.
30m Long BOS was confirmed.
Executed long trade from 10m OB.
Targeting above LP's and top market structure.

XAUUSD daily viewpoiintLooking for sellers on gold to stepinn around our hourly POI, Signal will be sent after an confirmation as been fulfilled on the LTF
PLS COMMENT YOUR VIEWPOINTS BELOW AND SHARE ANY IDEAS IF U HAVE, LIKE AND BOOST FOR MORE.!!!!!
Gold is falling from 50days MAGold is falling from 50 days Moving average and it will be a bearish trend and may fall 2 to 3% from 3320 (50MA).

July 8, 2025 - XAUUSD GOLD Analysis and Potential OpportunityAnalysis:
Bullish momentum remains strong. Watch the 3350 level as key resistance.
No clear directional bias yet, so Asia session strategy will focus on buying pullbacks near support.
🔍 Key Levels to Watch:
• 3375 – Resistance
• 3365 – Resistance
• 3350 – Resistance
• 3345 – Intraday key resistance
• 3330–3333 – Intraday key support zone
• 3322 – Short-term support
• 3315 – Support
• 3306 – Support
• 3300 – Psychological level
• 3295 – Key support
• 3275 – Support
📈 Intraday Strategy:
• SELL if price breaks below 3330 → watch 3326, then 3322, 3315, 3306
• BUY if price holds above 3346 → watch 3350, then 3355, 3360, 3365
👉 If you want to know how I time entries and set stop-losses, hit the like button so I know there’s interest — I may publish a detailed post by the weekend if support continues!
Disclaimer: This is my personal opinion, not financial advice. Always trade with caution and manage your risk.
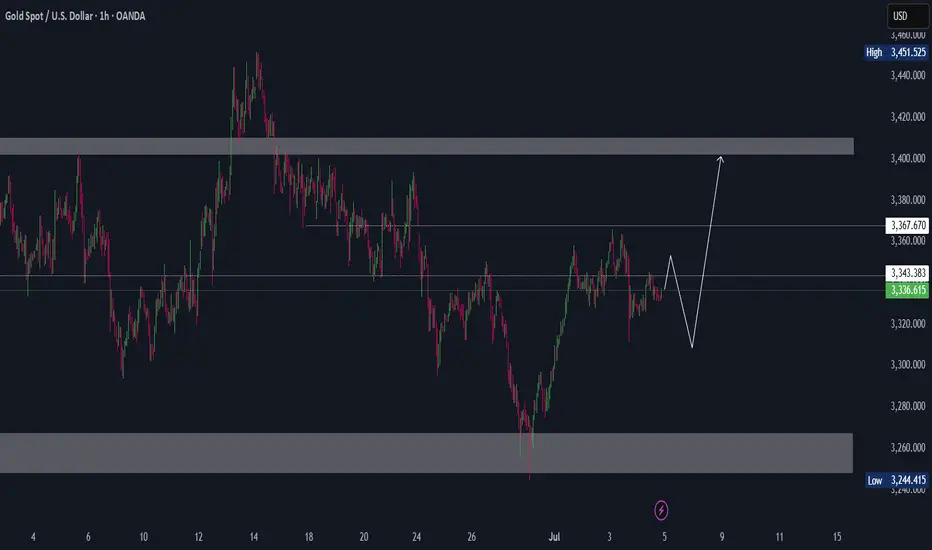
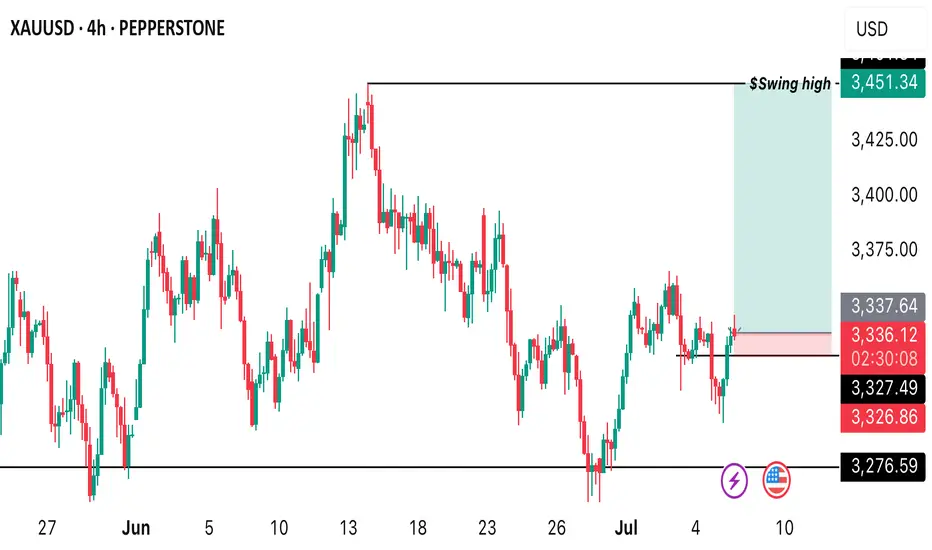
The swing buy opportunity you don’t wanna miss!Gold is in a good market condition for a buy opportunity as price strongly rejected the $3300. It’s looking quite good to go long from the current market price. Target profit is the swing high of 3451.34
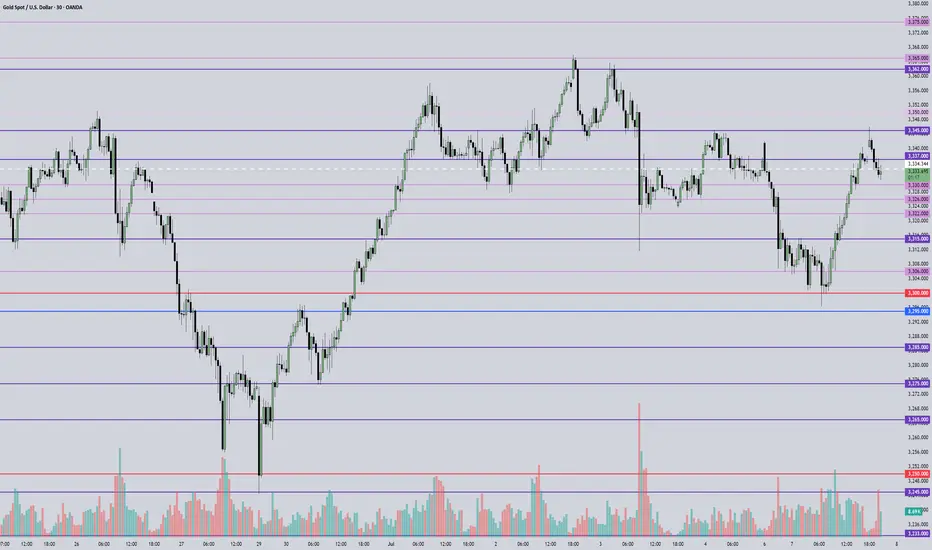
Gold falls below 3300, will it rebound or continue to fall?Gold opened lower in the morning today and then rebounded and fell again. This kind of jump market fluctuates quickly but is mostly short-term. I usually remind you to avoid chasing orders to prevent being washed. Gold rebounded weakly and failed to touch 3320 and began to fall continuously. This weak signal alerted me - it failed to rebound strongly after the gap and instead remained at a low level, suggesting that the downward momentum was very strong and fully released, and there was a risk of further weakening. In the afternoon, the gold price was still hovering around 3312-3307, confirming its weak pattern. Combined with the repeated pressure on the key support 3300, I judged that the trend has clearly turned to short.
Gold recommendation: short in the 3312-3315 range, stop loss 3320, target 3280

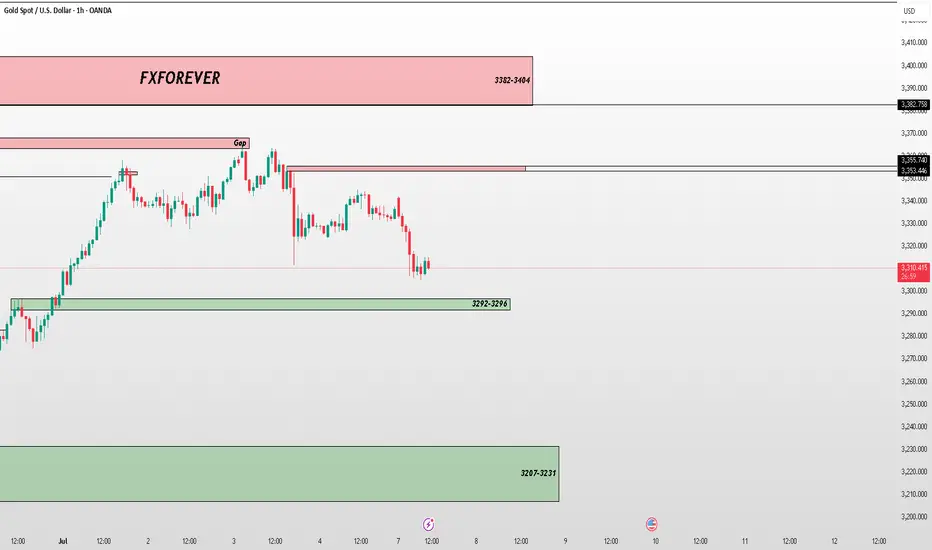
XAU/USD – Price Approaching Demand Zone (7 July 2025)📉 XAU/USD – Price Approaching Demand Zone (7 July 2025)
Gold has been consistently rejecting the upper gap zone and is now approaching the key 3292–3296 demand area.
📊 Key Zones:
🔻 Supply Zone (Gap): 3355–3357
🔻 Higher Supply: 3382–3404
🟩 Demand Zone to Watch: 3292–3296
🟩 Deeper Support: 3207–3231
📍 A reaction from 3292–3296 could trigger the next bullish leg. Watch for structure confirmation before entry.
🎯 FXFOREVER – Delivering clean chart zones and high-probability planning.
#XAUUSD #GoldForecast #FXFOREVER #SmartMoneyConcepts #DemandZone #SupplyGap #GoldAnalysis #PriceActionStrategy #ForexSetup
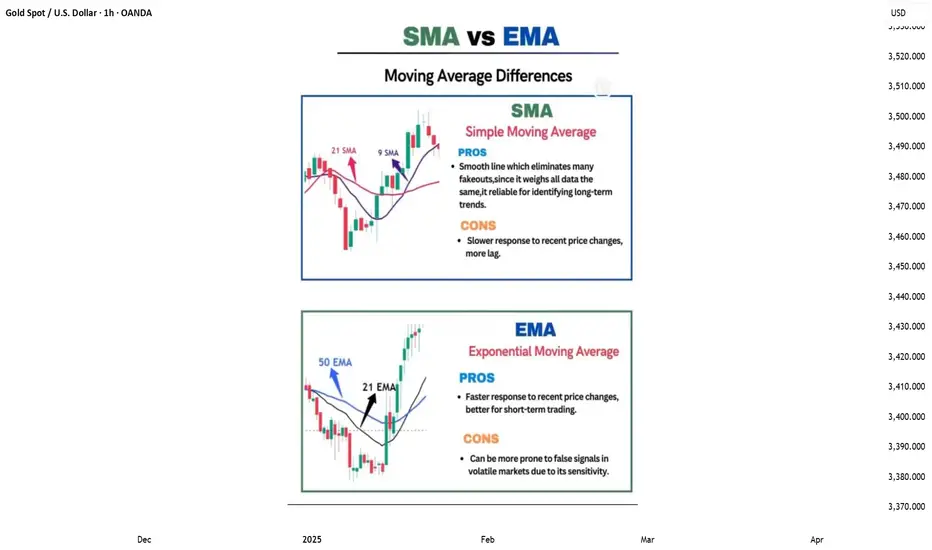
TRADING KNOWLEDGE – MOVING AVERAGE (MA)The Moving Average (MA) is a popular technical indicator that helps smooth out price data to better identify market trends. MA doesn't predict the future but helps traders clearly see the current direction of the market.
🔍 2 Main Types of MA:
🔔 SMA (Simple Moving Average): The average of closing prices over a set period (e.g., SMA 20 = average of the last 20 candles).
🔔 EMA (Exponential Moving Average): Similar to SMA but gives more weight to recent prices, making it more responsive to market changes.
📈 What is MA used for?
📍Trend Identification:
💡Upward sloping MA → Uptrend
💡Downward sloping MA → Downtrend
📍Trading Signals:
💡Price crossing above MA → Buy signal
💡Price crossing below MA → Sell signal
📍Combining Two MAs (Short & Long Term):
💡Short MA crosses above long MA → Buy signal (Golden Cross)
💡Short MA crosses below long MA → Sell signal (Death Cross)
XAUUSD buy Idea!Xauusd has printed its low in the past week and currently looking for a high nearing 3400 region. 3400 could be a very important rejection or breakout zone.