Elliott Wave Analysis – XAUUSD July 10, 2025
🌀 Elliott Wave Structure
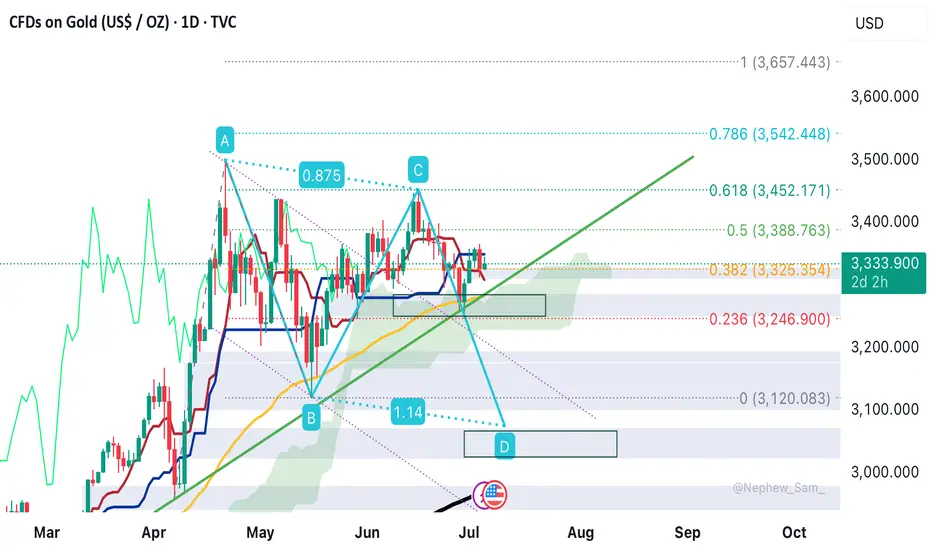
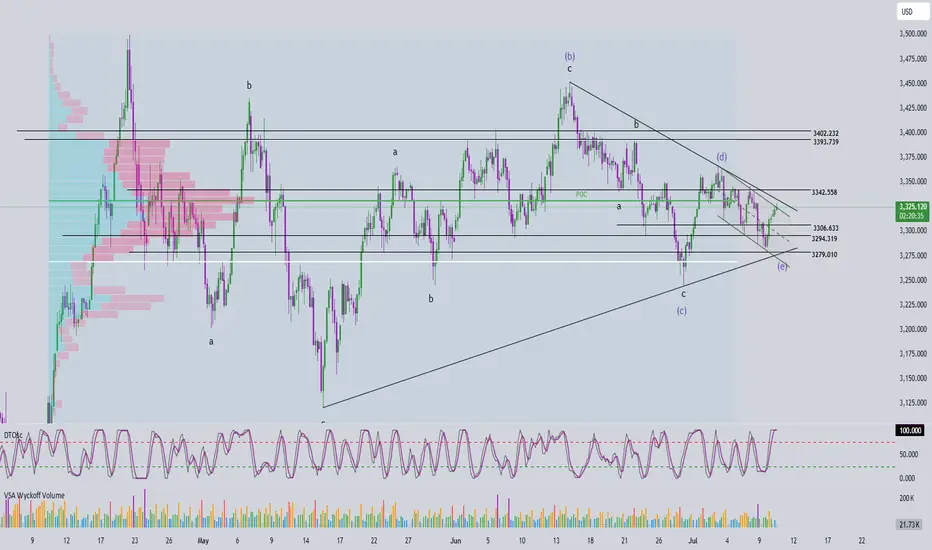
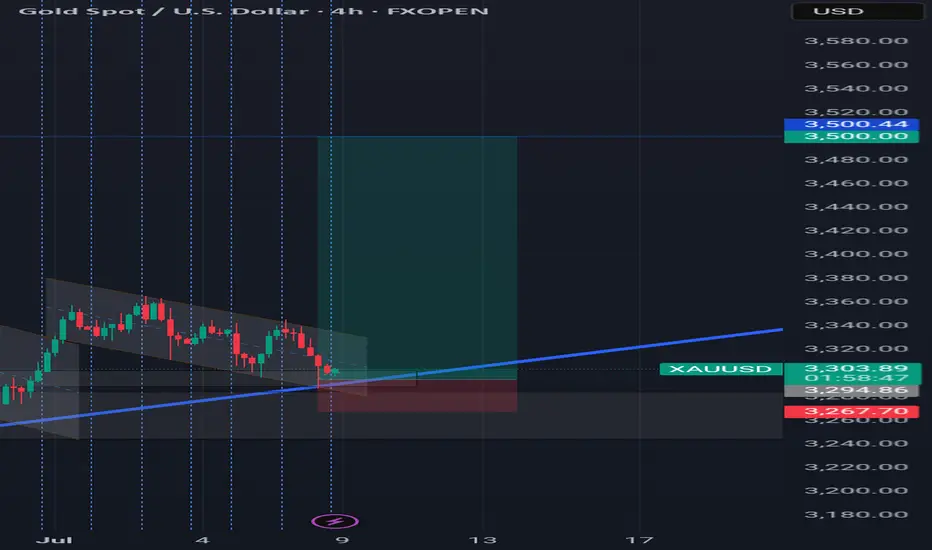
On the H4 timeframe, price has returned to test the upper boundary of the converging triangle – currently acting as dynamic resistance. Based on the current wave count, wave e (purple) may have completed at the 3279 low, and price is potentially starting a breakout move.
👉 A confirmed breakout above the triangle would validate the end of the abcde correction and mark the beginning of a new upward trend.
🔋 Momentum Analysis
D1 timeframe: As forecasted yesterday, momentum is entering oversold territory and showing early signs of a reversal. This suggests that an upward trend could dominate over the next 5 days.
H4 timeframe: The two momentum lines are sticking together, indicating a weakening upward drive. A minor pullback may be needed before the next leg up. Key nearby resistance levels to watch are 3330 and 3342.
🎯 Key Price Levels & Validation Zones
The following support zones are crucial for identifying potential entries:
Support Zone 1: 3306 – 3308
Support Zone 2: 3294 – 3297
‼️ Important: A break below 3294 would invalidate the current wave structure, and a new count would be required.
📌 Trade Plan
Scenario 1 – Buy at higher support:
Buy Zone: 3308 – 3306
SL: 3303
TP1: 3342
TP2: 3366
TP3: 3390
Scenario 2 – Buy at deeper support (if stronger correction occurs):
Buy Zone: 3297 – 3294
SL: 3287
TP1: 3342
TP2: 3366
TP3: 3390
Scenario 3 – Safer option (breakout confirmation):
Wait for a breakout above the triangle, then enter on the retest (around 3325–3330)
SL: Based on structure formed during the retest
TP range: 3366 – 3390
📌 Preferred strategy: Wait for H4 to reach oversold or wait for a confirmed breakout and retest to enter safely in alignment with the new uptrend.
CFDGOLD trade ideas
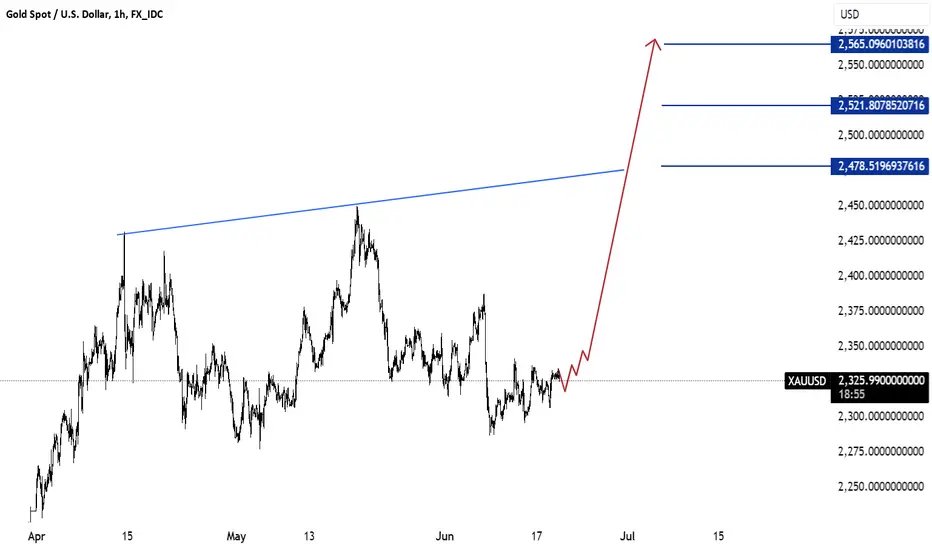
xauusdGold is currently trading at 2325.45 and appears bullish. I suggest considering a buy if it breaks above the range of 2318 to 2325. This recommendation is based on technical indicators showing strength in the current price action.
The potential upside targets are 2370, 2480, 2521, and potentially 2550 levels. These targets are supported by recent price movements indicating momentum towards higher levels.
Live Trade On Gold Im currently holding this position my entry is 3322.14 looking for price to hit 3330.00 or potentially continue to 3340.00 looking for a push London open

July 10, 2025 - XAUUSD GOLD Analysis and Potential Opportunity🔍 Key Levels to Watch:
• 3375 – Resistance
• 3365 – Resistance
• 3350 – Midpoint resistance
• 3345 – Resistance
• 3330 – Key resistance
• 3322 – Intraday key resistance
• 3315 – Support
• 3307 – Intraday key support
• 3300 – Psychological level
• 3295 – Support
• 3285 – Key support
• 3275 – Support
📈 Intraday Strategy:
• SELL if price breaks below 3315 → watch 3310, then 3307, 3300, 3295
• BUY if price holds above 3322 → watch 3330, then 3334, 3337, 3345
👉 If you want to know how I time entries and set stop-losses, hit the like button so I know there’s interest — I may publish a detailed post by the weekend if support continues!
Disclaimer: This is my personal opinion, not financial advice. Always trade with caution and manage your risk.
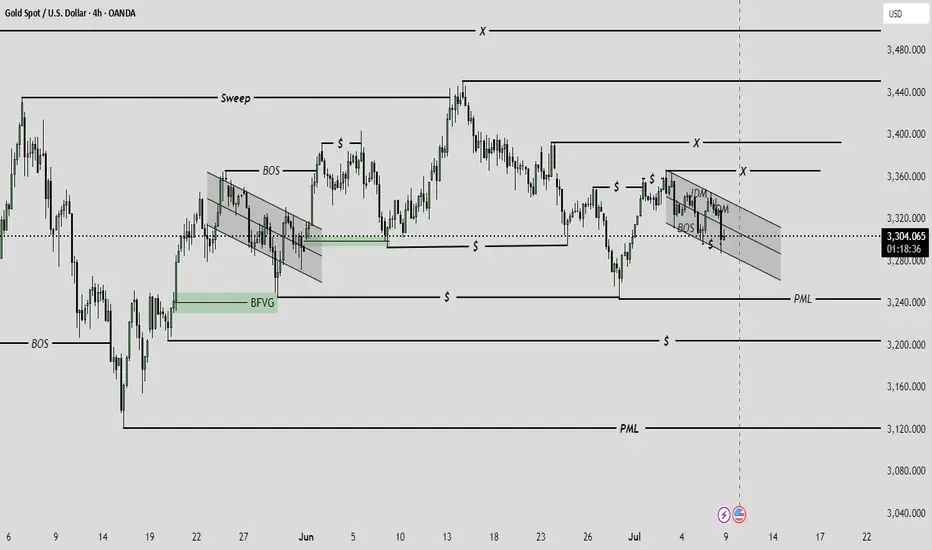
Gold (XAUUSD) H4 (Classic Analysis) - Update 9/7/2025Gold (XAUUSD) H4 (Classic Analysis) - Update 9/7/2025

XAU/USD 09 July 2025 Intraday AnalysisH4 Analysis:
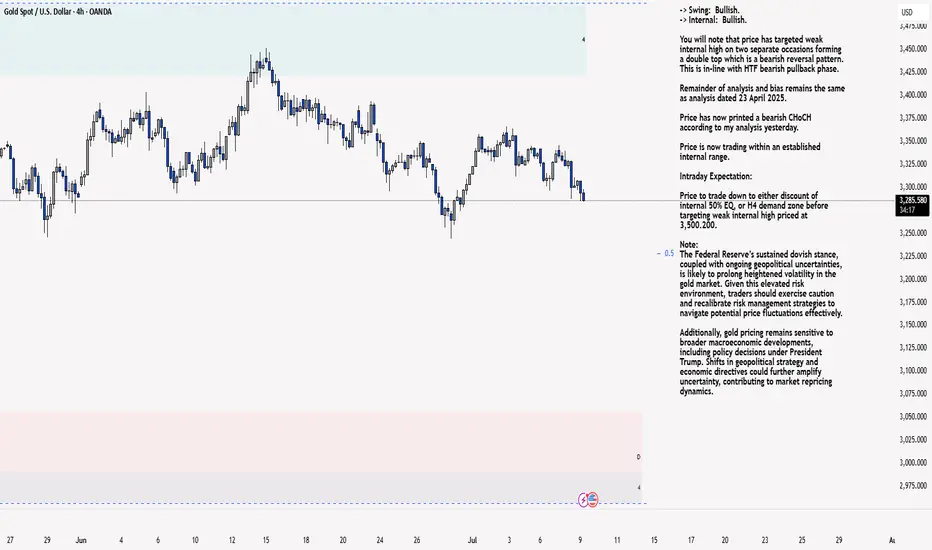
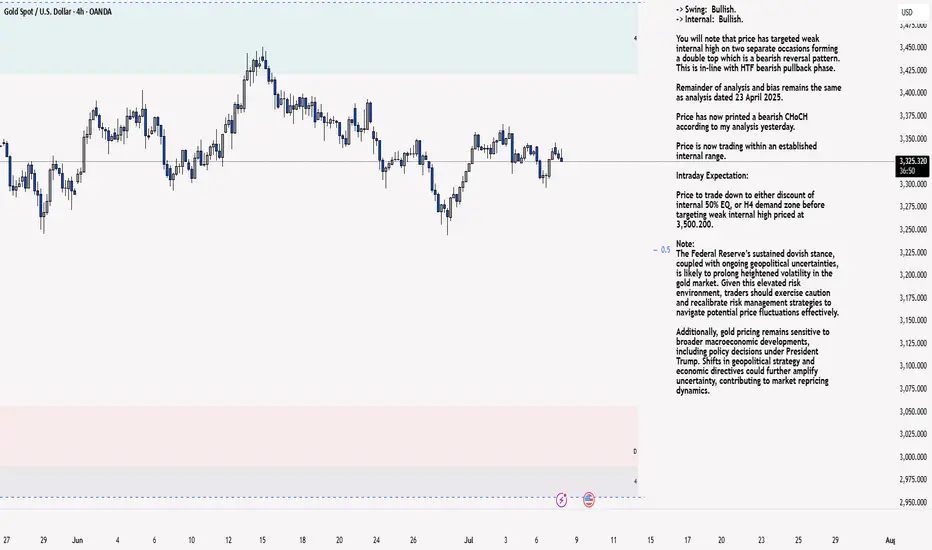
-> Swing: Bullish.
-> Internal: Bullish.
You will note that price has targeted weak internal high on two separate occasions forming a double top which is a bearish reversal pattern. This is in-line with HTF bearish pullback phase.
Remainder of analysis and bias remains the same as analysis dated 23 April 2025.
Price has now printed a bearish CHoCH according to my analysis yesterday.
Price is now trading within an established internal range.
Intraday Expectation:
Price to trade down to either discount of internal 50% EQ, or H4 demand zone before targeting weak internal high priced at 3,500.200.
Note:
The Federal Reserve’s sustained dovish stance, coupled with ongoing geopolitical uncertainties, is likely to prolong heightened volatility in the gold market. Given this elevated risk environment, traders should exercise caution and recalibrate risk management strategies to navigate potential price fluctuations effectively.
Additionally, gold pricing remains sensitive to broader macroeconomic developments, including policy decisions under President Trump. Shifts in geopolitical strategy and economic directives could further amplify uncertainty, contributing to market repricing dynamics.
H4 Chart:
M15 Analysis:
-> Swing: Bullish.
-> Internal: Bullish.
H4 Timeframe - Price has failed to target weak internal high, therefore, it would not be unrealistic if price printed a bearish iBOS.
The remainder of my analysis shall remain the same as analysis dated 13 June 2025, apart from target price.
As per my analysis dated 22 May 2025 whereby I mentioned price can be seen to be reacting at discount of 50% EQ on H4 timeframe, therefore, it is a viable alternative that price could potentially print a bullish iBOS on M15 timeframe despite internal structure being bearish.
Price has printed a bullish iBOS followed by a bearish CHoCH, which indicates, but does not confirm, bearish pullback phase initiation. I will however continue to monitor, with respect to depth of pullback.
Intraday Expectation:
Price to continue bearish, react at either M15 supply zone, or discount of 50% internal EQ before targeting weak internal high priced at 3,451.375.
Note:
Gold remains highly volatile amid the Federal Reserve's continued dovish stance, persistent and escalating geopolitical uncertainties. Traders should implement robust risk management strategies and remain vigilant, as price swings may become more pronounced in this elevated volatility environment.
Additionally, President Trump’s recent tariff announcements are expected to further amplify market turbulence, potentially triggering sharp price fluctuations and whipsaws.
M15 Chart:
Plan for Daytrader 09.07.2025Wait for PA at resistance to sell, and at support to buy.
London session could be 1-2 rr
New York session market could be 2-3rr
*not financial advice - just sharing my thoughts. Make sure you manage your risk on every trad.
xauusd analysiswe are expecting #fomc today and this is my entry plan/idea on xauusd with respect to the zone and the major trend. lets see how will gold playout after London open.
Gold long term analysis #xauusd it is obvious that gold is pushing down side as we have close monthly bearish, and it working in channel which is reputed in past time
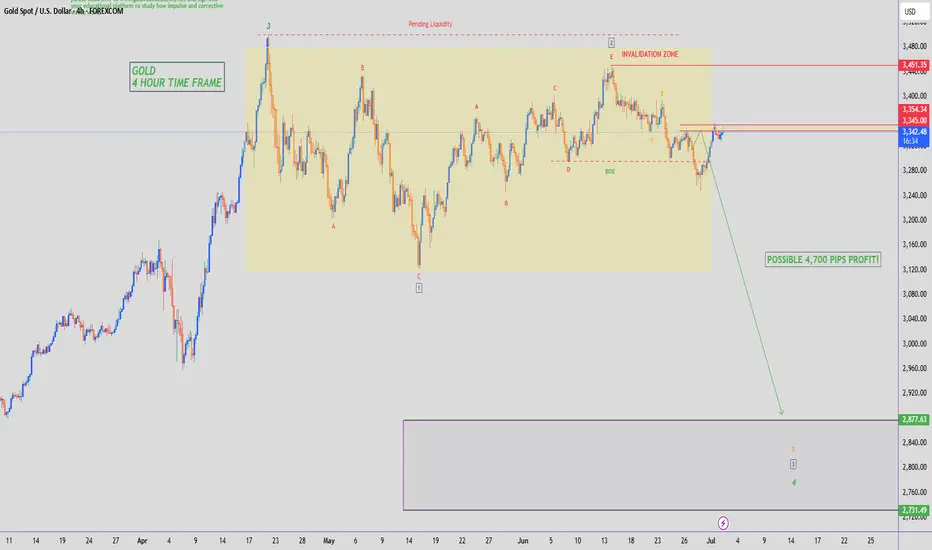
GOLD - SHORT TO $2,800 (UPDATE)Another beautiful, bearish rejection from our resistance zone on Gold. Our 1st resistance zone of $3,350 is still holding.
If buyers take out this level, another zone to watch out for is the $4,006 - $4,022 zone as there is a lot of pending liquidity sitting around that zone.
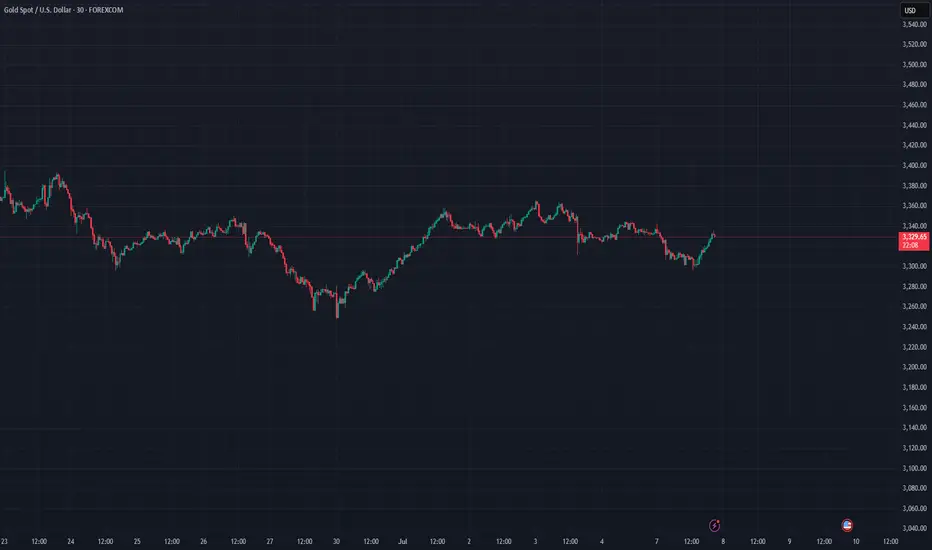
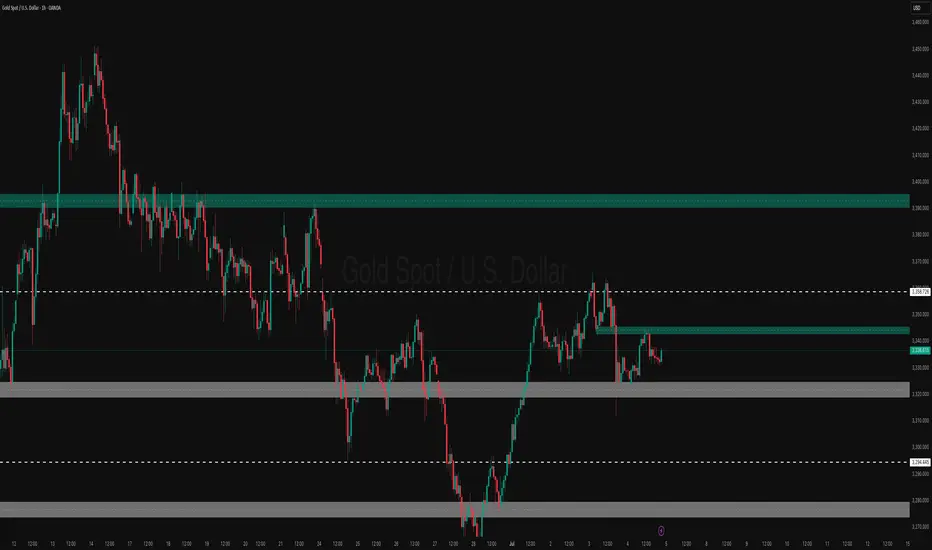
Gold Spot / U.S. Dollar (XAUUSD) 4-Hour Chart - OANDA4-hour chart from OANDA displays the price movement of Gold Spot (XAUUSD) against the U.S. Dollar. The current price is $3,805.780, reflecting a decrease of $30.660 (-0.92%). Key levels include a sell price of $3,305.390 and a buy price of $3,305.940. The chart highlights recent volatility with a shaded area indicating a potential support or resistance zone around $3,344.320. The time frame spans from late June to early July 2025, with the latest data point at 02:41:15 on July 8, 2025.
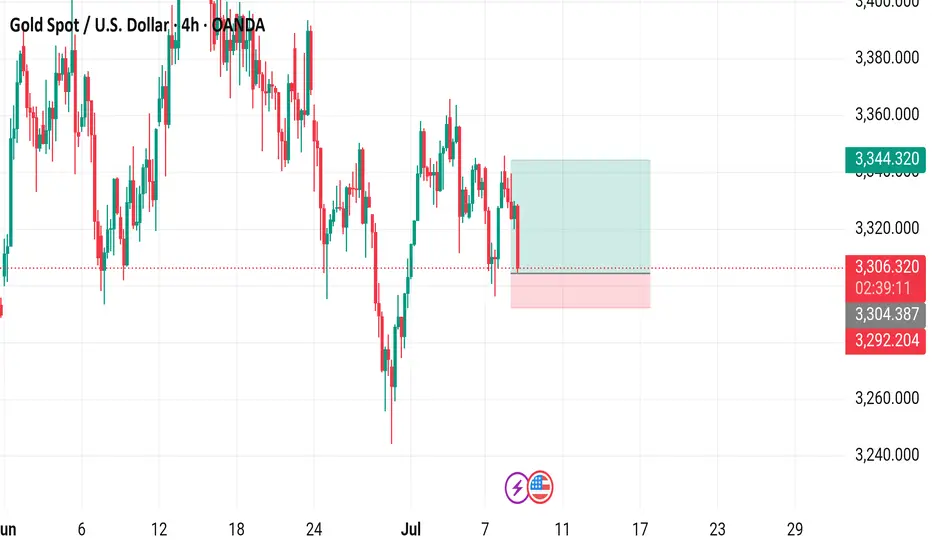
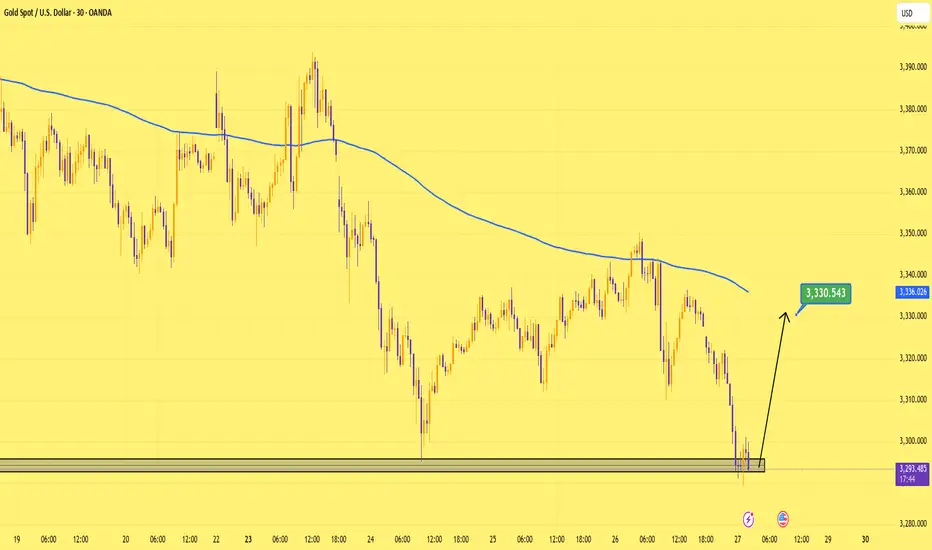
Gold at 3330… I’ll take that bet.Price tapped into demand with multiple rejections.
Targeting 3,330. Clean setup, clear risk. Let’s see if the bulls got something left.
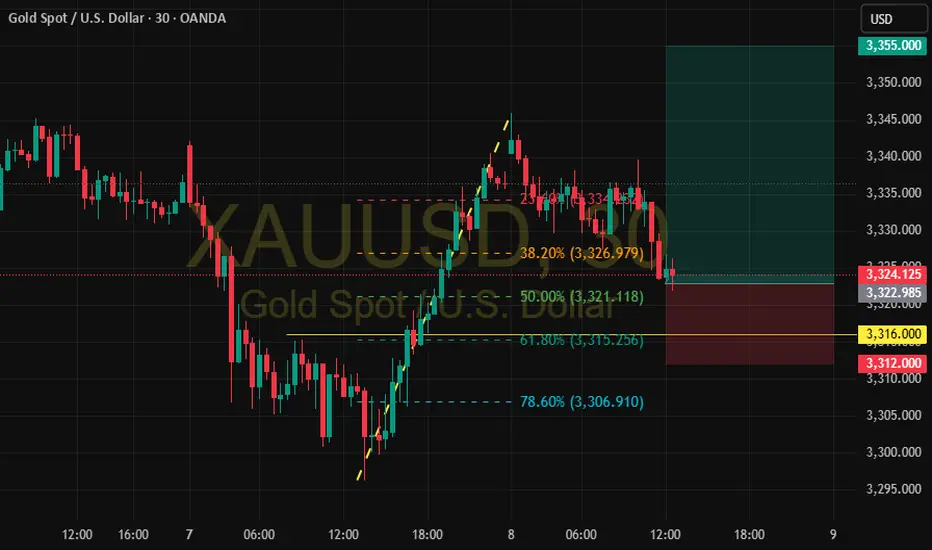
XAU/USD – Watching Fibonacci Retracement Levels for Potential LoAfter a strong bullish impulse from the 3,297 zone to the 3,347 high, gold is currently undergoing a technical pullback.
🔍 **Key Levels to Watch:**
* 📉 38.2% Fib: **3,327**
* ⚖️ 50% Fib: **3,321** (Current area of interest)
* 🛡️ 61.8% Fib: **3,315** – strong potential support zone
The price is now testing the 50% level. If bullish confirmation (e.g. bullish engulfing or breakout candle) appears around the **3,321–3,315** zone, this may present a **high-probability long opportunity**.
🎯 **Trade Idea:**
* **Entry Zone:** 3,321 – 3,315
* **Stop Loss:** Below 3,312
* **Target 1:** Retest of 3,347
* **Target 2:** Extension toward 3,355
⚠️ **Invalidation:** A clear break below 3,312 could open the door for deeper retracement toward the 78.6% level at 3,306.
XAU/USD 08 June 2025 Intraday AnalysisH4 Analysis:
-> Swing: Bullish.
-> Internal: Bullish.
You will note that price has targeted weak internal high on two separate occasions forming a double top which is a bearish reversal pattern. This is in-line with HTF bearish pullback phase.
Remainder of analysis and bias remains the same as analysis dated 23 April 2025.
Price has now printed a bearish CHoCH according to my analysis yesterday.
Price is now trading within an established internal range.
Intraday Expectation:
Price to trade down to either discount of internal 50% EQ, or H4 demand zone before targeting weak internal high priced at 3,500.200.
Note:
The Federal Reserve’s sustained dovish stance, coupled with ongoing geopolitical uncertainties, is likely to prolong heightened volatility in the gold market. Given this elevated risk environment, traders should exercise caution and recalibrate risk management strategies to navigate potential price fluctuations effectively.
Additionally, gold pricing remains sensitive to broader macroeconomic developments, including policy decisions under President Trump. Shifts in geopolitical strategy and economic directives could further amplify uncertainty, contributing to market repricing dynamics.
H4 Chart:
M15 Analysis:
-> Swing: Bullish.
-> Internal: Bullish.
H4 Timeframe - Price has failed to target weak internal high, therefore, it would not be unrealistic if price printed a bearish iBOS.
The remainder of my analysis shall remain the same as analysis dated 13 June 2025, apart from target price.
As per my analysis dated 22 May 2025 whereby I mentioned price can be seen to be reacting at discount of 50% EQ on H4 timeframe, therefore, it is a viable alternative that price could potentially print a bullish iBOS on M15 timeframe despite internal structure being bearish.
Price has printed a bullish iBOS followed by a bearish CHoCH, which indicates, but does not confirm, bearish pullback phase initiation. I will however continue to monitor, with respect to depth of pullback.
Intraday Expectation:
Price to continue bearish, react at either M15 supply zone, or discount of 50% internal EQ before targeting weak internal high priced at 3,451.375.
Note:
Gold remains highly volatile amid the Federal Reserve's continued dovish stance, persistent and escalating geopolitical uncertainties. Traders should implement robust risk management strategies and remain vigilant, as price swings may become more pronounced in this elevated volatility environment.
Additionally, President Trump’s recent tariff announcements are expected to further amplify market turbulence, potentially triggering sharp price fluctuations and whipsaws.
M15 Chart:
Demand Zones | Break of Structure | Targeting Liquidity Above
✅ Bullish Structure:
Price is forming higher lows, confirming a bullish internal structure after sweeping the lower demand zone.
🟦 Key Demand Zones:
First Demand Zone: 3,320 – 3,330 (short-term mitigation zone)
Second Demand Zone: 3,260 – 3,280 (HTF imbalance + liquidity sweep)
📌 Internal Break of Structure (iBOS):
Recent bullish reaction from 3,260 demand created an iBOS above minor highs.
Signals accumulation and smart money re-entry.
🔵 Target:
3,447.97 – buy-side liquidity resting above swing highs.
---
🎯 Trade Setup:
Buy Entry (Confirmed): 3,325–3,330
Stop Loss: 3,315
Take Profit: 3,447
Report - 7 jully, 2025China’s Export Rerouting: A Strategic Response to US Tariffs
China has aggressively shifted its export strategy to circumvent the steep tariff wall erected by President Trump as part of his ongoing trade war. Recent data from the US Census Bureau shows that Chinese exports directly to the US dropped by 43% year-on-year in May, equivalent to a $15 billion decline.
However, China’s overall exports still rose by 4.8% in the same period, indicating successful reallocation of trade flows. This was achieved through a 15% increase in exports to the ASEAN bloc and a 12% increase to the EU. By rerouting products through Southeast Asia, China is effectively sidestepping US tariffs, echoing tactics seen during the initial phase of the US-China trade war under Trump's first term.
Southeast Asia as a Transshipment Hub
Vietnam and Indonesia have emerged as key transit hubs. According to Capital Economics, an estimated $3.4 billion worth of Chinese goods were rerouted via Vietnam in May — a 30% increase from the previous year. Indirect trade through Indonesia also rose sharply to $800 million, up 25% year-on-year.
Chinese exports of electronic components to Vietnam surged, including printed circuits, telephone set parts, and display modules, which alone rose by $2.6 billion, or 54% compared to May 2024. This strategic pivot underlines China’s adaptability and Southeast Asia's growing role in global supply chain realignments.
US Policy Response and Warnings
US Treasury Secretary Scott Bessent has warned that unless trade partners finalize deals with Washington, tariffs will "boomerang" back to their steep April levels starting August 1. The 90-day tariff pause, which initially calmed markets, is set to end imminently.
So far, Trump has secured only three trade agreements — with the UK, China, and Vietnam. Vietnam’s deal notably includes a punitive 40% levy on goods transshipped through its territory, specifically targeting Chinese re-exports. This demonstrates the US administration's determination to close loopholes and deter indirect circumvention of tariffs.
Implications for Trade Partners and Global Markets
Other major US trading partners, including the EU, Japan, and South Korea, remain in limbo, facing potential tariff hikes. The uncertainty has reintroduced volatility into trade-dependent markets. US officials anticipate a flurry of last-minute negotiations, but the threat of broad tariff reimposition looms large.
Trump’s approach, characterized by abrupt policy swings and negotiation brinkmanship, has already forced US allies and adversaries alike to reconsider supply chain configurations. The potential return of high tariffs risks reigniting concerns over inflation and global growth that initially triggered financial market sell-offs earlier in the year.
Financial Market Dynamics
Trump’s tariff pause had stabilized US equities and bond markets after an initial sharp downturn. However, the risk of renewed tariffs could reverse these gains, particularly if trade tensions escalate further. Investors are watching closely for any last-minute deals that might avert additional supply chain disruptions and support risk sentiment.
Meanwhile, China’s ability to maintain overall export growth despite US measures signals resilience and reinforces the importance of diversified trade relationships. For global investors, this suggests continued strength in ASEAN manufacturing and logistics sectors, as well as ongoing demand for regional infrastructure development to handle redirected trade flows.
Broader Geopolitical and Strategic Context
The rerouting highlights China’s tactical approach to trade pressure while deepening its economic ties with neighboring Southeast Asian nations. This strategy aligns with Beijing’s broader goal of strengthening its influence in ASEAN and hedging against Western economic decoupling efforts.
In parallel, the US is doubling down on "economic nationalism," threatening high tariffs unless trade partners make concessions. This could push more countries toward regional trade alliances, bypassing direct US channels and potentially undermining American market leverage over time.
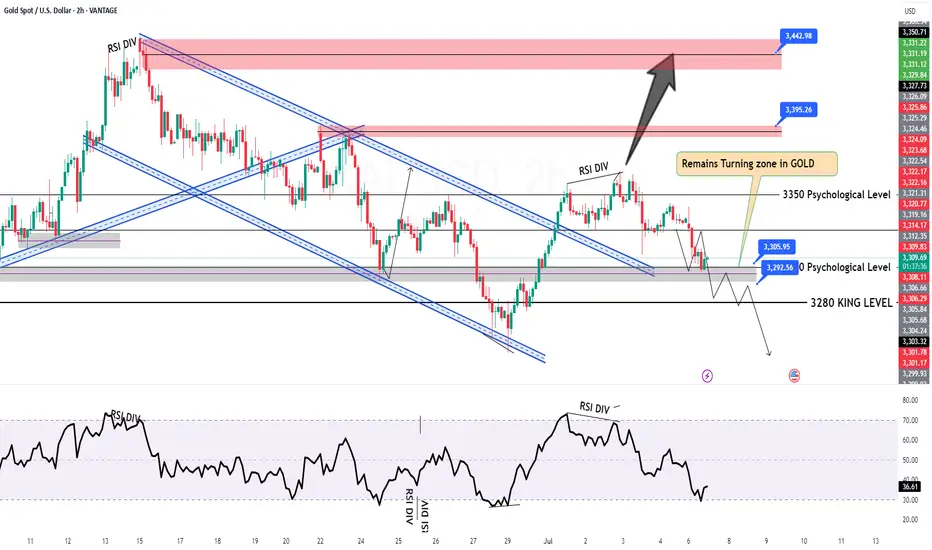
GOLD H2 Intraday Chart Update For 7 July 2025Welcome to the new week traders
as we have FOMC meeting minutes report due this week so firs market is fell down from 3350 Psychological level now is testing 3300 psychological level
all eyes on breakout of 3300 level for now if market breaks 3300 level then it will move towards 3280 then 3350
only clear breakout of 3335 will clear path for towards 3368 level
Disclaimer: Forex is Risky
GOLD CONFIRM TRADE🔍 Chart Analysis Summary:
Current Price: ~3,336
Key Resistance (Supply Zone): 3,340 – 3,353
Major Resistance Above: 3,388 – 3,395
Key Support (Demand Zone): 3,320 – 3,330
Major Support Below: 3,294 – 3,305
⚔️ Trade Setup Ideas:
📉 Sell Setup (High Probability Intraday Short)
Scenario: Price is near the lower supply zone (3,340–3,353), showing rejection.
Entry: 3,340 – 3,345 (on bearish candle confirmation or rejection wick)
Stop Loss: Above 3,353 (zone high or recent swing high)
Take Profit Targets:
TP1: 3,330 (first minor support)
TP2: 3,320 (demand zone)
TP3: 3,295 (major support)
📌 Confirmation Tips:
Look for bearish engulfing / rejection candles
RSI divergence or weakness
Break of 3,330 support confirms continuation
📈 Buy Setup (If Price Drops to Demand)
Scenario: Price drops back into demand zone 3,320–3,330 with bullish reaction.
Entry: 3,322 – 3,328 (bullish wick or engulfing candle)
Stop Loss: Below 3,320
Take Profit Targets:
TP1: 3,340
TP2: 3,353 (supply)
TP3: 3,388 (major resistance)
📌 Confirmation Tips:
Bullish price action near 3,322 zone
Momentum buildup from demand
Use M15/M30 for refined entry
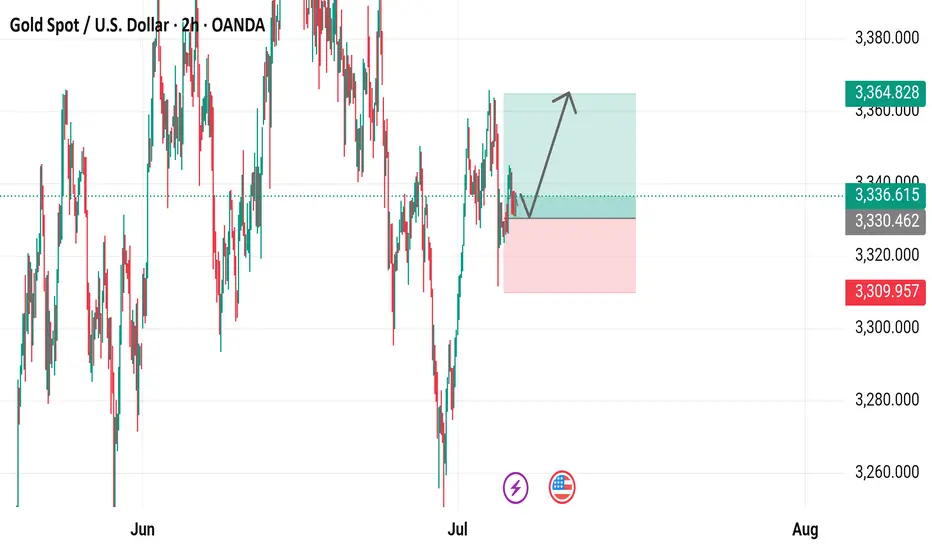
Gold Spot / U.S. Dollar (XAUUSD) 2-Hour Chart2-hour chart from OANDA displays the recent price movement of Gold Spot (XAUUSD) against the U.S. Dollar. The current price is $3,336.615, up by $10.585 (+0.32%). The chart highlights a recent upward trend with a buy signal at $3,336.970 and a sell signal at $3,336.260. Key price levels include a resistance zone around $3,364.828 and a support zone near $3,309.957, with the price showing a potential breakout above the recent consolidation range.
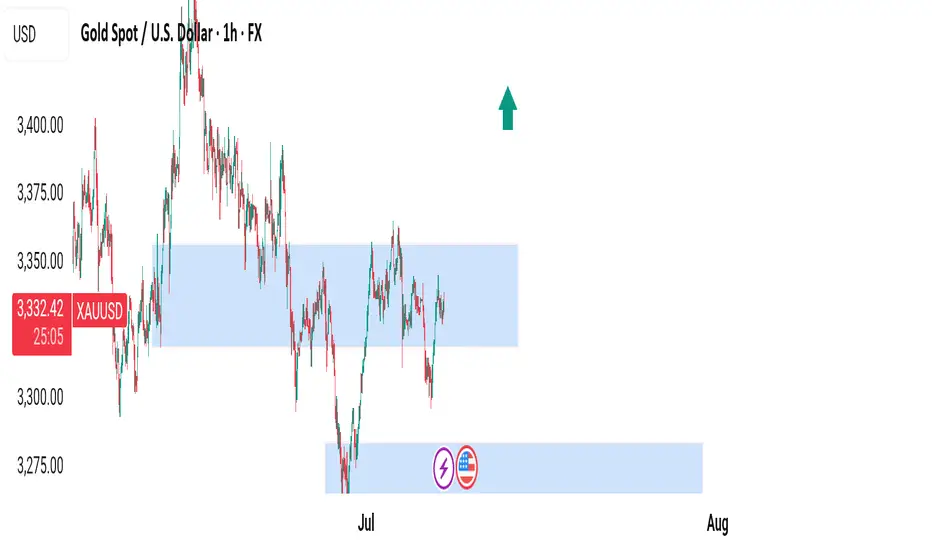
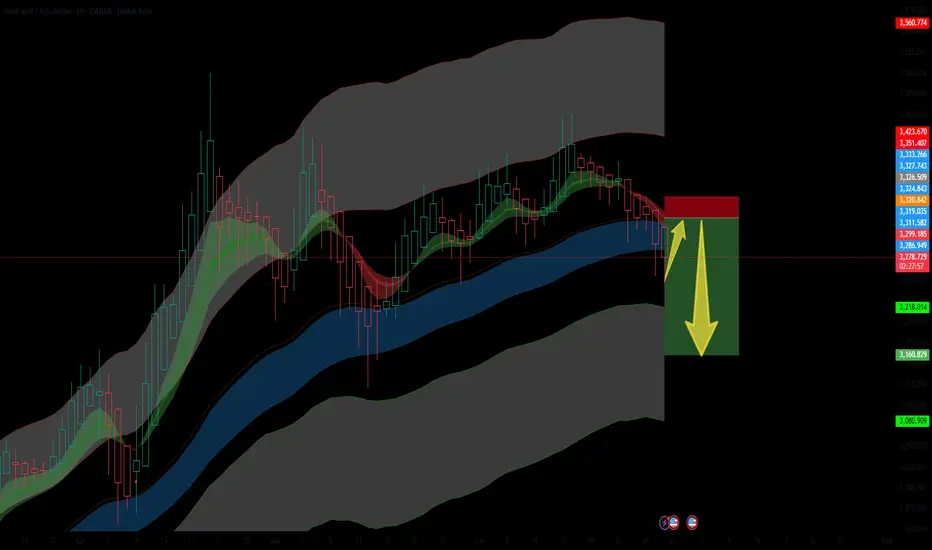
Bearish Setup for GoldGold is currently in a retracement phase after breaking below the mid Keltner channel zone. The small upward arrow marks this temporary relief rally, which I anticipate will be short-lived.
Price is testing the lower band of the inner Keltner channel after rejecting from the upper zones. The structure suggests a classic lower high formation before a potential major sell-off, targeting the deeper liquidity zones around $3,218 – $3,160 and possibly $3,080 if momentum accelerates.
📉 Bias: Bearish
📌 Invalidation: A clean break and close above the red resistance block (~$3,320+)
📌 Target Zones: $3,218 → $3,160 → $3,080
🔔 Look for volume drop and wick exhaustion confirming the next leg down.
This retracement may offer one final short entry opportunity before a deeper correction unfolds.
current Gold position live gold Break down all targets set looking to day trade and hold over the span of a day

Gold is bearish again.Next week I guess strong bearish rejection on gold. My expectation target is below 3100$ to pick up the liquidity before the next bull run regarding the fact of coming decreasing of interest rates.