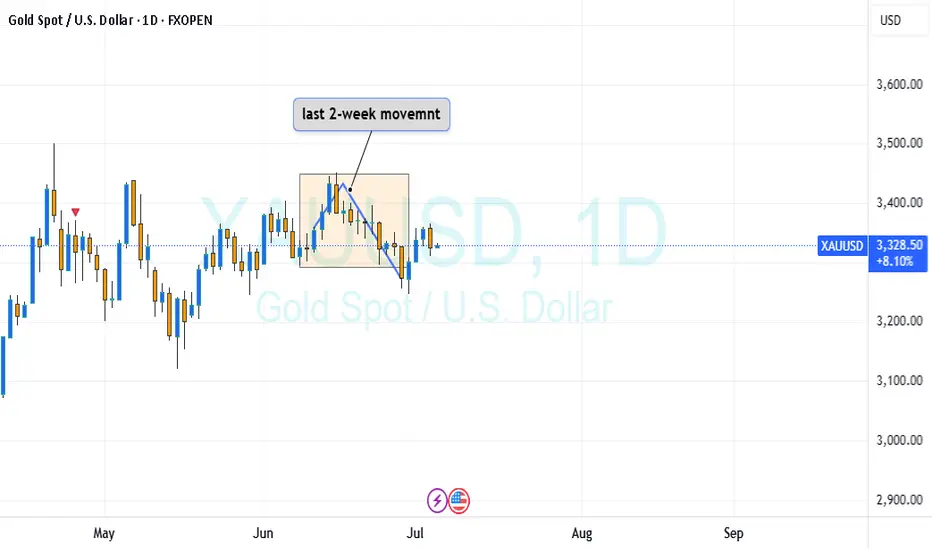
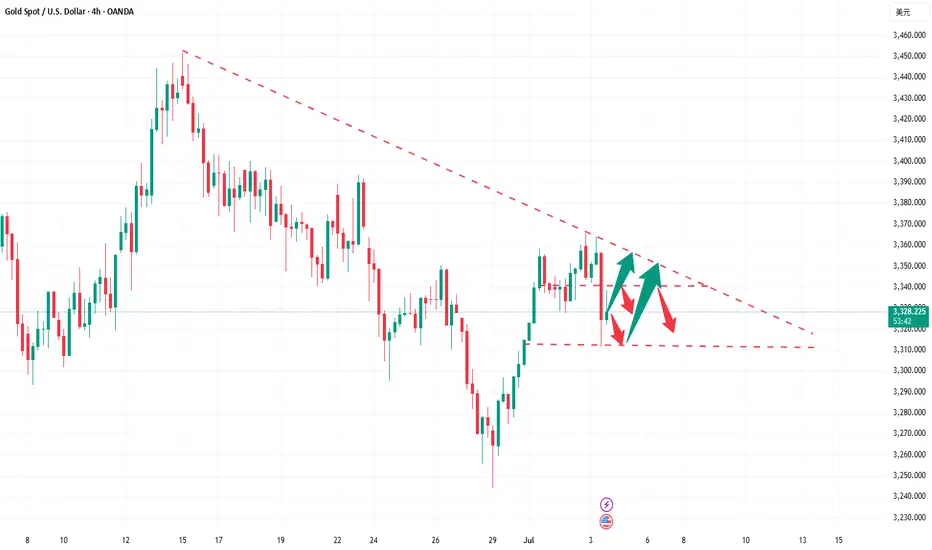
Gold Trading Strategy July 3✏️D1 candle continues to increase towards the price gap zone. At the beginning of the European session, sellers accept to enter the market at this resistance price zone around 3365. The accumulation pattern of gold price is forming a triangle pattern.
The lower boundary is broken, it will lead to the breakout point of the lower boundary and vice versa, if the upper boundary of the triangle is broken, the price will move towards the next resistance.
📉 Key Levels
Resistance: 3388-3363
Support: 3330-3311-3297-3277
Buy trigger: breakout above 3363
Sell trigger: breakout below 3330
If this idea resonates with you or you have other ideas, please comment. I look forward to reading your thoughts!
Best regards, VHT Traders!
CFDGOLD trade ideas
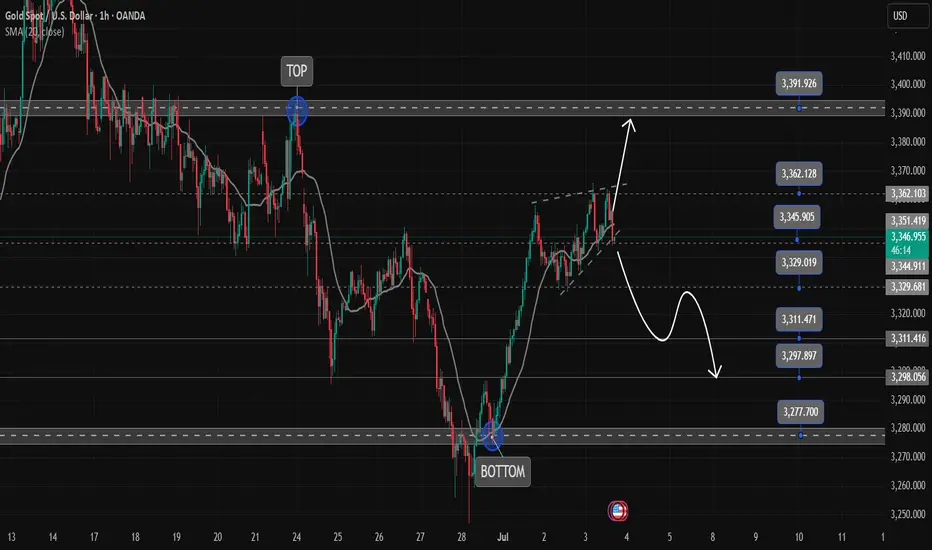
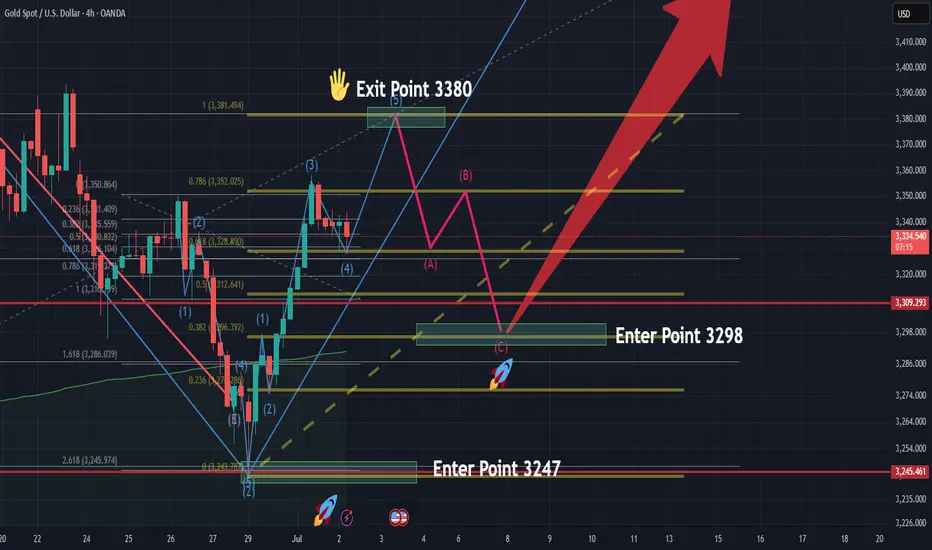
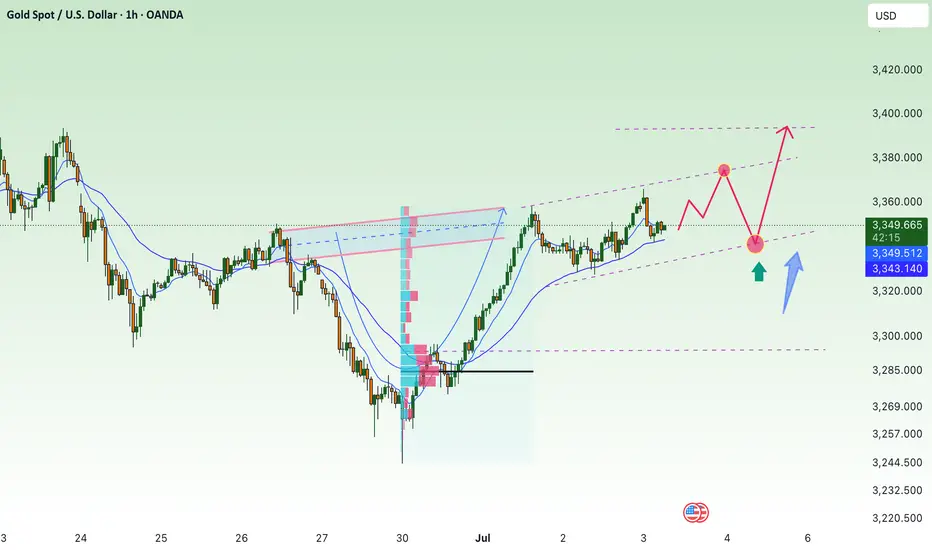
Riding Wave (5) Toward 3380 Before ABC Correction📌 Market Context
The current chart shows wave (5) of a larger impulsive structure is still in progress, with price rising from the bottom of wave (4). After a clean wave (1)-(2)-(3)-(4), the market is now pushing upward, targeting the 3380 zone as a likely wave (5) completion.
🟢 Entry Levels (End of Wave 2)
First Entry: 3298
Second Entry: 3279.6
Gold price trend forecast on July 8Gold price trend forecast on July 8
As of July 6, 2025, the international gold price fluctuates in the range of 3250-3350.
Affected by multiple factors, market sentiment is obviously divided.
The following are the key points and forecasts for next week's trend:
(1): Divergence in interest rate cut expectations: The probability of a rate cut in September has dropped to 47%.
(2): Weaker US dollar index: If the Fed postpones the rate cut, the US dollar may rebound in the short term, suppressing gold prices.
(3): Geopolitical risks: The situation in the Middle East has eased, and gold prices may fall due to safe-haven demand.
Russia-Ukraine conflict: If the ceasefire negotiations make progress, the safe-haven premium of gold may further subside.
(4): Central bank gold purchases and market supply and demand
Global central banks continue to increase their holdings: In the first quarter of 2025, global central banks net purchased 289 tons of gold, but the People's Bank of China has suspended its purchases for two consecutive months. The market is paying attention to subsequent trends.
Gold ETF fund outflow: SPDR Gold Trust holdings fell to 942 tons (the lowest since November 2024), indicating the withdrawal of short-term speculative funds.
(5) Technical analysis
Key support level: US$3,310. If it falls below, it may fall to US$3,280.
Resistance level: US$3,360. A new round of gains can only be confirmed if it breaks through US$3,400.
4. Investment advice
Short-term trading: Pay attention to the breakthrough of the US$3,300-3,350 range and adopt a high-sell-low-buy strategy.
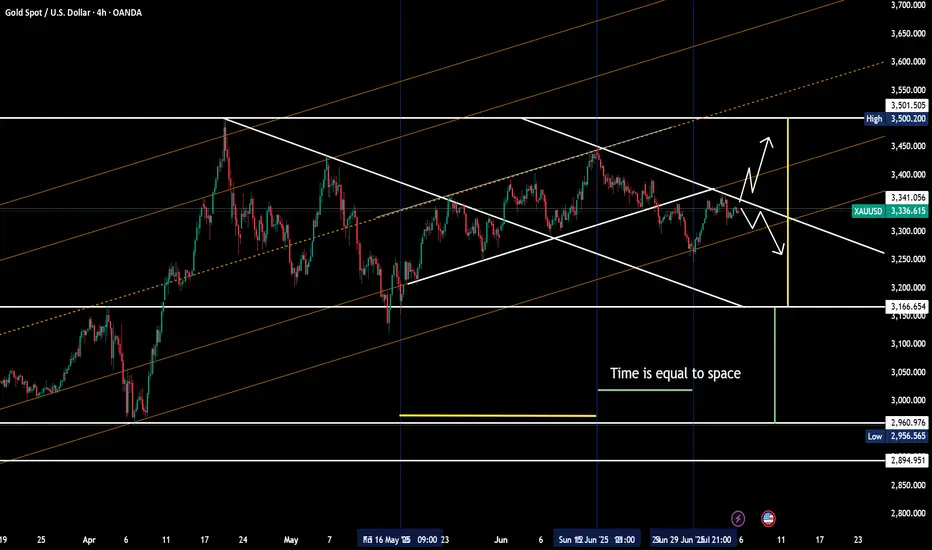
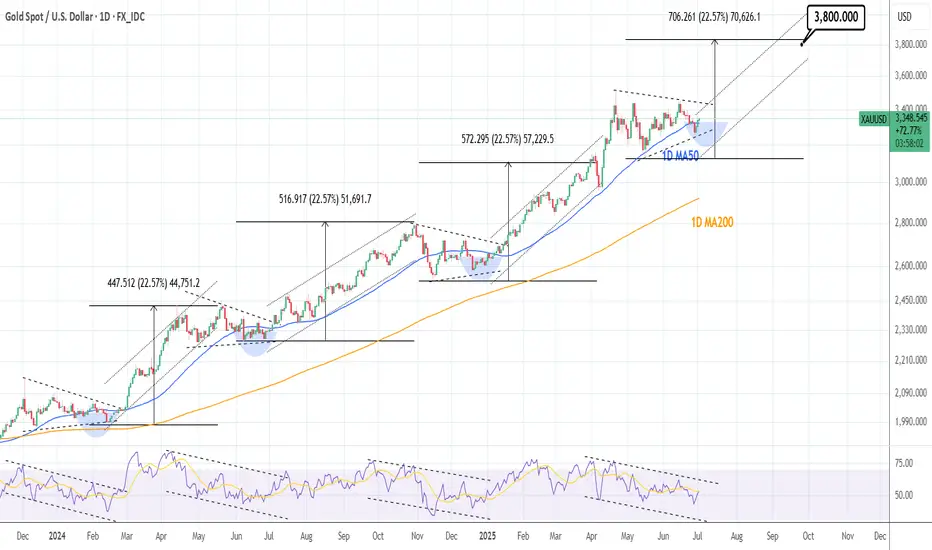
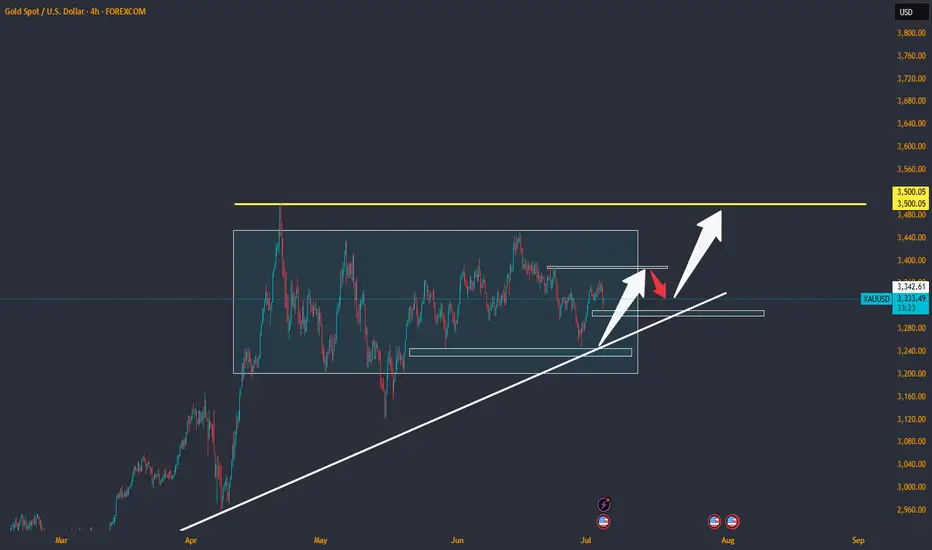
XAUUSD: Eyes $3,800 based on this 2 year pattern.Gold turned neutral again on its 1D technical outlook (RSI = 52.131, MACD = 4.646, ADX = 13.719) as after last week's selling, it recovered yesterday its 1D MA50, restoring the bullish trend. The long term trend has been extremely bullish after all and the past 2 months have simply been a consolidation stage through a Triangle pattern that worked as accumulation for the next bullish wave. On this 2 year pattern, typical waves rose by at least +22.57%. Once the 1D MA50 turns into a support again, we anticipate that a new Channel Up will push Gold to a TP = 3,800.
See how our prior idea has worked out:
## If you like our free content follow our profile to get more daily ideas. ##
## Comments and likes are greatly appreciated. ##
GOLD. Why is Gold Rising Again?The yellow metal is one again receiving support driven by two main factors. The first is the continued risk of failure in the negotiations between Tehran and Tel Aviv. The second is related to the chronic weakness of the U.S. dollar amid the American economy slipping into a recession, which may persist for a prolonged period, and the uncertainty surrounding the future global impact of Donald Trump's customs tariff policy.
From a technical perspective, gold prices continue to be in a long-term upward trend. The bullish momentum, driven by the aforementioned reasons, may continue after breaking and consolidating above the 3340 level.
Technical Outlook and Trading Idea:
The price is trading above the middle line of the Bollinger Bands, as well as above the 5-and 14-period SMAs , which have crossed and are giving a buy signal. The RSI is crossing the 50% mark, also indicating a buy. the Stochastic Oscillator is above 50% and continues to rise.
In this situation, I believe gold should be bought, with a potential rise toward 3384. A likely entry point for a buy position could be considered around 3347.
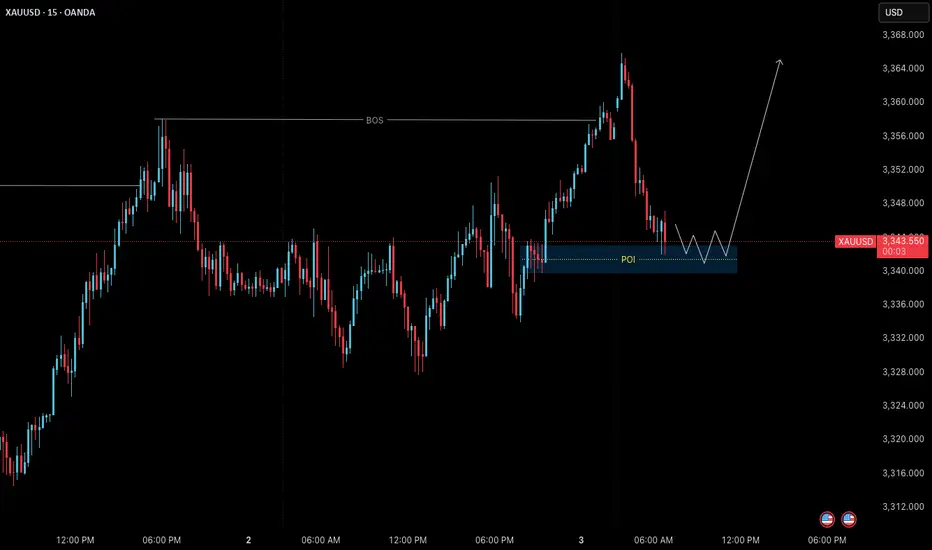
XAUUSD – July 3 Live Setup | Price at M15 POIGold has been moving in line with our bullish bias over the past few sessions.
Yesterday’s break above the 3358 M15 level gave us a clean Break of Structure (BoS) — confirming short-term bullish momentum within the larger framework.
After this strong push upward, the market is now retracing.
Price is currently entering a high-probability pullback zone: 3340–3342 (M15 POI).
This is a textbook base structure setup — where we wait for price to return to a valid zone after structure shift, and only act after confirmation on the lower timeframe.
🔍 Setup in Play:
Current Bias:
• M15 Trend: Bullish
• H4 Context: Bullish (after recent HTF shift)
• Market State: Pullback phase after BoS
Key Zone in Focus:
• 3340–3342 – M15 POI (zone of interest for continuation)
We are not entering blindly .
We are waiting for confirmation on M1 — specifically:
✅ ChoCh (Change of Character)
✅ Followed by a micro BoS
Only then do we consider a long entry — and even then, risk must be managed through proper R:R and structure anchoring.
🎯 Target:
If M1 confirmation occurs, the expected short-term target is 3365 — the next clean M15 structural high.
⚠️ Risk Conditions:
If price breaks below the POI without M1 confirmation — or aggressively violates the zone — the setup is invalid.
In that case, we simply step aside and reassess.
This is process-driven execution:
No need to predict.
No need to chase.
Just observe, confirm, and execute with structure.
📖 This is how we let the chart do the work.
The process protects us.
Structure invites us.
Stillness refines us.
📘 Shared by @ChartIsMirror
Author of The Chart Is The Mirror — a structure-first, mindset-grounded book for traders
GOLD 4H CHART ROUTE MAP UPDATE & TRADING PLAN FOR THE WEEKHey Everyone,
Please see our updated 4h chart levels and targets for the coming week.
We are seeing price play between two weighted levels with a gap above at 3301 and a gap below at 3242. We will need to see ema5 cross and lock on either weighted level to determine the next range.
We will see levels tested side by side until one of the weighted levels break and lock to confirm direction for the next range.
We will keep the above in mind when taking buys from dips. Our updated levels and weighted levels will allow us to track the movement down and then catch bounces up.
We will continue to buy dips using our support levels taking 20 to 40 pips. As stated before each of our level structures give 20 to 40 pip bounces, which is enough for a nice entry and exit. If you back test the levels we shared every week for the past 24 months, you can see how effectively they were used to trade with or against short/mid term swings and trends.
The swing range give bigger bounces then our weighted levels that's the difference between weighted levels and swing ranges.
BULLISH TARGET
3301
EMA5 CROSS AND LOCK ABOVE 3301 WILL OPEN THE FOLLOWING BULLISH TARGETS
3370
EMA5 CROSS AND LOCK ABOVE 3370 WILL OPEN THE FOLLOWING BULLISH TARGET
3429
EMA5 CROSS AND LOCK ABOVE 3429 WILL OPEN THE FOLLOWING BULLISH TARGET
3499
BEARISH TARGETS
3242
EMA5 CROSS AND LOCK BELOW 3242 WILL OPEN THE FOLLOWING BEARISH TARGET
3171
EMA5 CROSS AND LOCK BELOW 3171 WILL OPEN THE SWING RANGE
3089
3171
EMA5 CROSS AND LOCK BELOW 3171 WILL OPEN THE SECONDARY SWING RANGE
3089
3001
As always, we will keep you all updated with regular updates throughout the week and how we manage the active ideas and setups. Thank you all for your likes, comments and follows, we really appreciate it!
Mr Gold
GoldViewFX

How to grasp the key entry opportunity in the gold market?The market is changing rapidly, and going with the trend is the kingly way. When the trend comes, just do it. Don't buy at the bottom against the trend, so as not to suffer. Remember not to act on impulse when trading. The market is good at dealing with all kinds of dissatisfaction, so you must not hold on to orders. I believe many people have experienced this deeply. The more you resist, the more panic you will feel, and your floating losses will continue to magnify. You will not be able to eat or sleep well, and you will miss many opportunities in vain. If you also have these troubles, then you might as well keep up with my pace and try to see if it can make you suddenly enlightened.
The non-agricultural data was unexpectedly cold, with a large negative impact. The stochastic indicator in the daily chart formed a golden cross, which was a main multi-signal. The BOLL range shrank, and the range shrank to 3418-3280. This range is the main range. The price pierced up and down the central axis and hovered, waiting for the news data to stimulate. The upper track of the 4-hour Bollinger band is at $3380, and the integer mark of $3400 is also near the high point of gold prices last week. The 5-day moving average and the MACD indicator cross upward, and the KDJ and RSI indicators cross upward. In the short-term technical aspect, gold has a trend of further rebound. At present, the upper resistance is at 3360-3365, and the support position is around 3310-3300.
Gold operation strategy: It is recommended to go long near 3312-3315, with a target of 3330-3340. It is recommended to go short once it touches 3340 for the first time, with a target of 3320-3310.
XAUUSD Update after NFP July 2025After NFP of July 2025 data released, Gold has a minor drop and it seen to moving upside to continue the major trend.
Still watching a fundamental news such as a geopolitical, war, global economic to drive it move.
Technical support now is on 3310 level.
Good Luck !
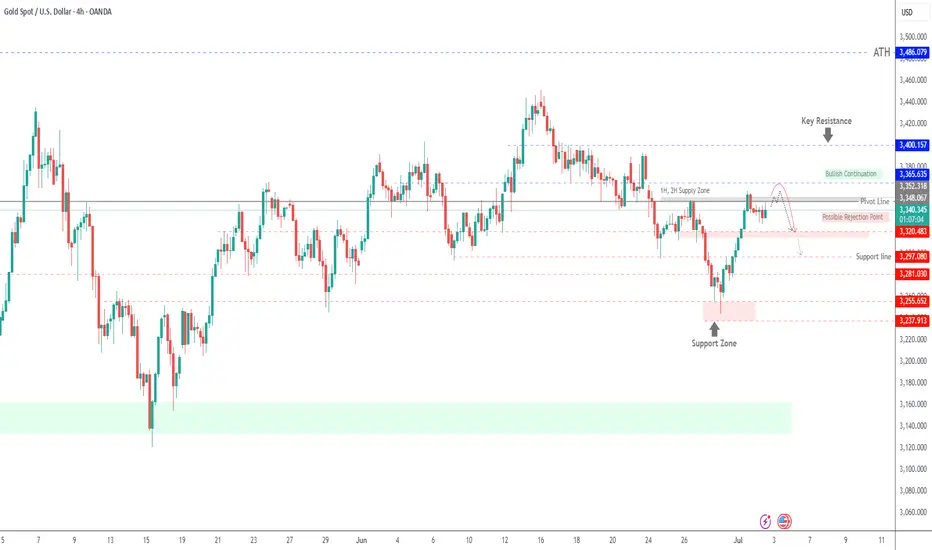
XAU/USD Struggles Below 3352, Bearish Pressure Remains ActiveXAU/USD Below Pivot, Watching 3352 for Bullish Confirmation
Gold prices edged up today as investors shifted their focus to the U.S. fiscal situation and lingering uncertainty ahead of the July 9 deadline when U.S. tariffs are set to take effect. But at the same time, we have strong resistance on the way.
The price continues to move below the pivot level and the 3352 resistance, which together form a strong supply zone.
A confirmed breakout above 3352 on the 4H candle is needed to validate a bullish move toward 3365. However, the possibility of a renewed decline remains unless the price also breaks above 3365, which would confirm a continuation of the upward trend.
The bearish trend remains active as long as the price trades below the pivot at 3348 and the 3352 level. Sustained trading below this zone would likely lead to a decline toward 3320 and 3313.
Key Technical Levels
Resistance: 3352 - 3365 - 3400.
Support Levels: 3320 - 3313 - 3218.
Pivot Line: 3348
Lesson 16: gold/usd 1hr price break-out analysis Quick explanation on how to chart your trades and analyze price break-out of support and resistance.

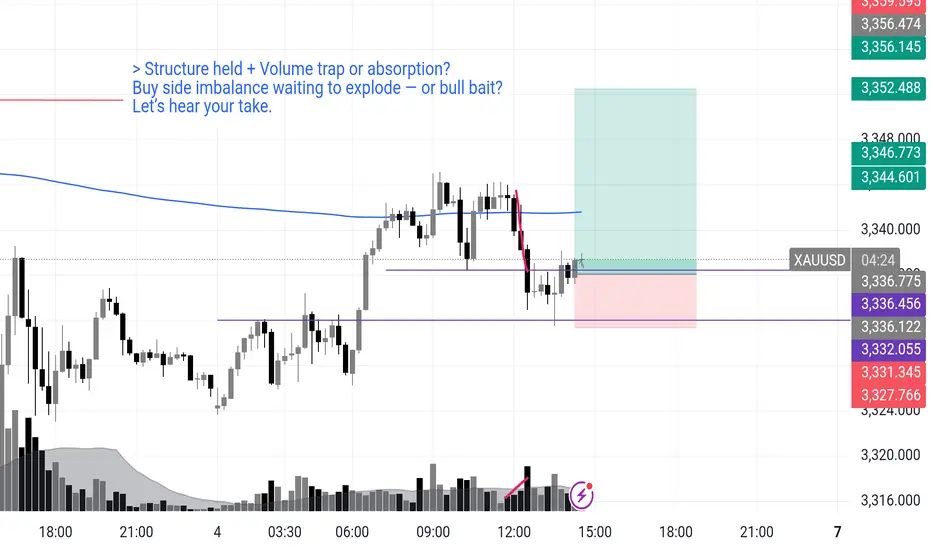
Gold: Smart Money or Trap Money? Long Setup with a twistDescription
> Gold – Long Setup Breakdown
After a clean break to a new Higher High, price pulled back aggressively on volume. A lot of traders will label that red spike as bearish — but let’s unpack what’s really happening.
1. Structure Held
Despite the drop, the move respected the previous demand zone — a classic smart money move to test liquidity before continuation.
2. Volume Spike (Red Candle):
Could be:
A shakeout of late buyers, or
Aggressive shorting that got absorbed just above the key structure.
3. Quick Reclaim + Tight Base:
Price reclaimed the zone fast and started building a tight consolidation just above the reclaimed zone — that’s usually a sign of pre-expansion energy.
4. Buy Stop Cluster Potential:
The current compression hints at stops above being used as fuel for the next impulsive leg.
I'm positioning long here — not because of the breakout, but because of the retest that held above demand with signs of absorption and continuation.
But I want your take:
Is this absorption by smart money or a bull trap?
Would you wait for a second retest, or is this the real deal?
How do you interpret that red volume spike?
Drop your thoughts 👇 Let's build sharper analysis through debate.
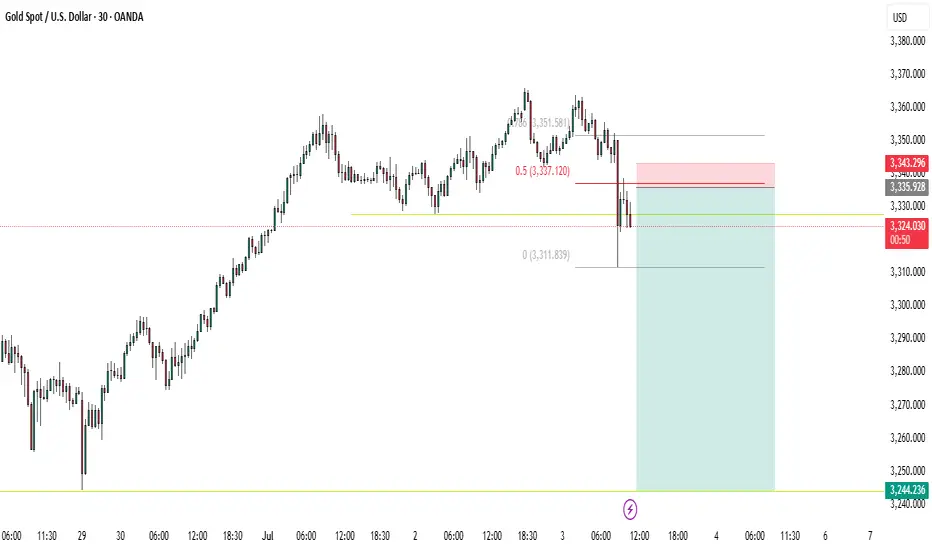
XAUUSDHello traders. After a short break, we’ve identified a promising sell opportunity on the XAUUSD pair.
Despite the U.S. Independence Day holiday, I believe we may still see solid movement in gold during today's session.
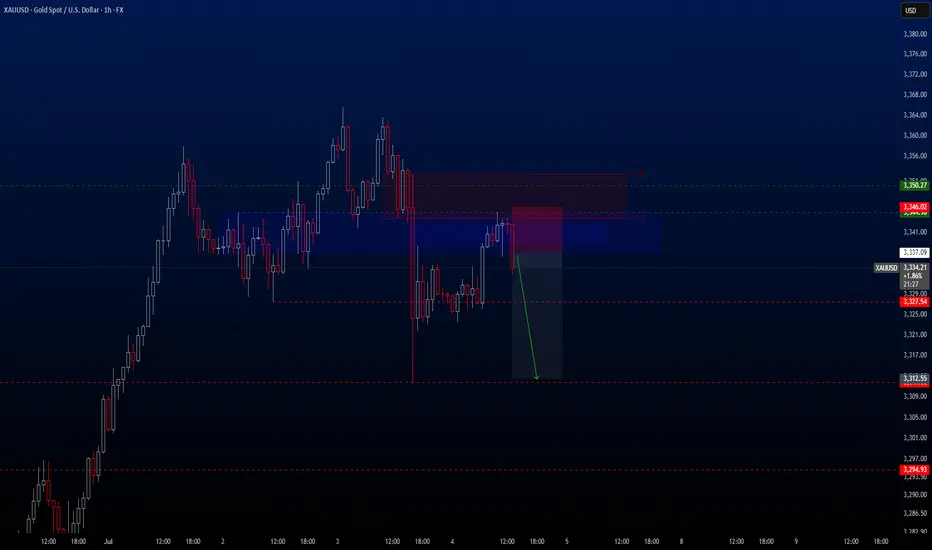
🔍 Trade Details
✔️ Timeframe: 1-Hour (H1)
✔️ Risk-to-Reward Ratio: 1:2.70
✔️ Trade Direction: Sell
✔️ Entry Price: 3337.09
✔️ Take Profit: 3312.16
✔️ Stop Loss: 3345.63
🕒 If momentum fades or the price consolidates in a tight range, I will keep this trade open only until 23:00 (UTC+4). After that, I’ll close it manually—whether in profit or loss—depending on how price action evolves.
🔔 Disclaimer: This is not financial advice. I’m simply sharing a trade I’ve taken based on my personal trading system, strictly for educational and illustrative purposes.
📌 Interested in a systematic, data-driven trading approach?
💡 Follow the page and turn on notifications to stay updated on future trade setups and advanced market insights.
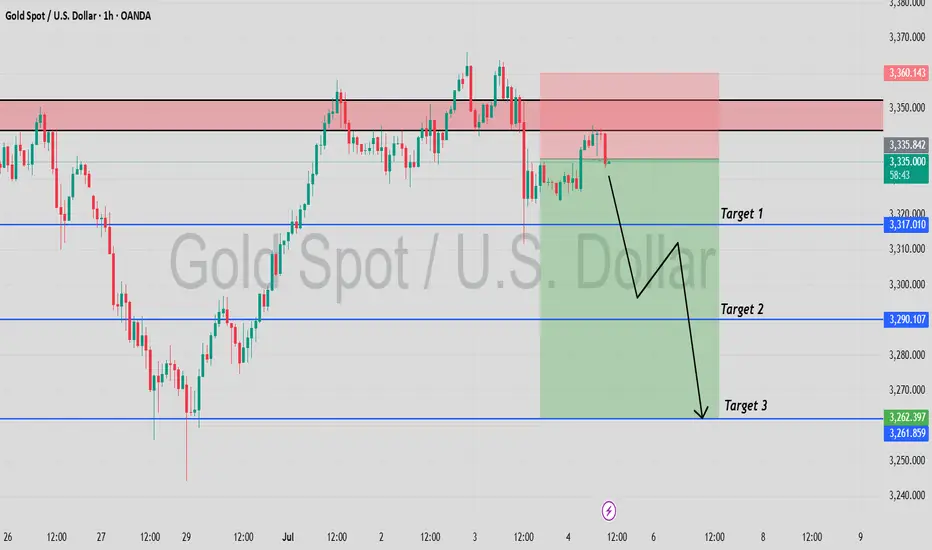
Gold is in the Bearish DirectionHello Traders
In This Chart GOLD HOURLY Forex Forecast By FOREX PLANET
today Gold analysis 👆
🟢This Chart includes_ (GOLD market update)
🟢What is The Next Opportunity on GOLD Market
🟢how to Enter to the Valid Entry With Assurance Profit
This CHART is For Trader's that Want to Improve Their Technical Analysis Skills and Their Trading By Understanding How To Analyze The Market Using Multiple Timeframes and Understanding The Bigger Picture on the Charts
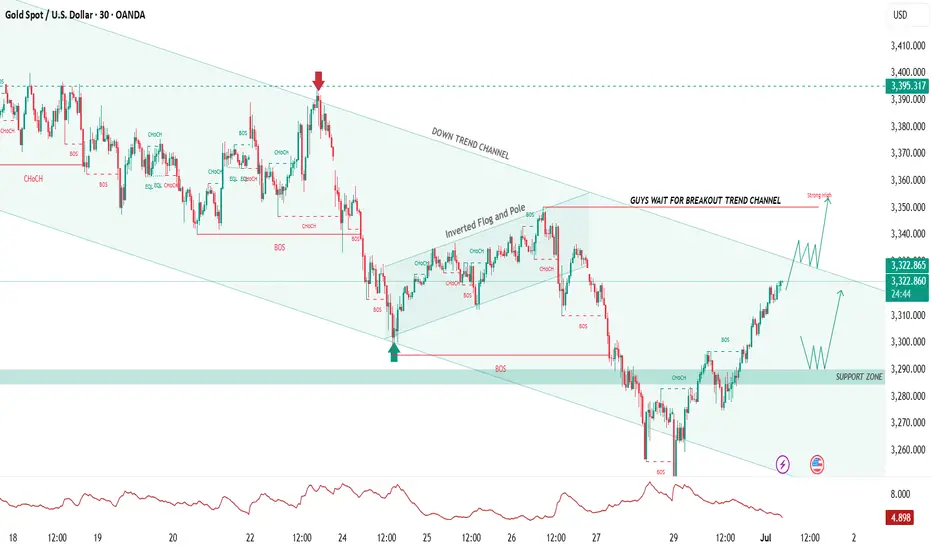
GOLD – Waiting for Breakout Above Downtrend Channel Toward 3395Gold is trading within a well-defined downtrend channel on the 30-minute chart.
Price has consistently respected the channel resistance, making lower highs and lows.
Recent bullish momentum is pushing against the upper boundary of the channel.
No confirmed breakout yet – price remains capped by the trendline resistance.
We’re seeing an inverted flag and pole formation that suggests pressure is building.
A clean break and close above the channel would confirm bullish intent.
Plan:
1.Wait patiently for a confirmed breakout before entering buys.
2.Avoid early entries while price is still inside the channel.
3.Watch for retest and hold above the broken channel as ideal confirmation.
4.Target move toward 3395 if breakout is successful.
Bias:
1.Bullish only on confirmed breakout and retest.
2.Bearish continuation possible if price fails to break the channel.
3.Discipline and patience are key – let the market confirm direction.
Like, comment, share, and follow for more trade ideas.
Xauusd Going Towards BuyDespite rising selling pressure on the dollar and mixed US PCE numbers, Gold prices fell further on Thursday, reaching new four-week lows around $3,260 per troy ounce. Collaborating with the decline, recent improvements in the Israel-Iran conflict continue to fuel investor withdrawals from the safe haven region.
XAUUSDThe market broke the strong support to now resistance and more bearish momentum expected as the bulls let go of bears to take control.

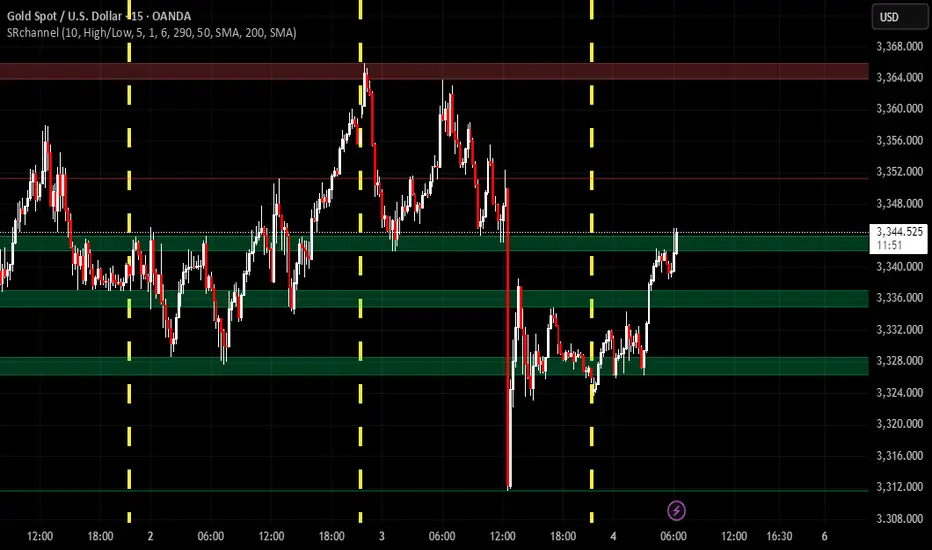
Gold Market Analysis Current Price: 3341.58
Market Behavior:
The price is ranging sideways, trading in a tight consolidation zone just below the resistance zone (around 3344).
Key Resistance Levels:
3344 → Immediate resistance
3348 – 3352 → Next minor supply zone
3357 – 3360 → Strong resistance ahead (if breakout occurs)
Key Support Levels:
3332 – 3330 → Short-term demand
3324 – 3320 → Stronger support zone
📌 Trader Insight:
"Gold is in a consolidation phase between 3330 and 3344. Wait for a confirmed breakout above 3344 for bullish momentum toward 3357+. If rejected again, expect a retest of support near 3332 or deeper."
✅ Trade Setup (Example):
Buy Scenario (Breakout):
Entry: Above 3345
Target: 3357
Stop Loss: Below 3338
Sell Scenario (Rejection):
Entry: Near 3344 resistance, if rejected
Target: 3332 / 3324
Stop Loss: Above 3348
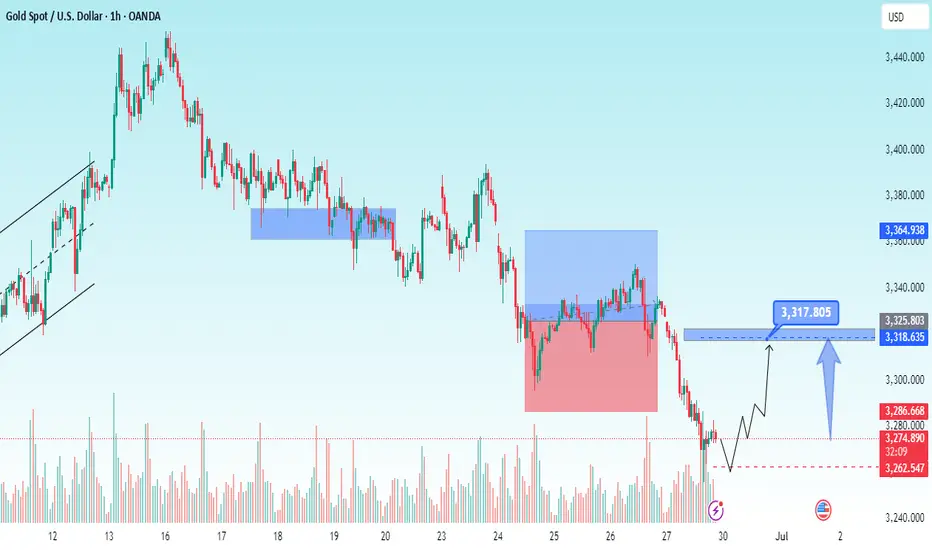
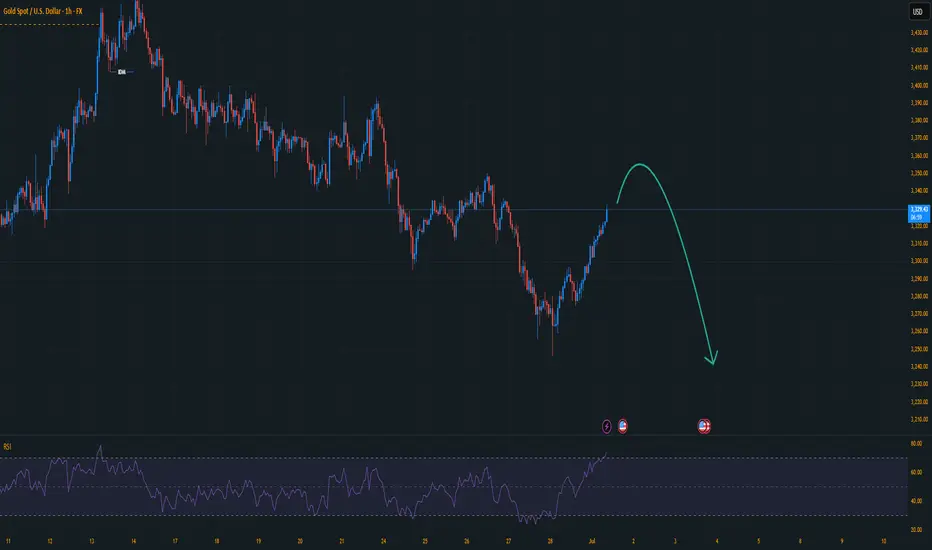
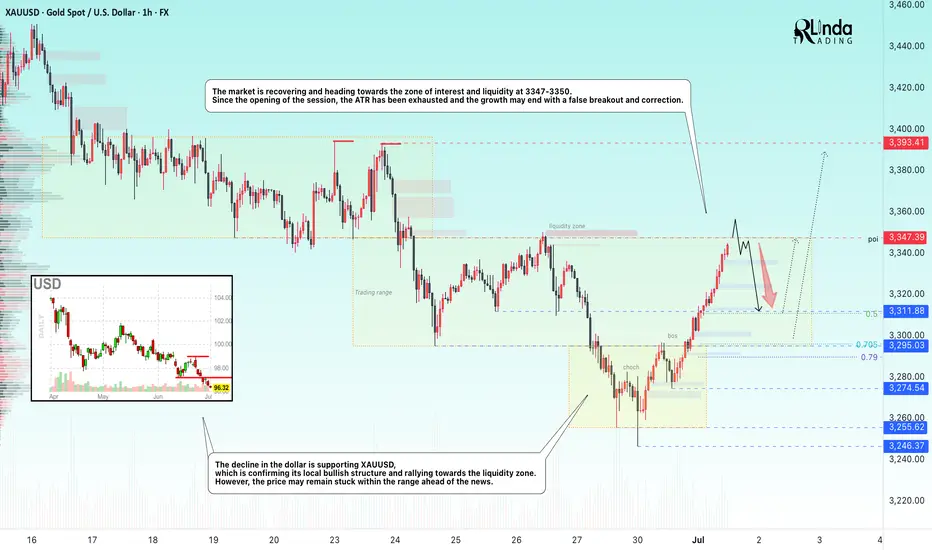
GOLD → Retest of the resistance range. Correction?FX:XAUUSD is recovering amid expectations of lower interest rates in the US, and the falling dollar is also supporting the price of the metal.
The dollar remains under pressure due to political uncertainty in the US, budget concerns, and trade risks. However, strong stock market growth and possible tariff measures against Japan and the EU are also affecting the market, adding volatility to gold
Powell will speak at the ECB forum, and markets are waiting for him to hint at a rate cut. Currently, the probability of a cut in July is estimated at 20%, and in September at 77%. A dovish tone will support gold, while a hawkish tone will increase pressure.
Technically, since the opening of the session, gold has exhausted its daily range (ATR), and there is a fairly high probability that after strong growth, the price may be stopped in the 3347-3350 zone.
Resistance levels: 3347, 3350
Support levels: 3312, 3295
If gold cannot continue to rise after breaking through 3347 and the price returns to the resistance zone, then in this case, we can consider a correction to 0.5-0.7 Fibonacci before a possible continuation of growth.
Best regards, R. Linda!
Gold growth, recovery 3393⭐️GOLDEN INFORMATION:
Gold prices edge higher during the North American session as investors turn their attention to the upcoming US Nonfarm Payrolls (NFP) report — a key indicator that could influence the Federal Reserve’s next policy move. At the time of writing, XAU/USD is trading at $3,348, up 0.29%.
Recent labor data from ADP revealed that companies are pausing hiring rather than resorting to layoffs, reflecting caution amid uncertain economic conditions. Meanwhile, Microsoft’s decision to cut 9,000 jobs has added to concerns about a softening labor market.
Traders now await Thursday’s official employment report from the Bureau of Labor Statistics, which is projected to show 110,000 new jobs added in June — a slowdown from May’s 139,000. The Unemployment Rate is expected to tick up slightly to 4.3%, still within the Fed’s projected range of 4.4% according to its latest Summary of Economic Projections.
⭐️Personal comments NOVA:
good buy, hold before NF news. Dollar continues to be under selling pressure from investors, worried about the Trump administration's unstable tariff policies.
⭐️SET UP GOLD PRICE:
🔥SELL GOLD zone: 3393- 3395 SL 3400
TP1: $3380
TP2: $3363
TP3: $3350
🔥BUY GOLD zone: $3296-$3294 SL $3289
TP1: $3308
TP2: $3318
TP3: $3330
⭐️Technical analysis:
Based on technical indicators EMA 34, EMA89 and support resistance areas to set up a reasonable BUY order.
⭐️NOTE:
Note: Nova wishes traders to manage their capital well
- take the number of lots that match your capital
- Takeprofit equal to 4-6% of capital account
- Stoplose equal to 2-3% of capital account
Gold?
Hi
Do you have a crystal ball? I do.. haha
You should rub/shine it frequently. Nahh.. just a joke.
I will call it : a prediction or bias.(That I hold , till proven wrong)
Look at weekly; formed 1 bar bullish , was taken/ broken low by 2 bearish bar.
So I'm bearish still.. although.. this week. it went into area of break price 3291.
The subtle point is.. where do i entry and how much price difference I will put in.
If 20$ gap.. price now $3330.00 +20$ = $3350
for 0.01 = 20$ risk
price 20$ seems reasonable if I'm at the right point/entry.
I'm too basic...
I'm too simple..
Not a guru
NB/ Yest NFP will be a strong bias too. What a sell off :)