GOLD (XAUUSD) 4H Technical Analysis – Channel Breakout & Target🧠 Executive Summary:
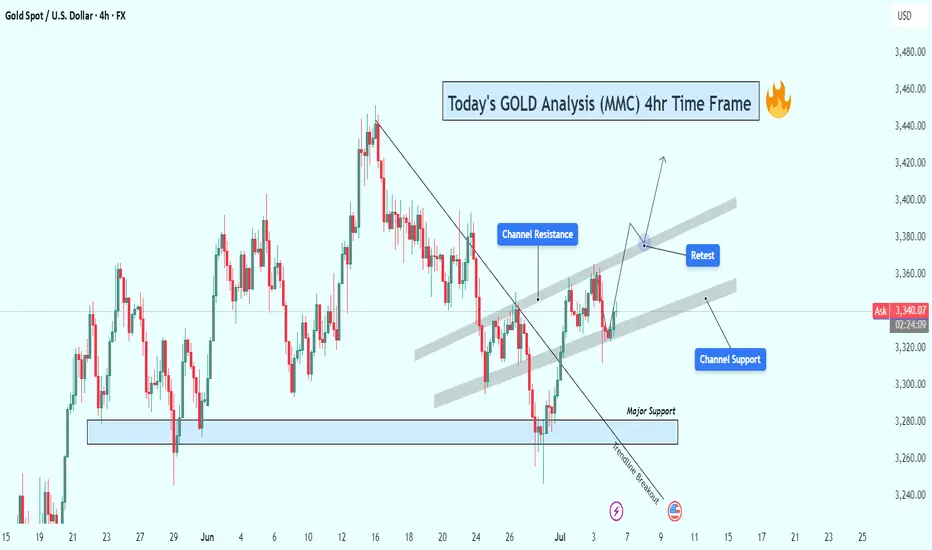
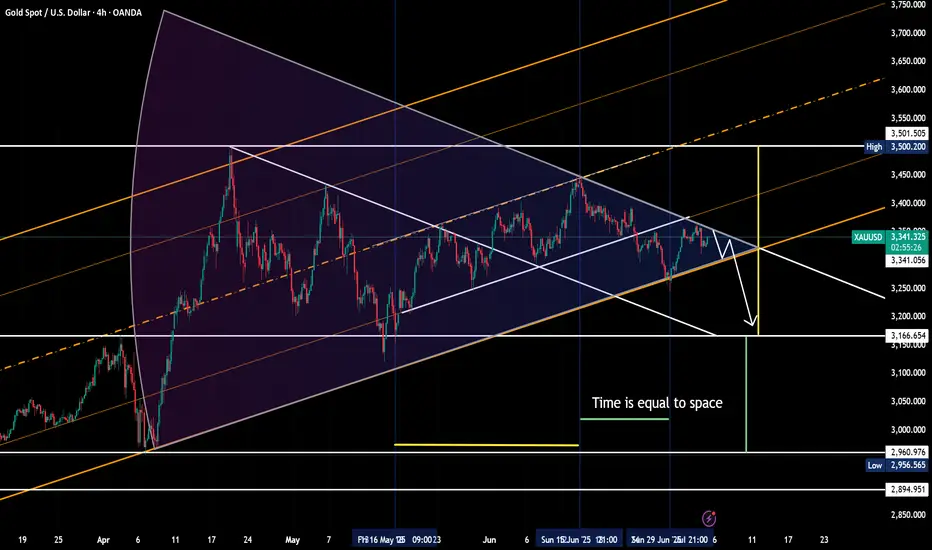
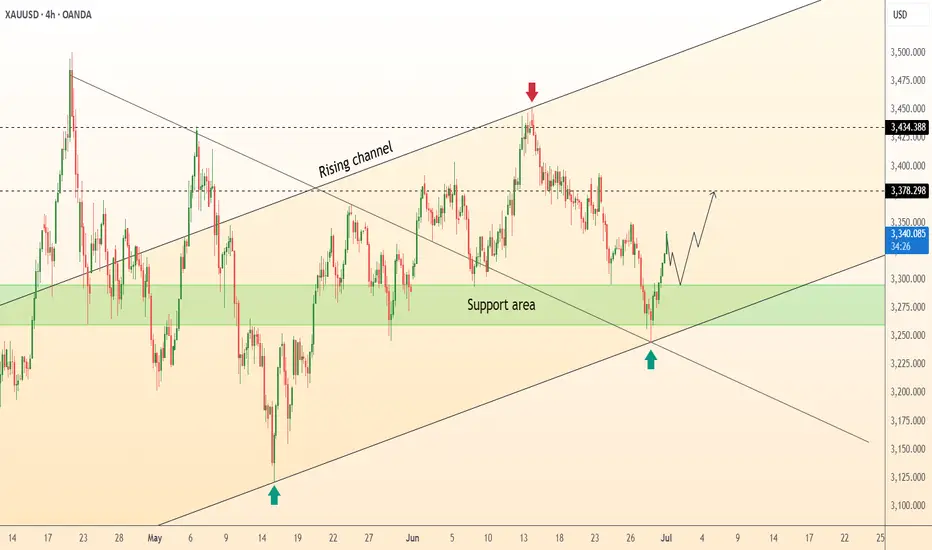
The GOLD market has completed a key structural shift following a successful bearish trendline breakout, and is now trading within a well-formed ascending price channel. Price action has recently bounced from the channel support area, which aligns closely with a retested zone that was previously resistance. All signs now point to a potential continuation of the bullish leg—but only if the current structure holds.
This analysis outlines the technical foundation, key trading zones, price action psychology, and risk management factors that define this setup.
🔍 Technical Breakdown
🔸 1. Trendline Breakout – The Structural Shift
The bearish trendline, which previously capped multiple upside moves throughout June, has finally been broken.
The breakout was accompanied by higher volume and larger bullish candles, indicating momentum.
After the breakout, price pulled back near the trendline and respected the newly flipped support zone.
This forms a classic Breakout–Retest–Continuation pattern, one of the most reliable in trend reversal scenarios.
🔸 2. Formation of Ascending Channel – A New Bullish Structure
After the breakout, price action established a consistent pattern of higher highs and higher lows, confirming the birth of a new ascending channel.
The channel support (around 3,320–3,330) has been tested multiple times and held strong.
The channel resistance lies between 3,390–3,400, which is now the next short-term target if bulls maintain control.
The channel offers both trend direction and entry timing opportunities as price bounces between its boundaries.
🔸 3. Retest Zone – Buyer’s Territory
The price is currently bouncing off the mid-channel zone, where the previous downtrend resistance overlaps with current channel support.
This confluence area is where smart money often enters after institutional accumulation at the base (around 3,270).
The bullish wick rejections around this zone signal a likely continuation toward the upper channel.
📈 Price Behavior & Market Psychology
What’s happening here isn't just lines and candles—there’s a psychological story unfolding:
Fear drove the market lower, respecting the bearish trendline until late June.
Hope and buyer aggression surged once the breakout confirmed.
Now we’re in the "belief" phase, where traders await confirmation of the new trend.
Many are watching for entry confirmation at support zones, and as long as fear doesn’t return (i.e., price breaking below 3,320), the structure remains valid.
🧭 Key Technical Levels to Watch
Level Type Price Range Notes
Major Support Zone 3,270–3,285 Key buyer zone, invalidation of bullish case below this
Channel Support 3,320–3,330 Retest zone after breakout, current active level
Mid-Channel Area 3,350–3,360 Decision zone – price may build momentum here
Channel Resistance 3,390–3,400 First bullish target, potential breakout area
Breakout Target 3,420–3,440 If price breaks channel resistance with volume
🧮 Trade Setup Ideas (Educational – Not Financial Advice)
🟢 Long Setup Option 1:
Entry: Upon confirmation above 3,340–3,345 with bullish engulfing candle or breakout bar.
Stop-Loss: Below 3,320 or slightly below channel support.
Take Profit: Partial at 3,390 (channel top), full at 3,420–3,440 breakout zone.
R:R Ratio: 1:2.5+ (highly favorable)
🔴 Bearish Scenario (Risk Management)
If price closes below 3,320 with momentum, expect a revisit to the 3,270–3,285 support.
This invalidates the current bullish channel structure and might bring in short-term bearish pressure.
Avoid long positions until new structure is formed.
🧠 Educational Takeaway for Traders
This analysis highlights the importance of:
Structure-based entries: Instead of chasing candles, you wait for confluence and entry triggers.
Multiple timeframe confirmation: Higher timeframes also show bullish bias, giving confidence to 4H trades.
Risk management: The current setup allows tight stop losses relative to potential reward, making it attractive.
By combining trendline breakouts, channel formations, and support/resistance flips, you significantly increase the probability of a successful trade.
📌 Final Thoughts:
Gold is giving traders a clean and structured opportunity. The market has shown strength through structure, not just random price spikes. With the ascending channel intact and price respecting support zones, there is a solid foundation for a bullish continuation toward 3,400 and beyond.
But as always, confirmation is key. Wait for price action to validate your bias, and never ignore risk management.
CFDGOLD trade ideas
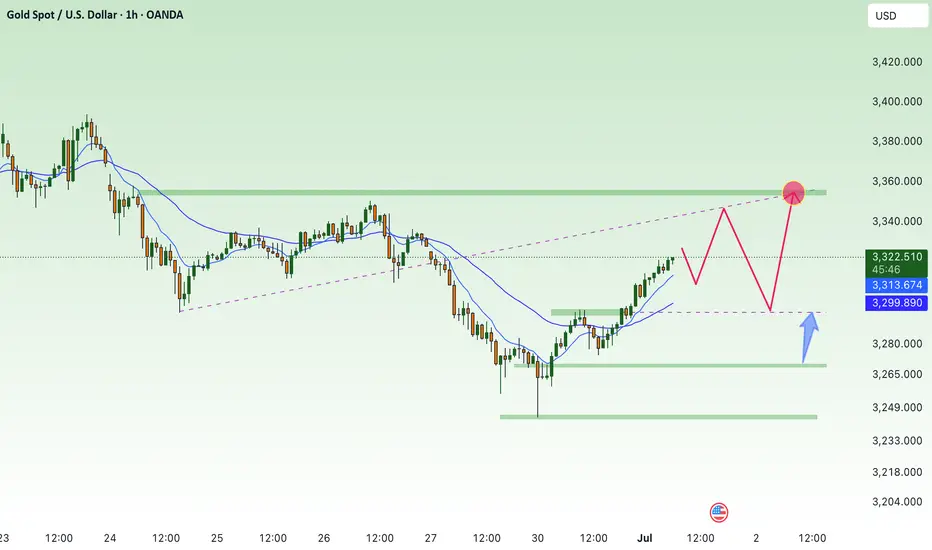
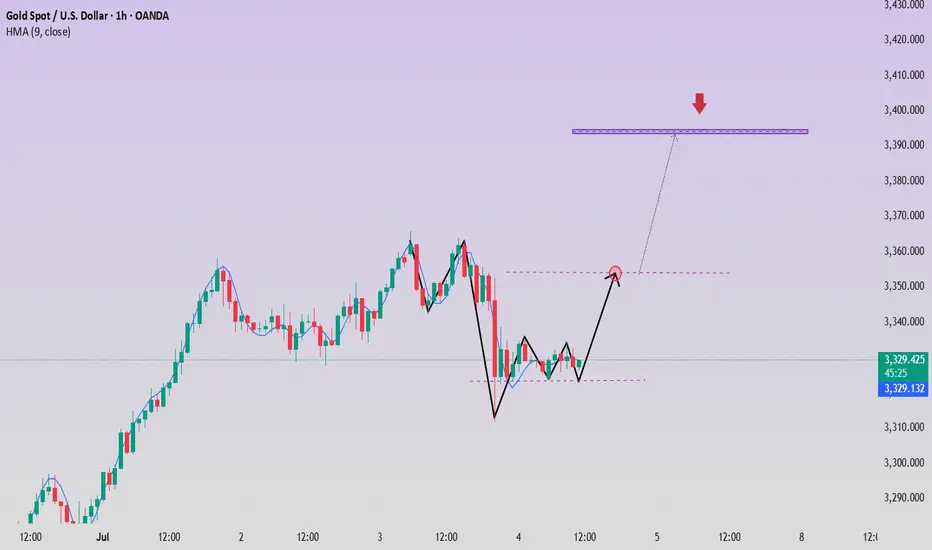
XAUUSD – Bullish Flag Pattern on the Hourly Chart📌 XAUUSD – Bullish Flag Pattern on the Hourly Chart
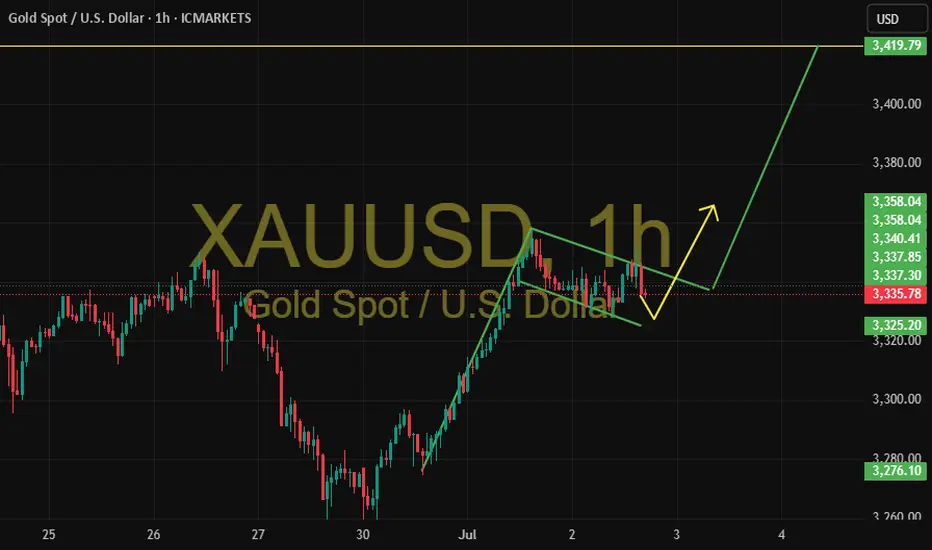
Gold completed a strong upward move last week and then entered a corrective phase forming a classic bullish flag pattern with a descending channel.
🟡 Currently, price is consolidating within the pattern boundaries. As long as it holds the support area around 3,325, the favored scenario is a continuation of the bullish trend upon an upward breakout.
🎯 Technical target after breakout: 3,419, based on the flagpole height.
📉 In case of a downside break, the scenario will be reassessed.
🔍 This analysis is for educational purposes only and not a trading recommendation.
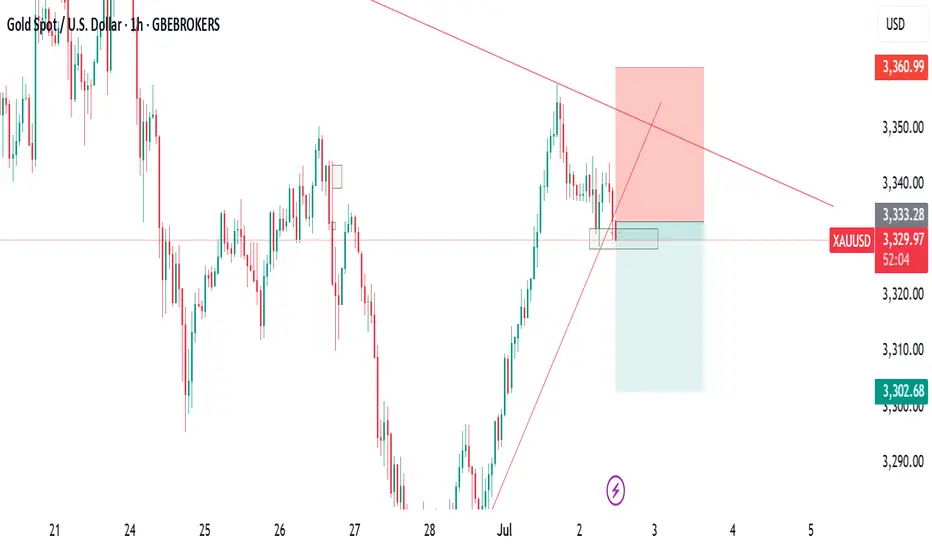
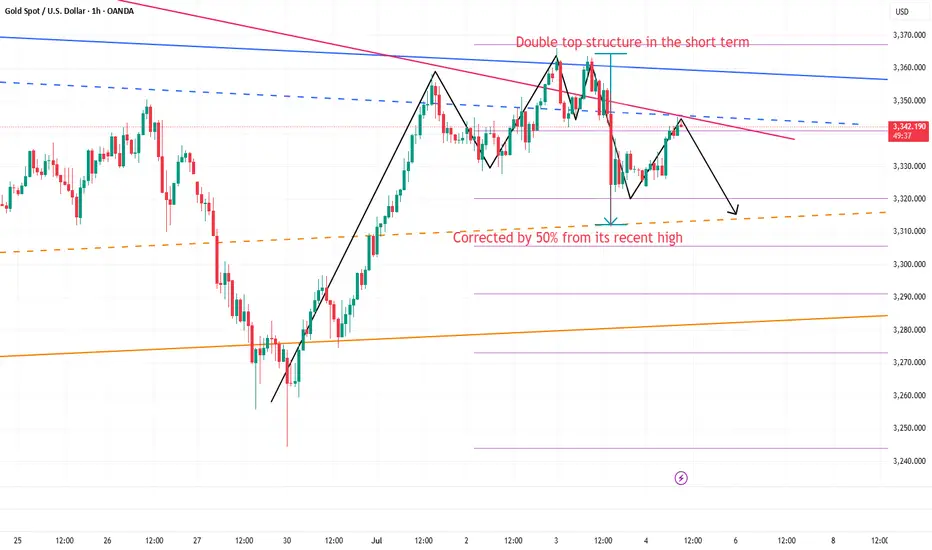
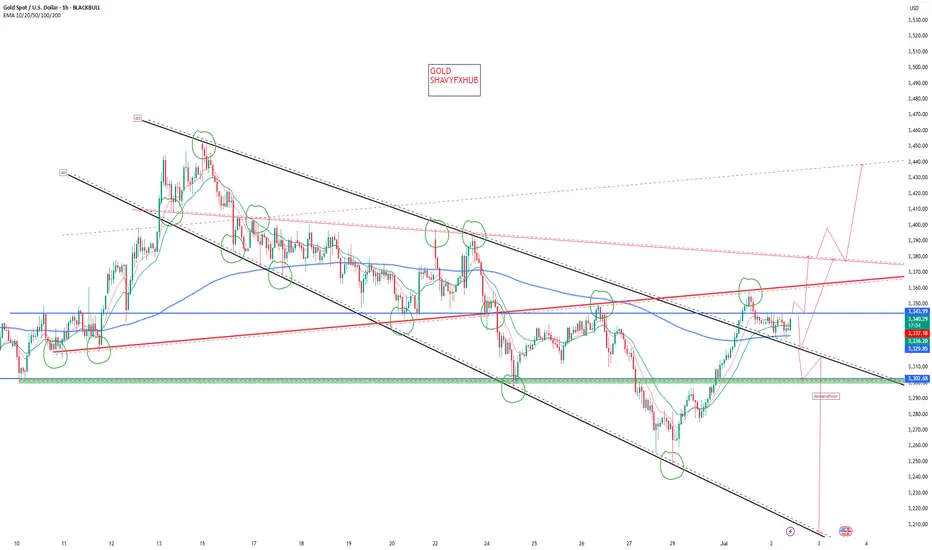
Still short gold before breaking 3355After the release of NFP yesterday, gold began to fall sharply from 3352, reaching a low of around 3312; although it has gradually rebounded above 3340, the time span is not short, so the rebound is not strong; and the double top structure successfully constructed by gold in the 3365-3360 area in the short term still plays a technical suppression role in the short term, greatly weakening the rebound potential; and with the decline of gold yesterday, I think before gold recovers the 3352 starting point, gold will also be under pressure in the 3345-3355 area in the short term. If gold cannot successfully break through this area during the rebound, gold is expected to retest the 3330-3320 area again.
Because of the US Independence Day, the gold market will be closed in advance today. It is expected that gold will not have a breakthrough today, so it may be difficult to break through the 3345-3355 area in the short term, so we can still continue to maintain the trading rhythm of shorting gold in terms of trading.
So I think shorting gold still has a lot of profit potential. We can short gold with 3345-3355 area as resistance and look to the target area: 3335-3325-3315.
XAU/USD Gold LONG 1:1 XAU/USD Gold LONG 1:1
Let's try to catch the low of the 4h candle, limit order.
Enjoy!
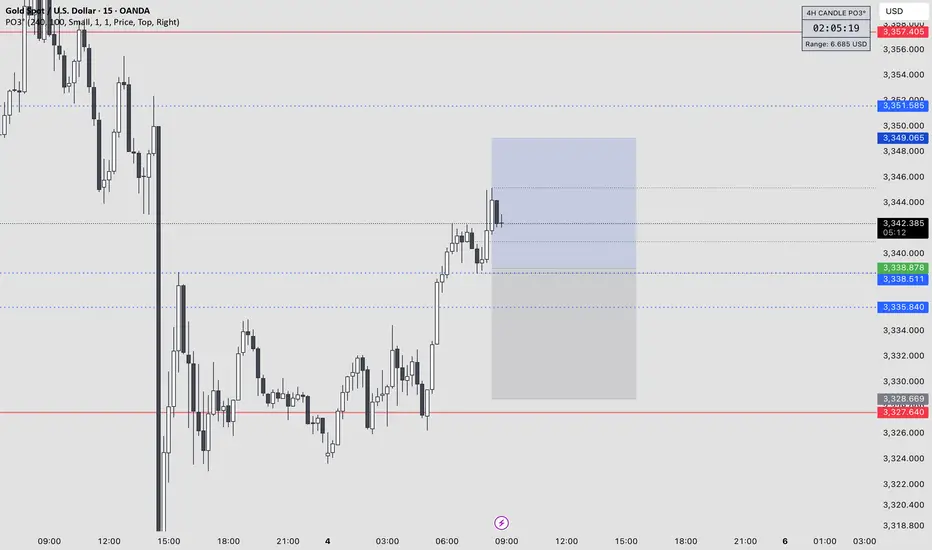
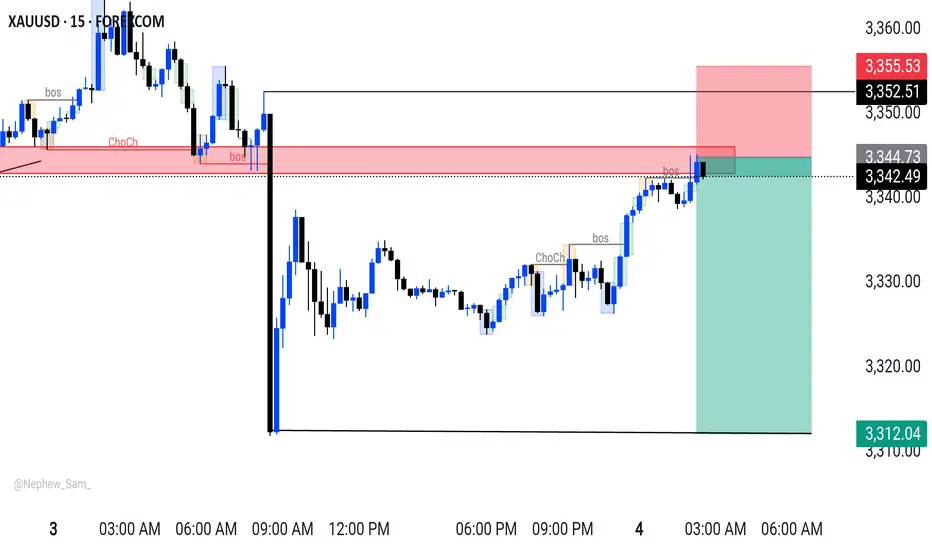
XAUUSD M15 Outlook XAUUSD Sell Setup
Timeframe:~(15M)
Entry: ~ 3344
Target1:~ 3327
Target2:~ 3312
SL:~ 3354
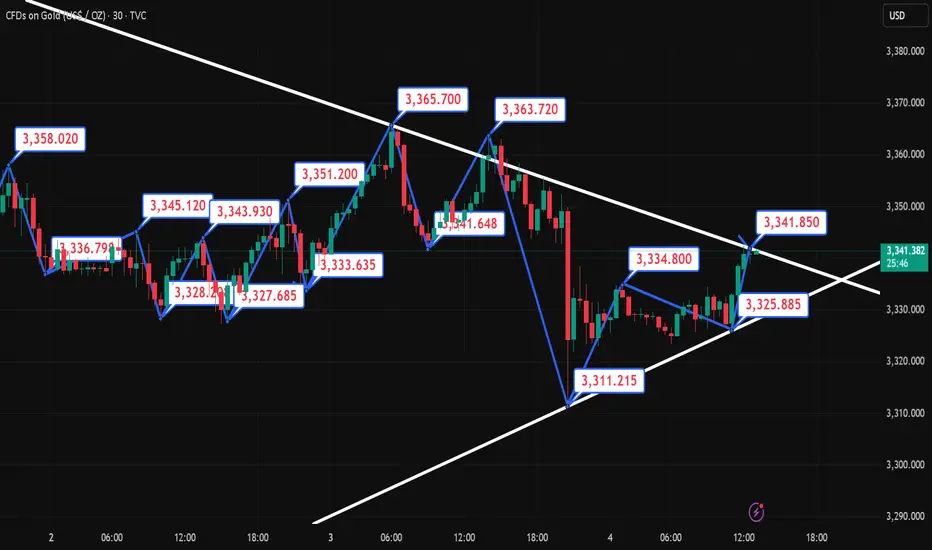
Gold price range: 3310-3360Gold price range: 3310-3360
Spot gold fell to $3311.65 during the session, but it is still fluctuating above the key support level of $3310, and the current price is around 3340.
As shown in the figure:
The latest triangle convergence range oscillation pattern has been shown to everyone
Key pressure area: 3355-3360
Key support area: 3310-3320
It is expected to enter a range oscillation pattern on Friday.
Due to the US Independence Day holiday, today's gold price trend is more affected by the performance of the Asian session.
According to analysis and observation, the gold price showed a pull-up or oscillating upward trend in the Asian session this week.
Most of the factors that led to the rise in gold prices this week can be attributed to the pull-up rhythm in the Asian session.
According to Chinese news reports: China has suspended holdings of gold, but Turkey and India are still buying.
In other words, the main factors for this week's rise are Turkey and India.
At present, the range of gold price fluctuations will become narrower and narrower, and it is unlikely that a new general direction will appear this week.
Then the corresponding strategy is:
In the oscillation range of 3310-3360, use oscillation thinking to trade
Short at high level, stop loss at 3365
Long at low price, stop loss at 3300
The author prefers the idea of short at high price
Gold price recovers above 3300⭐️GOLDEN INFORMATION:
Gold (XAU/USD) trades at $3,292 after rebounding from an intraday low of $3,246 and looks set to close out June with a modest gain of over 0.18%. However, its upward momentum has been restrained by easing geopolitical tensions in the Middle East and growing optimism over forthcoming trade agreements. Meanwhile, analysts at Citi expect Gold to consolidate within the $3,100 to $3,500 range throughout the third quarter.
In Washington, US Treasury Secretary Scott Bessent expressed confidence that the “One Big Beautiful Bill” will make progress in the coming hours. The sweeping tax reform legislation, which narrowly passed the Senate over the weekend, includes major tax deductions funded by reductions in Medicaid spending and green energy incentives.
⭐️Personal comments NOVA:
Gold price recovers above 3300 , ahead of NF reports this week . Accumulates above 3300
⭐️SET UP GOLD PRICE:
🔥SELL GOLD zone: 3353- 3355 SL 3360
TP1: $3340
TP2: $3330
TP3: $3320
🔥BUY GOLD zone: $3272-$3270 SL $3265
TP1: $3283
TP2: $3295
TP3: $3310
⭐️Technical analysis:
Based on technical indicators EMA 34, EMA89 and support resistance areas to set up a reasonable BUY order.
⭐️NOTE:
Note: Nova wishes traders to manage their capital well
- take the number of lots that match your capital
- Takeprofit equal to 4-6% of capital account
- Stoplose equal to 2-3% of capital account
7.4 Non-farm payrolls exploded, and expectations for the Fed’s rOn Thursday, as the strong US employment data dispelled the market's expectations of the Fed's recent rate cut, the US dollar index rose sharply before the US market, returned to above the 97 mark, and once rose to an intraday high of 97.42.
Spot gold fell sharply, once falling to $3311 during the session, a drop of more than $50 from the intraday high, and then recovered some of its losses and remained near 3330 for consolidation.
The current upper suppression position of the daily line is almost here at 3350, and the lower support is located at 3320-25.
So if it is maintained in the range of consolidation, it is likely to be rectified at 3320-50.
Secondly, from the hourly chart:
It can be seen from the trend of 3247 to 3365.
The Fibonacci 618 position is exactly here at 3320.
Although the lowest point last night was pierced to around 3311, it can be seen that the entity still closed above 3320.
As long as 3320 cannot be broken, the best case scenario is to maintain it at 3320-50 for consolidation. If not, once 3350 is broken, the high point of 3365 will definitely not be able to be maintained.
Therefore, for today's operation, try to maintain the high-selling and low-buying range of 3320-50.
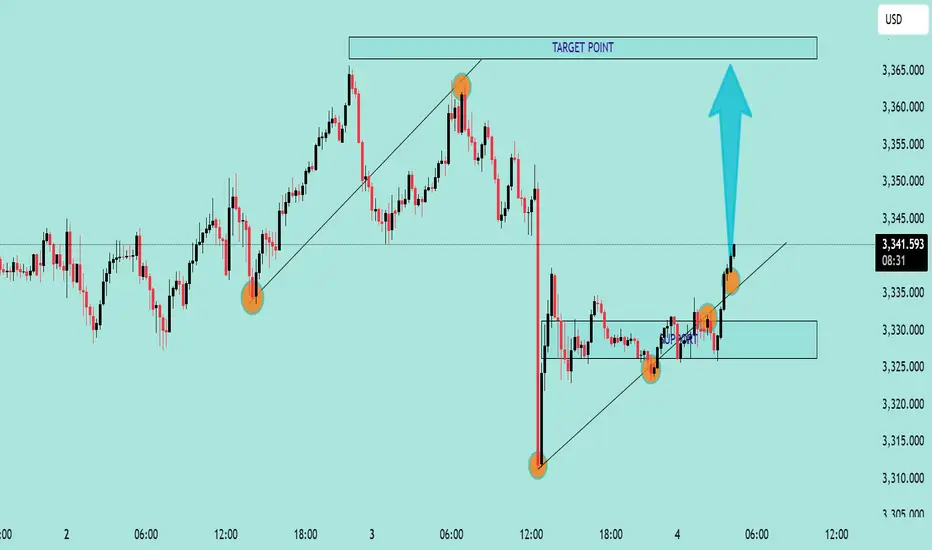
Gold/USD Bullish Breakout Toward Target Zone Gold/USD Bullish Breakout Analysis 🚀🟢
The chart illustrates a strong bullish breakout from a consolidation zone, signaling upward momentum:
🔍 Key Technical Observations:
Support Zone: The price respected the support area around 3,325 – 3,330 USD, forming a solid base for reversal.
Bullish Structure: Series of higher lows and higher highs indicate a bullish trend formation.
Breakout Confirmation: Price broke above short-term resistance with a strong bullish candle, indicating buying pressure.
Trendline Support: The ascending trendline has held well, confirming trend continuation.
Target Point 🎯: Projected target is near 3,365 USD, which aligns with a previous resistance and Fibonacci confluence zone.
✅ Conclusion:
The breakout above resistance, supported by a bullish structure and momentum, suggests further upside potential toward the 3,365 USD target zone. As long as price holds above the breakout level, bullish bias remains valid.
🛑 Watch for invalidation if price falls back
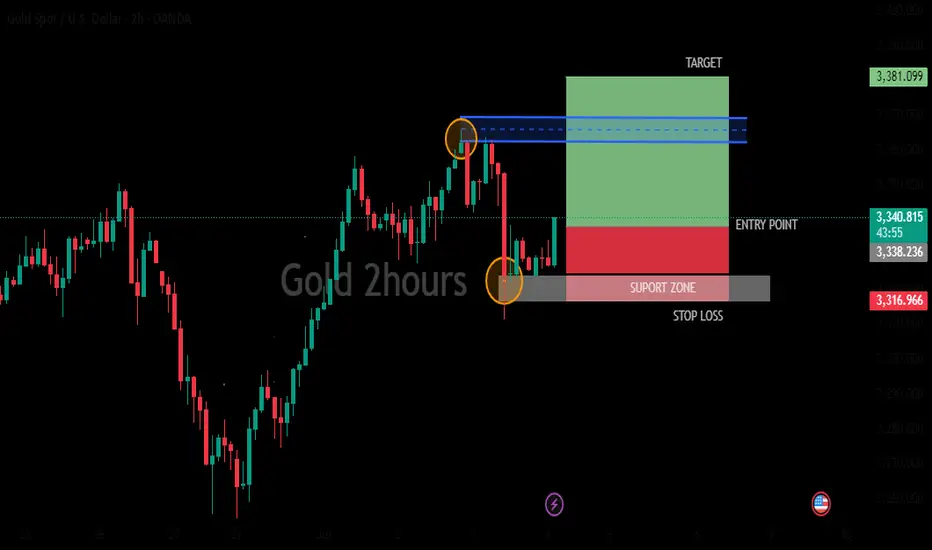
GOLD 2HOURS BULISH ANALYSISMarket may be going buy side and the presence of indicators and other tools suggests that the user is actively monitoring and analyzing the market.target price (green bar) stop loss (red bar) entry point (blue line)
Gold fluctuates during the day, short-term profits will be left
📌Main driving events of gold
The big non-agricultural data in the United States caused the gold price to fall by almost 40 US dollars in one breath, but after a short emotional storm, the market returned to calm. Today's market began to bottom out and rise. As of now, the non-agricultural market has been backed by 50%, and the energy of the shorts has been basically digested. Next, the bulls will start to exert their strength! Today's direction is still the same and continue to be bullish!
📊Comment analysis
In the US market, the gold price rebounded after the decline and the bottom of the second retracement appeared. The support level is 3322. After a night of fluctuations, gold has begun to rise, and the low point has begun to rise. The key point of the day is still 3323. In the morning, we wait for the gold price to fall back to around 3323 and we will buy the bottom and go long. We don’t expect to surpass yesterday’s high point during the day, but at least it will go to 3350!
💰Strategy Package
Long position:
Gold long at 3322-3327, stop loss 3315, target 3350-3360
⭐️ Note: Labaron hopes that traders can properly manage their funds
- Choose the number of lots that matches your funds
GOLD The ADP Non-Farm Employment Change for July 2,have a forecast of 99,000 jobs, compared to the previous month’s very weak result of 37,000—the lowest since March 2023. The ADP National Employment Report is a monthly indicator that tracks changes in non-farm private sector employment in the US, based on anonymized payroll data from ADP’s clients, covering about one-fifth of all US private employment.
Who is responsible?
The report is produced by the ADP Research Institute, part of Automatic Data Processing (ADP), in partnership with the Stanford Digital Economy Lab.
Why it matters:
The ADP report is viewed as a leading indicator for the official Non-Farm Payrolls (NFP) report from the Bureau of Labor Statistics (BLS), released two days later.
It provides early insight into US private sector job growth and labor market health, and significant deviations from forecasts can move financial markets.
Note that the ADP report covers only private sector jobs, not government employment, so its numbers can differ from the official NFP.
Summary Table:
Report Date Forecast Previous Responsible Department
July 2, 2025 99,000 37,000 ADP Research Institute (ADP)
In summary:
The ADP Non-Farm Employment Change report, produced by the ADP Research Institute, forecasted a rebound to 99,000 jobs in June after a very weak 37,000 in May, providing an early signal on the health of US private sector employment.
(2)US10Y drops to historical low to 4.193% and currently broken 1hr descending trendline at 4.281% ,4.3% resistance will be watched for breakout buy bond buyers.
(3) DXY Key Points:
The DXY measures the US dollar’s strength against a basket of six major currencies: the euro (57.6% weight), Japanese yen (13.6%), British pound (11.9%), Canadian dollar (9.1%), Swedish krona (4.2%), and Swiss franc (3.6%).
After peaking near 110.075$ in January 2025, the index has softened , trading near 96.600-101.966.on weekly TF 101.966 was a retest to broken weekly demand floor .
The dollar’s decline reflects market expectations of Federal Reserve rate cuts later in 2025, easing inflation pressures, and some geopolitical easing.
the DXY to rebound will henge and depend on Fed policy and global economic conditions.
GOLD buyers are watching for the direction of trade ,
Chinese Demand and Policy:
China is one of the largest gold consumers and holders. Domestic demand, central bank gold purchases, and monetary policy in China heavily influence XAU/RMB. If China’s economy slows or trade tensions with the US worsen, demand for gold as a safe haven may increase, supporting XAU/RMB even if the dollar is strong.
China's recent opening of the Shanghai Gold Exchange's (SGE) first offshore gold vault in Hong Kong on June 26, 2025, represents a significant development with potential, albeit indirect, implications for XAU/USD (gold priced in US dollars) .
Key Aspects of the Hong Kong Gold Vault:
Location and Operation: The vault is located in Hong Kong and operated by Bank of China's Hong Kong unit .
Yuan-Denominated Trading: All transactions and settlements in the vault are denominated exclusively in yuan, either via cash or physical bullion delivery . Two new yuan-denominated gold trading contracts were launched alongside the vault .
Strategic Objectives:
Increased Influence on Gold Pricing: China, as the world's leading gold producer and consumer, aims to gain greater control and influence over global gold pricing mechanisms .
Yuan Internationalization: The initiative seeks to accelerate the international usage of the yuan, supporting China's broader de-dollarization efforts . This allows China to import gold in yuan, reducing reliance on the US dollar for commodity trading .
Enhanced Global Reach: The vault expands the SGE's physical infrastructure beyond mainland China, creating a new gateway for international gold trading and solidifying Hong Kong's role as a key financial hub .
Physical Settlement: It facilitates the physical settlement of gold contracts outside mainland China .
Implications for XAU/USD:
While the new vault directly promotes yuan-denominated gold trading, its implications for XAU/USD are primarily indirect and long-term:
De-dollarization Efforts: By promoting yuan-denominated gold trading, China is actively working to reduce global reliance on the US dollar in commodity markets . If successful, a more diversified global gold trading landscape could gradually diminish the dollar's sole influence over gold prices, potentially leading to less direct inverse correlation between the dollar and gold .
Increased Demand and Liquidity: The vault aims to attract more international participants to yuan-denominated gold markets, potentially increasing overall gold demand and liquidity in the Asia-Pacific region . While this demand is primarily yuan-driven, a generally stronger global gold market could indirectly support XAU/USD .
7.1 Technical guidance for short-term gold analysis!!!Gold hourly level: From the opening to now, it has been rising slowly with a small negative in the middle. It is all positive. This kind of pull-up pattern must not be tested for shorting. During the European session, it also broke through the upper rail resistance of the 3335 downward channel. There is a second pull-up in the US session; but it has not been able to step back, and even the 10-day moving average does not give a chance. If you want to step back and follow the long position, there is no chance for the time being, and going long directly seems more radical; conservative can wait patiently, be bullish, and don't go short; if it can be confirmed tonight that it is above 3335, you can try to follow the bullish trend, and the upper resistance target is 3374;
DeGRAM | GOLD held the support area📊 Technical Analysis
● Bullish rebound from the green 3 250-3 300 demand, where the rising-channel base and May’s inner trend-line intersect, prints a higher low and invalidates the prior break.
● Price is reclaiming the channel median; a push through 3 378 unlocks the June swing cap at 3 434, while risk is contained by the fresh pivot turned support at 3 300.
💡 Fundamental Analysis
● Softer US ISM-Mfg prices and a dip in 2-yr yields eased dollar pressure, while IMF data show another uptick in official gold purchases—both restoring near-term bid.
✨ Summary
Long 3 300-3 320; hold above aims 3 378 → 3 434. Invalidate below 3 250.
-------------------
Share your opinion in the comments and support the idea with a like. Thanks for your support!
GOLD ANALYSIS: A Bullish Breakout coming XAU-USD🔍 Key Technical Levels Decoded
🛡️ FORTRESS SUPPORT ZONE: $3,245 - $3,295
🛡️ Psychological level at: $3,250
1. 🎯 TARGET ZONES:
Immediate Target: $3,360 (4H FVG - Fair Value Gap)
Primary Target: $3,320 - 3,340
2. 🎭 The Liquidity Grab
The recent dip was a masterclass in market mechanics:
Weak longs were flushed out at $3,293
mean Smart money accumulated at discount prices
_______________________________
⚠️ RISK MANAGEMENT 🚨 DISCLAIMER ⚠️ DYOR

XAU/USDPrice action trading is a methodology where traders make decisions based on the interpretation of actual price movements on a chart, rather than relying primarily on lagging indicators. It involves observing and analyzing candlestick patterns, trend lines, support and resistance levels, and volume to identify potential trading opportunities and manage risk. The focus is on understanding the story the market is telling through its price behavior.