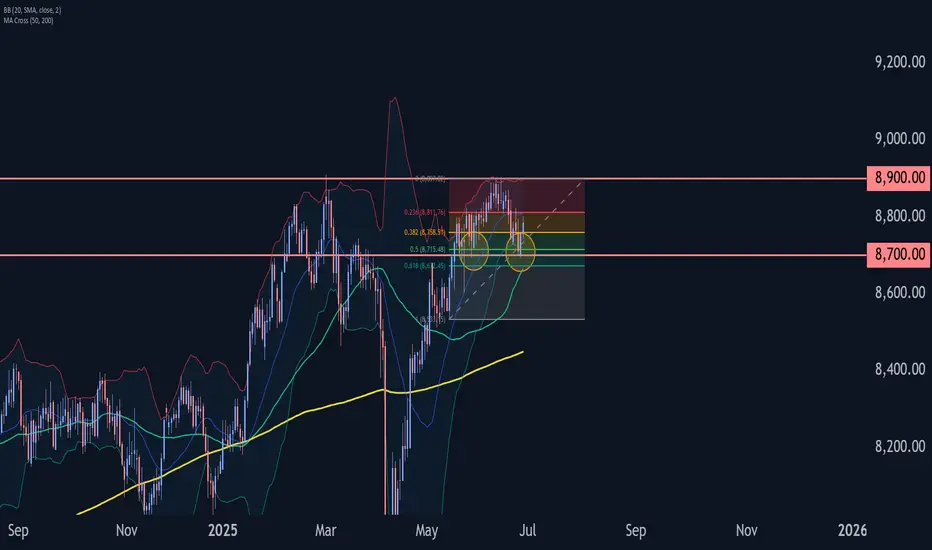
Nearly UK time to shine to 9,721Now it looks like it's UK time to shine.
It is priming for a strong breakout above the Cup and Handle.
Once it breaks the brim, it could be all upside to 9,721.
Large Cup and Handle
Price near above 20 and 200
Target 9,721
Disclosure: I am part of Trade Nation's Influencer program and rece
About FTSE 100 Index
The UK Financial Times Stock Exchange 100, more commonly known as the FTSE 100 or 'Footsie', is an index of share prices of the largest 100 companies listed on the London Stock Exchange (LSE) by market capitalization. The index was launched on January 3, 1984 at a base value of 1000, and the index level is calculated in real-time. The FTSE 100 represents approximately 81% of the entire market capitalization of the LSE, and even though it doesn't encompass the whole market, it is widely viewed as the best indicator of the heath of UK stocks. In recent years, however, given the uptick in international companies counted in the FTSE 100, this particular market index is no longer viewed as the best health indicator of the UK economy - that goes to the FTSE 250, which has a smaller proportion of multinationals among its constituents.

UK100/FTSE100 - TIME TO SEND UK100 TO RECESSIONTeam, we are setting two strategies to the SHORT UK100/FTSE100
Ensure you understand your RISK - can always discuss with us in the room
Let's SHORT UK100/FTSE100, I still expect the market to be volatile even though the US expect a rate cut. on the 9th JULY, there will be a tariff announcement, and
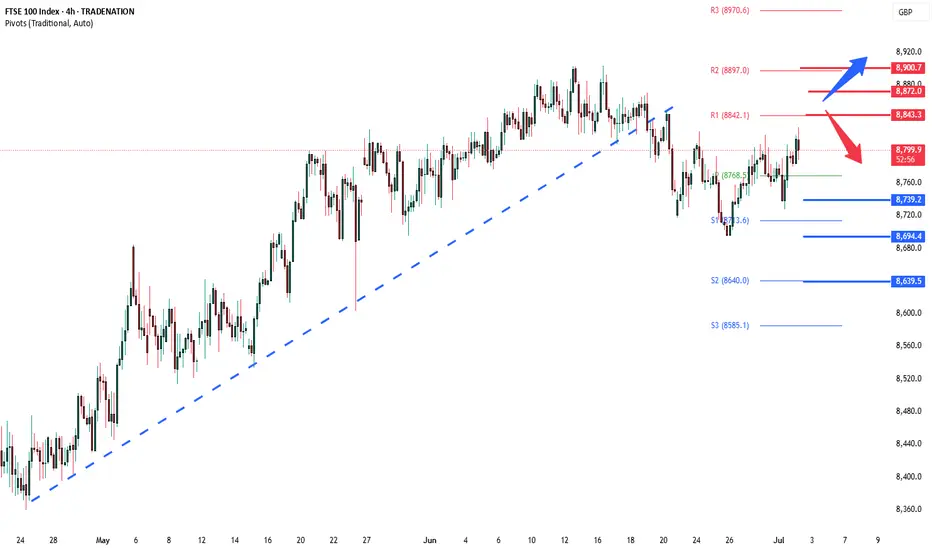
FTSE oversold rally resistance at 8820The FTSE remains in a bullish trend, with recent price action showing signs of a corrective pullback within the broader uptrend.
Support Zone: 8740 – a key level from previous consolidation. Price is currently testing or approaching this level.
A bullish rebound from 8740 would confirm ongoing ups
FTSE Oversold rally resistance at 8820The FTSE remains in a bullish trend, with recent price action showing signs of a corrective pullback within the broader uptrend.
Support Zone: 8695 – a key level from previous consolidation. Price is currently testing or approaching this level.
A bullish rebound from 8695 would confirm ongoing ups
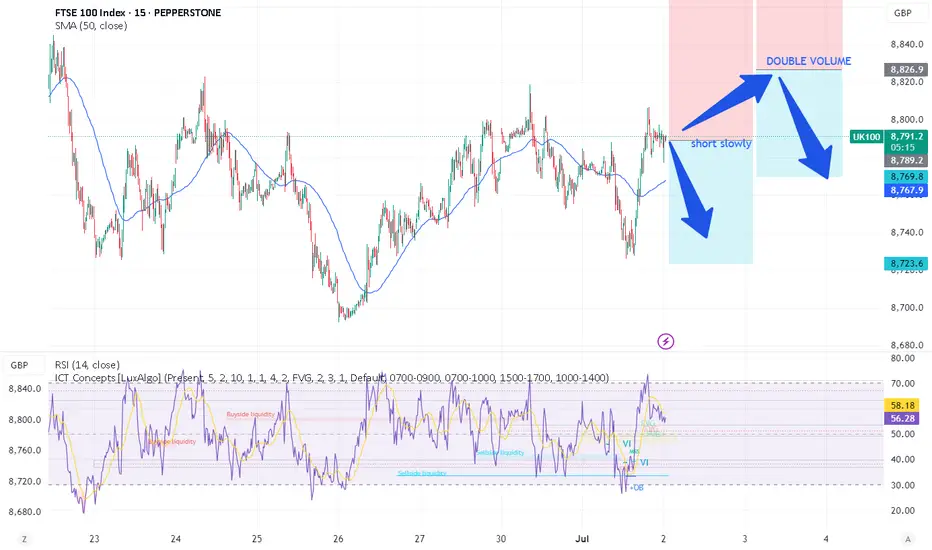
UK100/FTSE100Team,
SHORT UK100/FTSE100 slowly at 8796-8826
TARGET at 8772-8746 ranges
DOUBLE UP at 8846-66 - target at 8802-12

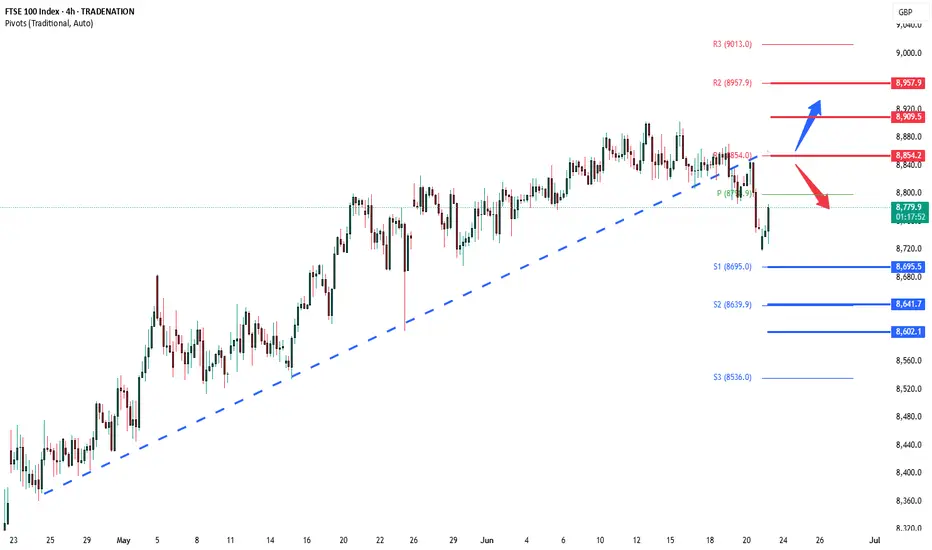
FTSE100 oversold rally testing resistance at 8820The FTSE remains in a bullish trend, with recent price action showing signs of a corrective pullback within the broader uptrend.
Support Zone: 8695 – a key level from previous consolidation. Price is currently testing or approaching this level.
A bullish rebound from 8695 would confirm ongoing ups

FTSE 100 Wave Analysis – 27 June 2025
- FTSE 100 reversed from support level 8700.00
- Likely to rise to resistance level 8900.00
FTSE 100 index recently reversed up from the support level 8700.00 (which stopped wave 4 at the end of May, as can be seen from the daily FTSE 100 chart below) intersecting with the lower daily Bollinger B
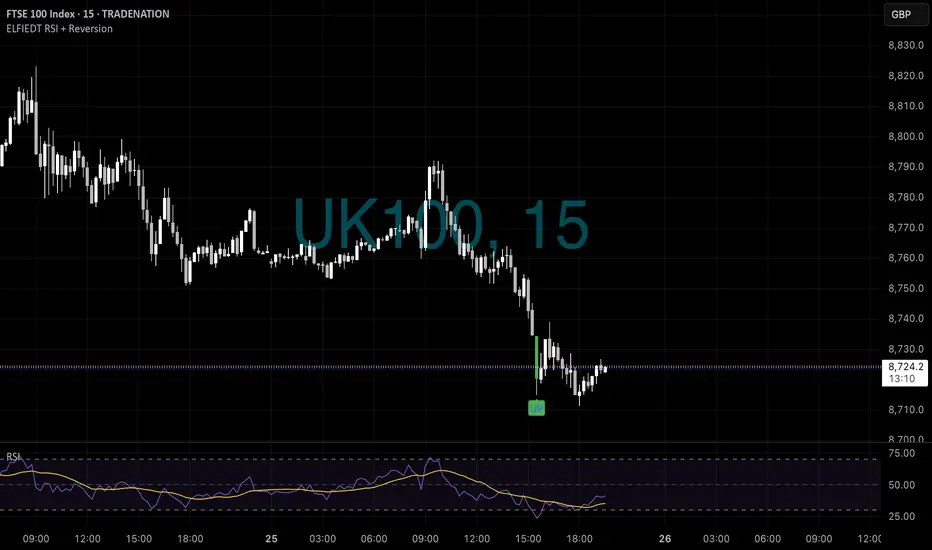
UK100 - Long?📈 Possible Scenarios After the “UP” Signal on FTSE 100 (UK100):
✅ Scenario 1: Reversion Rally (Most Probable Based on the Indicator)
The “UP” label suggests the system has detected short-term exhaustion to the downside.
Price may now revert higher toward the previous breakdown zone (~8,740–8,755),
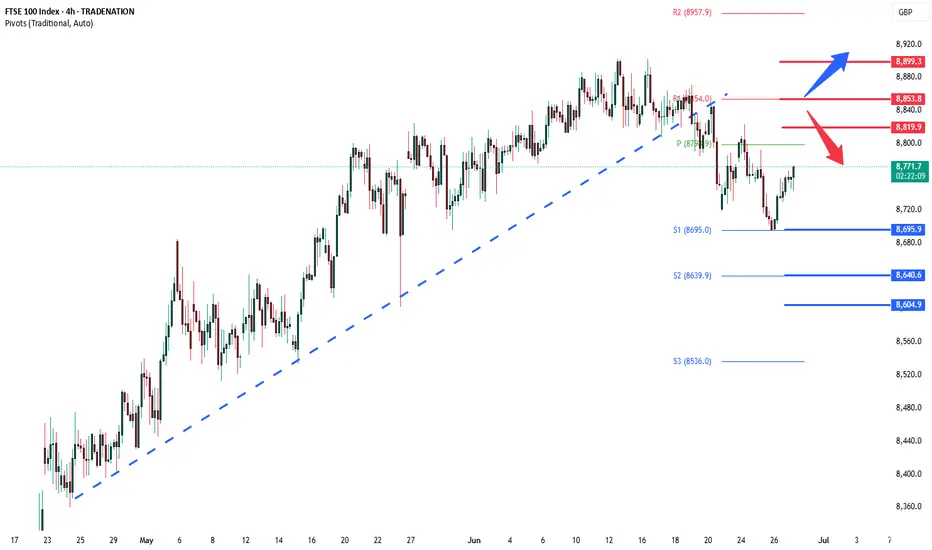
FTSE uptrend pause capped at 8854The FTSE remains in a bullish trend, with recent price action showing signs of a corrective pullback within the broader uptrend.
Support Zone: 8695 – a key level from previous consolidation. Price is currently testing or approaching this level.
A bullish rebound from 8695 would confirm ongoing ups
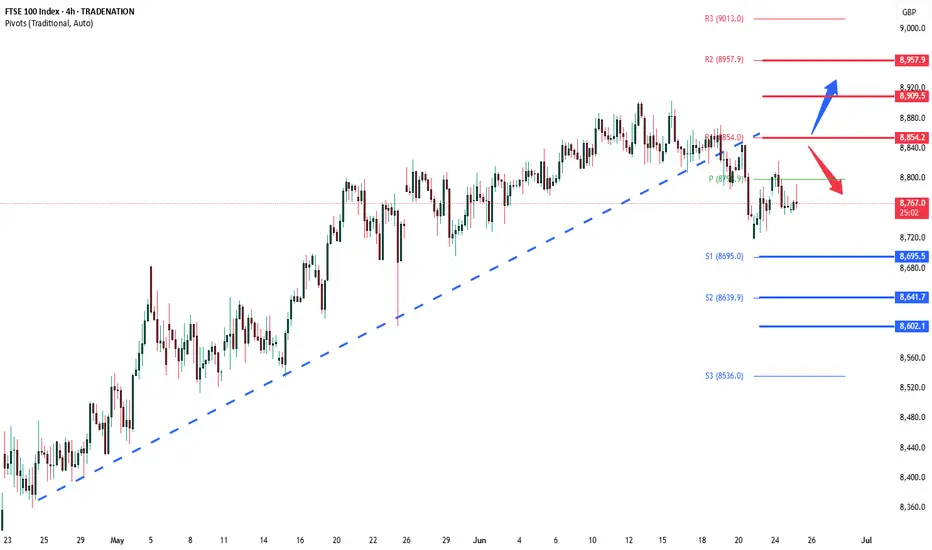
FTSE pivotal level at 8854The FTSE remains in a bullish trend, with recent price action showing signs of a corrective pullback within the broader uptrend.
Support Zone: 8695 – a key level from previous consolidation. Price is currently testing or approaching this level.
A bullish rebound from 8695 would confirm ongoing ups
See all ideas
Displays a symbol's price movements over previous years to identify recurring trends.
Frequently Asked Questions
FTSE 100 Index reached its highest quote on Mar 3, 2025 — 8,908.86 GBP. See more data on the FTSE 100 Index chart.
The lowest ever quote of FTSE 100 Index is 1,018.86 GBP. It was reached on Nov 20, 2008. See more data on the FTSE 100 Index chart.
FTSE 100 Index is just a number that lets you track performance of the instruments comprising the index, so you can't invest in it directly. But you can buy FTSE 100 Index futures or funds or invest in its components.