Great Depression 2.0 Starting in 2030?Looking at the Dow Jones, we can see clear cycles forming on this index. I believe we could see one more major run on the Dow between now and 2030, followed by a repeat of the Great Depression. I could easily be wrong, but the charts suggest this is a very real possibility.
So, between now and our potential top in 2030, we have an opportunity to make a significant amount of money in markets like crypto.
As always, stay profitable.
– Dalin Anderson
US30 trade ideas

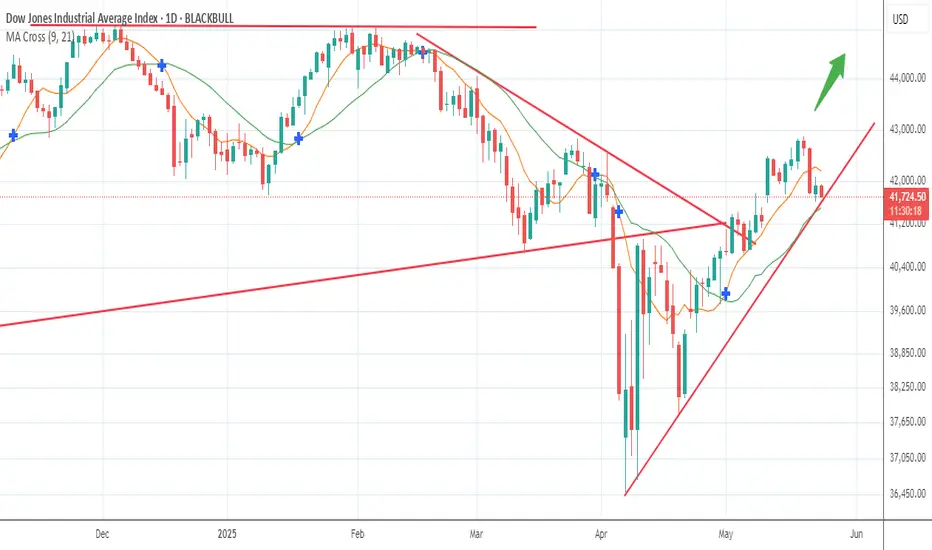
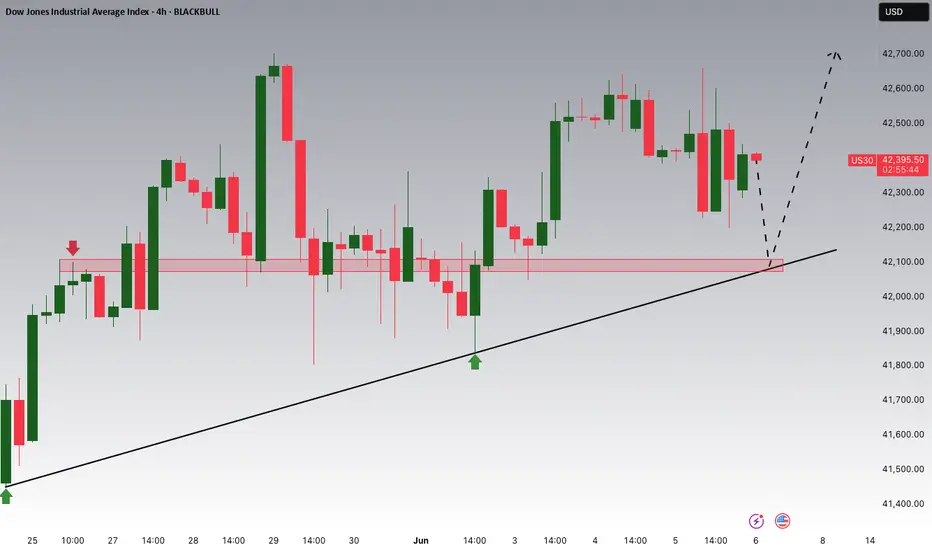
Bull Run To New Highs?The Dow got slammed on Wednesday, down 2%, no follow through yesterday.
Despite all the look of this rally being a bounce to sell, notice the uptrend line of support developed, this is the dynamics of markets, morph and twist to shake out weaker hands.
Would not be surprised to see a resumption of this rally to all time highs into June/July, the tariff wobbles are gone for now, any firm close below the trend line changes the trend.
We buy this market now at support in prospect of a larger rally to resume.
Appreciate a thumbs up, Good Trading & God Bless you all!

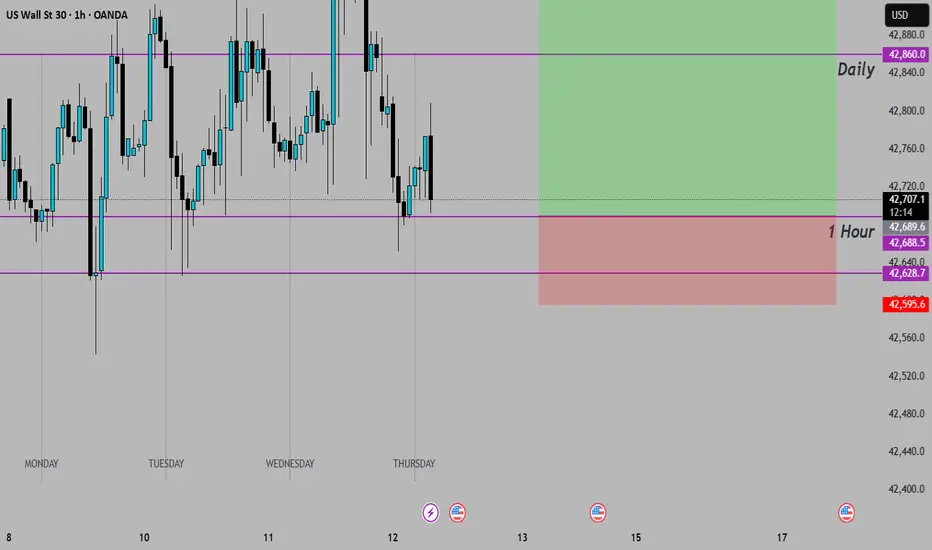
Wall Street Eyes Volatility: Dow Jones Tests Reversal ZoneUS30 (Dow Jones Index) — Clashing Forces of Risk & Reality
Technical Outlook — 16 June, 2025 | 1H Chart
Current Market Condition:
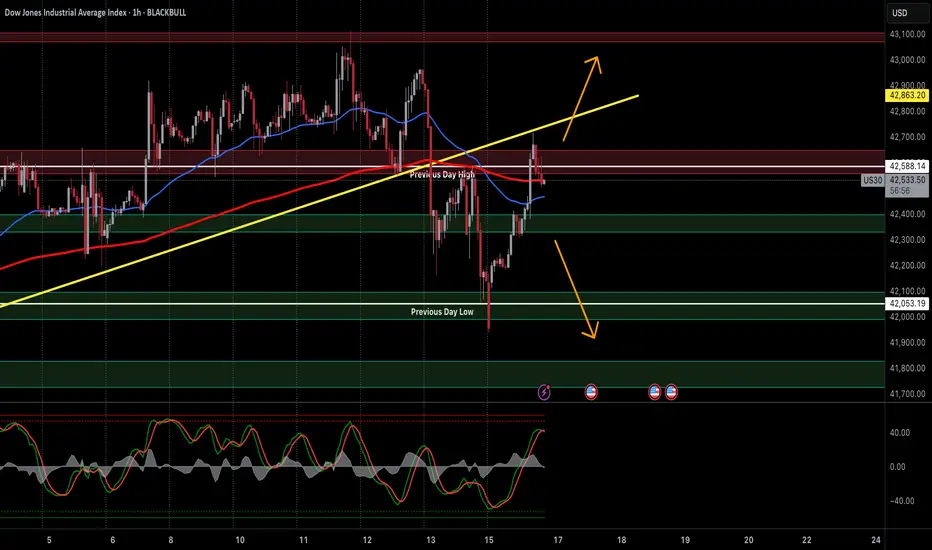
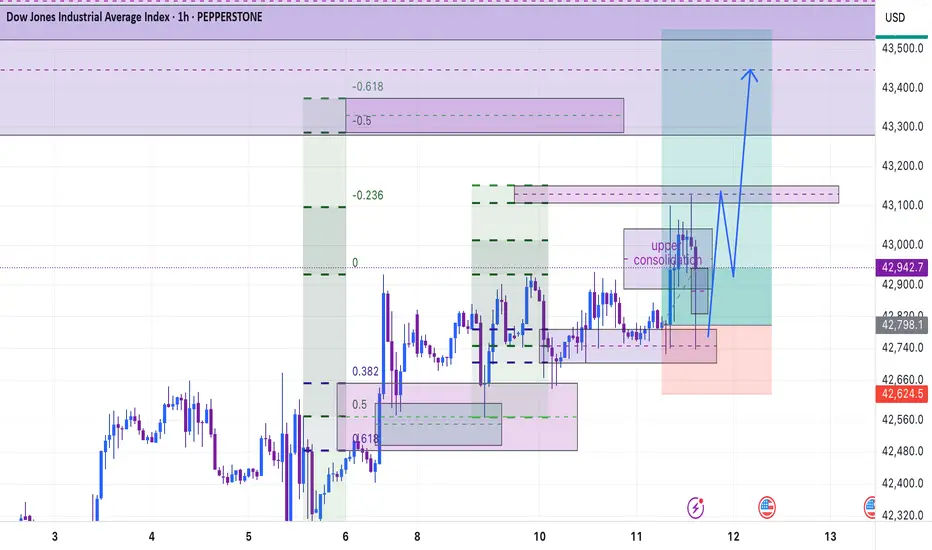
The Dow Jones (US30) has staged a recovery from the recent dip, but price is stalling at the Previous Day High (~42,588), a key confluence zone with the broken rising trendline, 50 EMA, and overhead supply.
This hesitation comes amid heightened global risk aversion triggered by the intensifying Iran–Israel conflict, adding pressure to global indices as investors rotate into safer assets like treasuries and gold. Despite intraday rebounds, equity bulls are showing signs of fatigue at resistance zones.
Markets are also bracing for upcoming US economic data and Fed commentary, which may further amplify intraday volatility.
Key Technical Highlights:
Price rejected from the confluence of PDH (~42,588), horizontal supply zone, and old rising trendline (yellow).
Currently hovering just under the 50 EMA; failure to hold could initiate a rotation back toward PD Low.
Stochastic RSI nearing overbought — suggests possible local top if no momentum breakout follows.
EMA 200 and the Previous Day Low at ~42,053 remain critical intraday supports.
Overall structure forming potential lower high under bearish macro cloud.
Trade Plan:
🔼 Bullish Breakout (Intraday Long):
Trigger: Break and sustained hold above 42,600 with rising volume
Target: 42,900 → 43,100
Stop Loss: Below 42,450 (to avoid whipsaws)
🔻 Bearish Rejection (Intraday Short):
Trigger: Clean rejection from PDH + trendline with bearish engulfing
Target: 42,100 → 42,050 → 41,850
Stop Loss: Above 42,650
⚖️ Neutral / Range Trade:
Play the range between PDH (~42,588) and PDL (~42,053) until breakout.
Scalp based on price reaction at either boundary with tight stop loss.
🛡️ Risk Management Note:
Global uncertainty tied to war escalation and Fed policy expectations make this a headline-driven market. News risk can spike volatility and invalidate technical setups. Trade with reduced size and increased caution, especially around US market open and geopolitical news cycles.
📢 If you found this analysis valuable, kindly consider boosting and following for more updates.
⚠️ Disclaimer: This content is intended for educational purposes only and does not constitute financial advice.
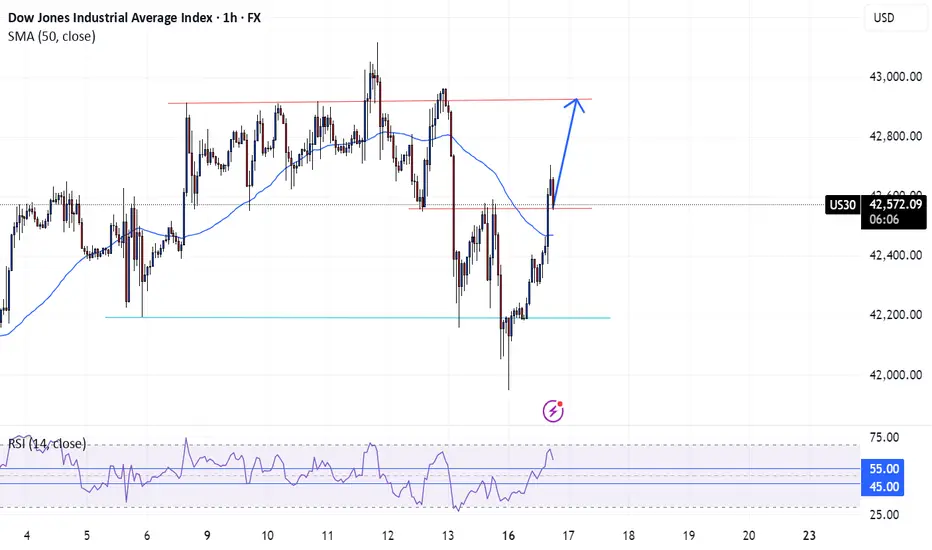
US30 Long OpportunityUS30 had a break out to the upside from $42560 and we are not seeing a potentially retracement to the break and retest level where we can expect a further jump to the upside. Seeing bullish structure on the 15 min and higher timeframes with confluence at the breakout.
Price is currently above the 50 SMA on all timeframes above the 15min and momentum is bullish per the RSI trading above the 55 level, adding to the bullish confluence
Looking to the ride the bullish wave from $42560 to $42920 where currently resistance level is sitting
Bulls game over now 35697 incoming Short from 43000 Tp 35697.. weekly TF down move incoming.. Bulls Fasten your seatbelt please... Good luck and safe trade

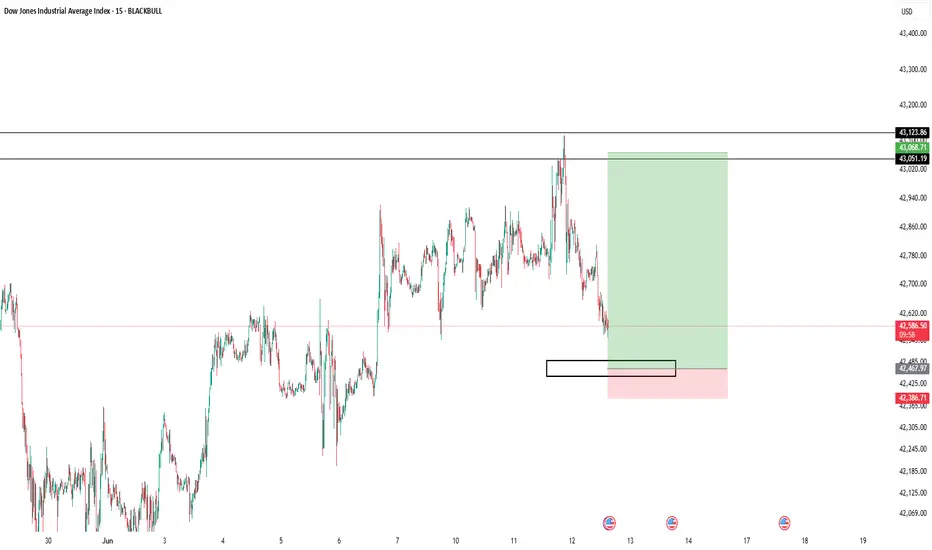
US30 Breakout Watch: 43,300 or Bust?US30 (Dow Jones) — Price Tests Key Fib Support with Breakdown Risk
Technical Outlook — 12 June, 2025
Current Market Condition:
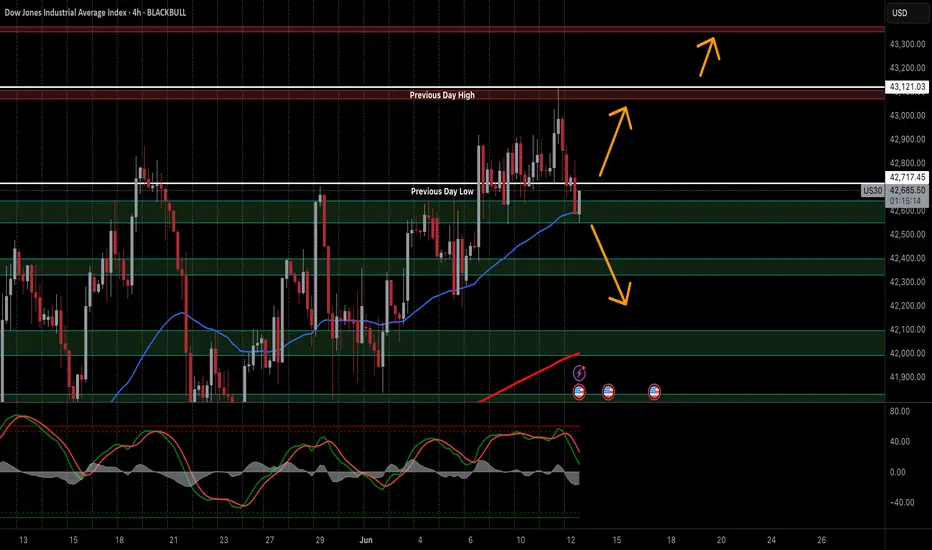
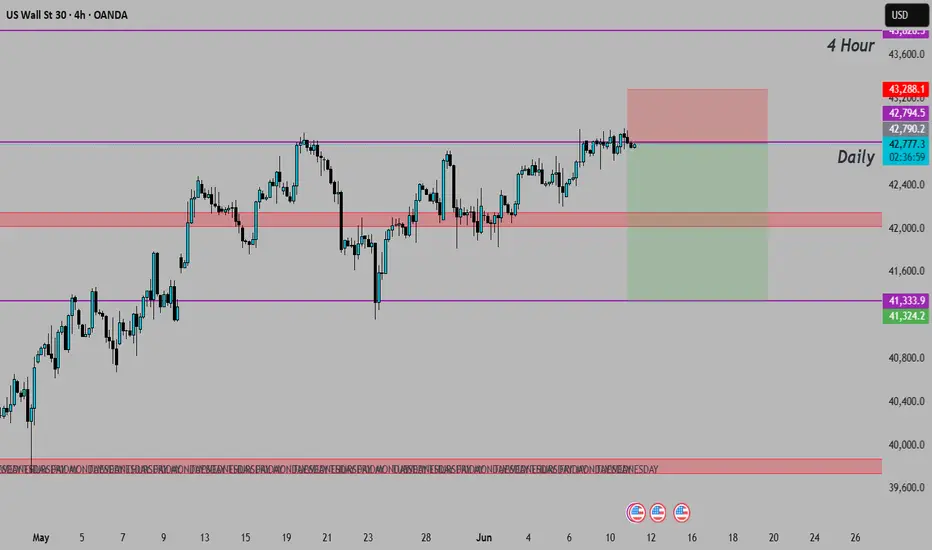
US30 (Dow Jones Industrial Average) is currently trading around 42,661 on the 4-hour timeframe, up +0.17% for the session. After rejection at the Previous Day High (43,121), price is now pulling back and testing the Previous Day Low around the 42,660 region, which also aligns with a Fibonacci confluence zone and the 50 EMA. This zone is acting as a last line of defence for bulls — if held, a push toward new highs remains on the table. However, a confirmed break could see the index slide further toward deeper support levels.
Key Technical Highlights:
Price is testing a major fib-based support cluster around 42,600–42,700, aligning with the Previous Day Low and 50 EMA.
The Stochastic Oscillator has crossed bearish from the overbought region and is now heading down, indicating short-term bearish momentum.
Resistance is now PDL and next one at 43,121 (PDH) and a break above this level would confirm bullish continuation.
Trade Plan:
✅ 1. Bullish Breakout (Long) – Most Probable if Support Holds
Trigger: Bullish candle or engulfing pattern above 42,660–42,700 zone with volume confirmation
Target: 43,121 (PDH) → 43,300
Stop Loss: Below 42,500
⚠️ 2. Bearish Rejection (Short) – Viable if Fib Zone Breaks
Trigger: 4H candle closes below 42,600 with bearish confirmation
Target: 42,300 → 42,100 → 41,900
Stop Loss: Above 42,800
📉 3. Dip Buy Setup – Least Probable but High RR Opportunity
Trigger: Price dips into 42,100 or 41,900 zone and forms a strong bullish reversal pattern (e.g., pin bar, bullish divergence on Stochastic)
Target: Bounce back toward 42,600–42,800
Stop Loss: Below 41,800
Risk Management:
Use conservative lot sizing and set clear stop losses to avoid whipsaw risk. With macroeconomic data and news expected this week, watch for volatility spikes. Always let the setup confirm before entry, especially near fib-based support or resistance zones.
📢 If you found this analysis valuable, kindly consider boosting and following for more updates.
⚠️ Disclaimer: This content is intended for educational purposes only and does not constitute financial advice.
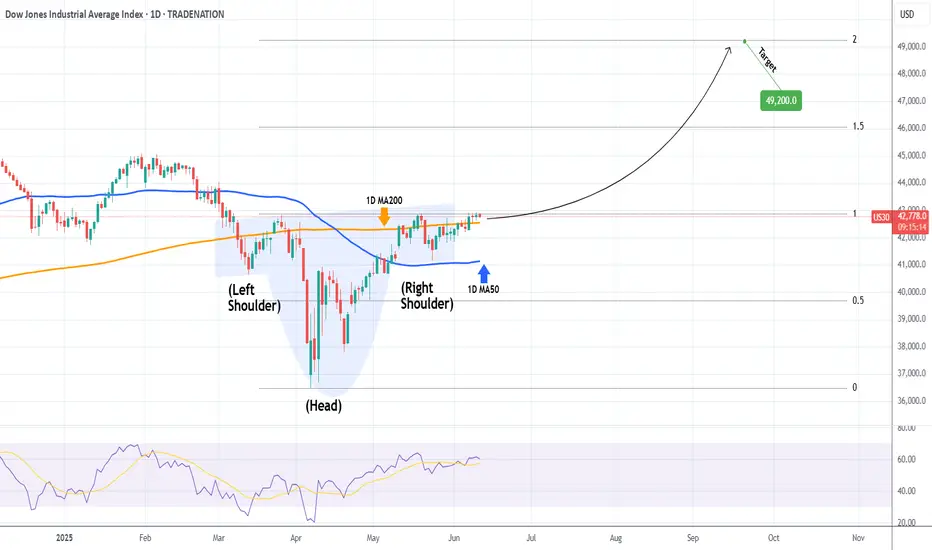
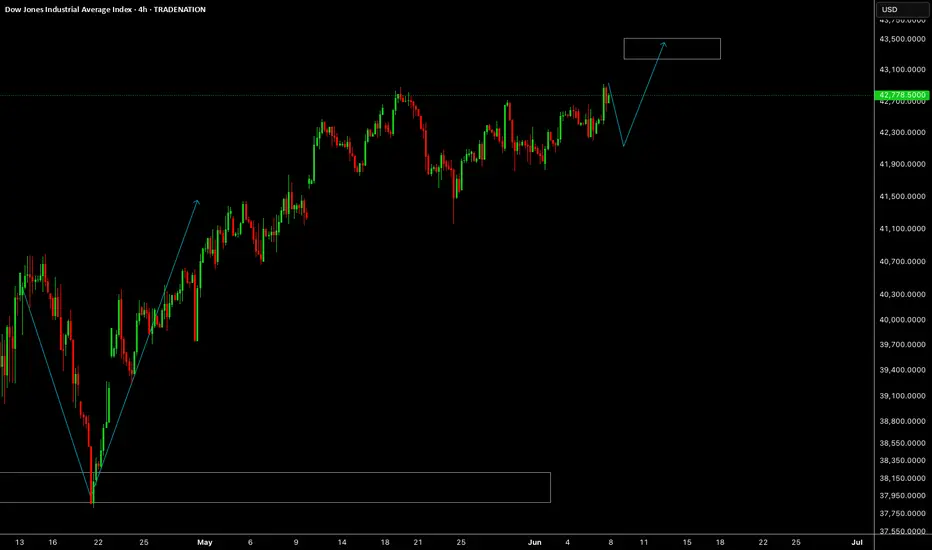
DOW JONES Inverse Head and Shoulders close to a bullish breakoutDow Jones (DJI) has completed an Inverse Head and Shoulders (IH&S) pattern, having formed the Right Shoulder supported by the 1D MA50 (blue trend-line).
The price is now slowly rising to test the upper neckline and if broken, expect a strong movement upwards. Technically, such patterns target their 2.0 Fibonacci extensions. The current one is at 49200 and that's our long-term Target. If you seek lower risk, you may target the 1.5 Fib extension.
-------------------------------------------------------------------------------
** Please LIKE 👍, FOLLOW ✅, SHARE 🙌 and COMMENT ✍ if you enjoy this idea! Also share your ideas and charts in the comments section below! This is best way to keep it relevant, support us, keep the content here free and allow the idea to reach as many people as possible. **
-------------------------------------------------------------------------------
Disclosure: I am part of Trade Nation's Influencer program and receive a monthly fee for using their TradingView charts in my analysis.
💸💸💸💸💸💸
👇 👇 👇 👇 👇 👇
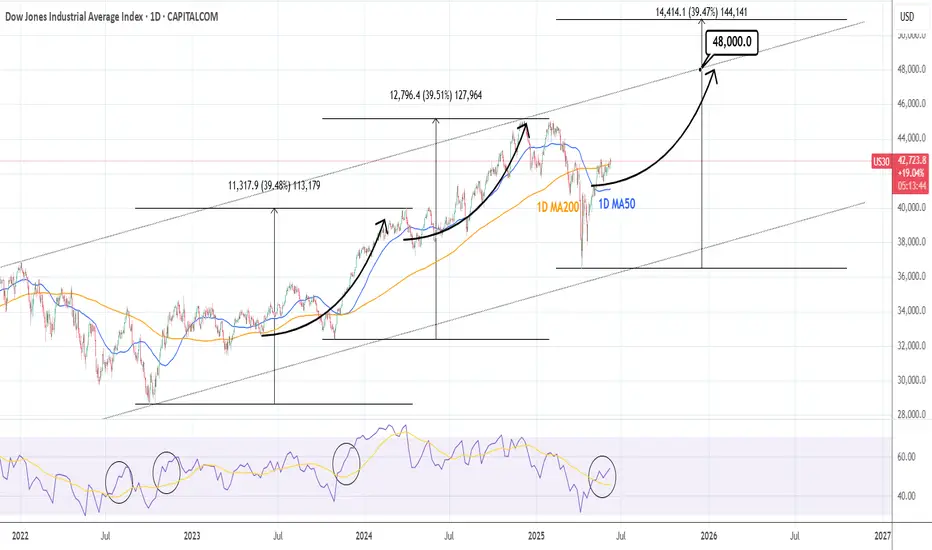
DOW JONES: Turning sideways for summer. Massive rise afterwards.Dow Jones is bullish on its 1D technical outlook (RSI = 58.389, MACD = 425.040, ADX = 23.083) but 1W is neutral, a natural outcome of the ranged trading within the 1D MA200 and 1D MA50in the last 3 weeks. It is possible to see the index staying sideways until the end of August and then attempt to complete a +39.50% rise from its bottom, like both prior bullish waves did. Regardless of this a test of the Channel Up top trendline, gives us a fair TP = 48,000 for the end of the year.
## If you like our free content follow our profile to get more daily ideas. ##
## Comments and likes are greatly appreciated. ##
Dow Jones Index Rises Towards Key ResistanceDow Jones Index Rises Towards Key Resistance
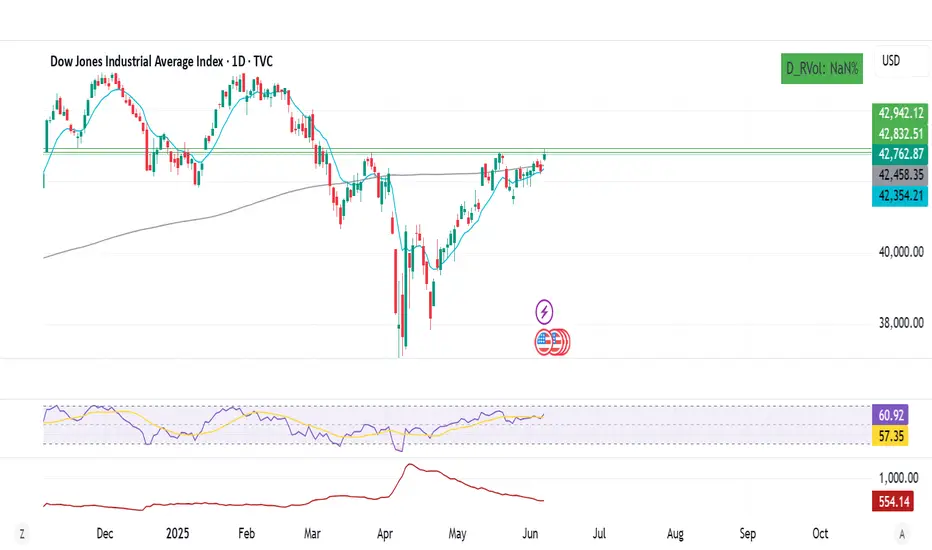
On Friday, the Dow Jones Industrial Average (Wall Street 30 mini on FXOpen) climbed above the 42,950 level — a high not seen since early March.
The index has gained around 1.6% since the beginning of June.
Why Is the Dow Jones Rising?
→ Friday’s US jobs report helped ease concerns about the country’s economic outlook. According to ForexFactory, Non-Farm Employment Change came in at +139K, beating the forecast of +126K.
→ On Thursday, Donald Trump and Chinese President Xi Jinping held a call, easing tariff tensions. Market participants also welcomed news that officials may hold trade negotiations in London on 9 June.
Could the DJIA (Wall Street 30 mini on FXOpen) Rally Continue?
Technical Analysis of the Dow Jones Chart
The chart suggests that the 42,950 level is acting as a significant resistance. The price has repeatedly reversed from the 42,660–42,950 area (as shown by the arrows).
At the same time:
→ Friday’s move above 42,950 triggered selling pressure, forming a candlestick with a long upper shadow;
→ This may have been a false bullish breakout of the May high;
→ The price remains within an ascending channel (shown in blue), but the bounces off the lower boundary appear weak.
Given this setup, it is reasonable to assume that intensified bearish activity near 42,950 on the USA30 could lead to a breakout below the channel’s lower boundary.
Additional pressure on the Dow Jones Industrial Average (Wall Street 30 mini on FXOpen) may come from developments in California, where protests have erupted against immigrant deportations, with President Donald Trump and Governor Gavin Newsom trading accusations.
This article represents the opinion of the Companies operating under the FXOpen brand only. It is not to be construed as an offer, solicitation, or recommendation with respect to products and services provided by the Companies operating under the FXOpen brand, nor is it to be considered financial advice.

US30 Technical Analysis Based on the Dow Jones Industrial Average (US30) chart as of June 8, 2025, here is a brief technical analysis to assess a buy or sell position:
Key Observations:
Current Price: 42,781.3 (closing price), down -0.23% for the day.
Technical Levels:
Nearby Resistance: 42,888.0 (daily high) and 43,324.1 (intermediate level).
Immediate Support: 42,532.9 (lower level) and 42,150.1 (key support).
Psychological Levels: 43,000 (resistance) and 42,000 (support).
Overall Trend:
The price is trading in a range between 42,150.1 and 43,324.1, with slight recent downward pressure.
Moving averages or other indicators are not visible on this chart, but the volume (63.24K) appears moderate.
Possible Scenarios:
Buy (Long):
If the price bounces from support at 42,532.9 or 42,150.1 with increasing volume, a rebound toward 43,000 is possible.
A breakout above 42,888.0 (daily high) could confirm bullish momentum.
Sell (Short):
If the price breaks below 42,150.1, it could open the door to 41,000.0 (major support).
The weak daily performance (-0.23%) and failure to sustain gains might indicate temporary weakness.
Recommendation:
Wait for Confirmation:
For a buy, watch for a bounce from the mentioned support levels with rising volume.
For a sell, wait for a clear breakdown below 42,150.1.
Risk Management: Place a stop-loss below 42,000 for a buy or above 43,000 for a sell.
Note: Without additional technical indicators (RSI, MACD, etc.), this analysis is based on visible price levels. Use other tools to refine your strategy.
📌 Prioritize trades aligned with the overall trend (currently neutral to slightly bearish on this timeframe).
Let me know if you'd like any further refinements!

Dow Jones Potential UpsidesHey Traders, in today's trading session we are monitoring US30 for a buying opportunity around 42,100 zone, US30 is trading in an uptrend and currently is in a correction phase in which it is approaching the trend at 42,100 support and resistance area.
Trade safe, Joe.
US30 Analysis: Liquidity Dip or Deeper Correction?📉 US30 (Dow Jones) Trade Idea 📉
Currently analysing US30 – the Dow Jones Index 🏛️, and there are some key developments worth noting…
On the 4-hour timeframe, we’re observing a clear shift in market structure, with price breaking through previous lows ⚠️. This raises two possibilities:
🔹 It could be a liquidity grab before a rally 🚀
🔹 Or, it may be the beginning of a deeper end-of-week sell-off targeting levels below 🔻
At this stage, I’m watching for a potential counter-trend short position — but only if the conditions outlined in the video are met with precision 🎯.
🧠 As always, it’s about waiting for confirmation, not jumping in early. Disciplined execution is key. 🧩💼
⚠️ Disclaimer: This is not financial advice. The information provided is for educational purposes only. Always do your own analysis and manage risk accordingly.

US30 ShortMy take on us30 for the next couple of days is for it to push downwards.. I'll Keep updating on this trade
US30 Update bullish📊 US30 Update 🚀
Great job team! ✅ Our first TP was hit 🎯 and we’ve now secured our second entry after a solid retracement back to our initial zone. This is a strong buy-back opportunity, and momentum is building up again! 🔥
We’re now expecting a push towards our second TP at 43,300. 📈 Stay sharp and remember:
🧠 Trade smart,
📉 Manage your risk,
💰 No oversized lot sizes — let the setup do the work.
Let’s keep winning! 💪
#US30 #CPI #TP1Hit #SecondEntry #ForexTraders #SmartTrading #TeamWork
DJIDJI in an interesting spot. It's at a strong resistance and if we make it above, DJI can slowly recover to the 45k levels. If now, we can see a short potential 42620 level. One can short DIA.
Dow Jones Struggles to Reach 43,000 PointsThe Dow Jones has gained more than 1% over the last three trading sessions and is now attempting to consistently reach price levels not seen since March of this year. The bullish bias has remained steady as investor confidence has recovered, driven by ongoing economic negotiations between the United States and China. The potential easing of trade tensions has helped stabilize market sentiment in the short term, and if this trend continues positively, consistent buying pressure could emerge in the index's movements over the near term.
Sustained Uptrend
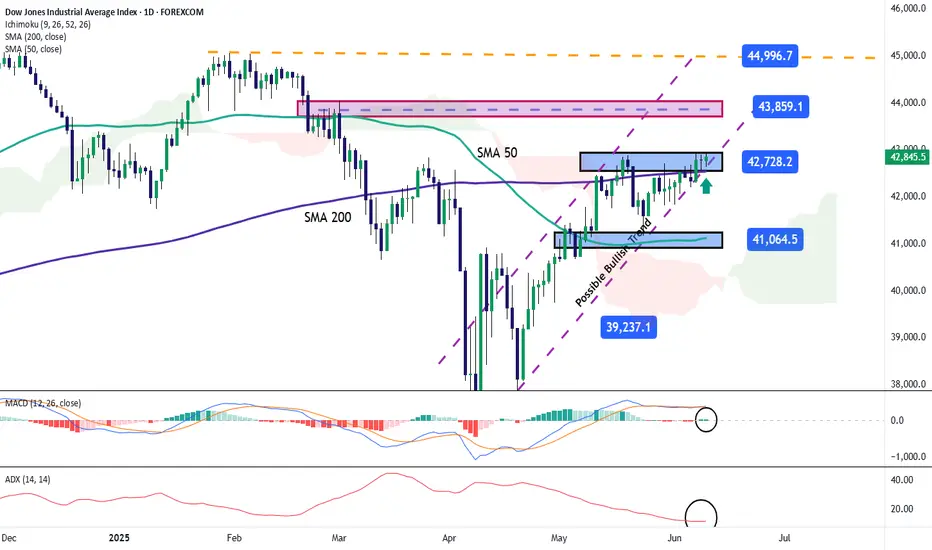
Since early April, the Dow Jones has maintained a steady upward trend, and so far, selling corrections have been insufficient to break that trend. However, price action continues to face resistance at the trendline, and if this ongoing neutrality persists, the trendline could come under pressure in the coming sessions.
MACD
The MACD histogram continues to oscillate very close to the neutral 0 line, indicating that momentum between the moving averages remains balanced. As long as this behavior persists, the current neutral tone could become even more pronounced in upcoming sessions.
ADX
The ADX line remains below the neutral 20 level in the short term, signaling that average volatility has been steadily decreasing over the past sessions. This has further intensified the market’s neutral tone near the current resistance zone where the price is trading.
Key Levels:
42,700 points: Current resistance zone, aligned with the recent multi-week highs. This level could become the base for a broader short-term consolidation.
43,800 points: A level not seen since February of this year. A return to this area could reinforce the bullish bias and support a more sustained upward trend.
41,000 points: A critical support level that coincides with the 200-day simple moving average. A move toward this level on the downside could threaten the current bullish structure.
Written by Julian Pineda, CFA – Market Analyst
US30US30 getting ready for another push up towards 43.5K.
Disclosure: We are part of Trade Nation's Influencer program and receive a monthly fee for using their TradingView charts in our analysis.
DowJones INTRADAY important support retest Key Support and Resistance Levels
Resistance Level 1: 43190
Resistance Level 2: 43620
Resistance Level 3: 44290
Support Level 1: 42100
Support Level 2: 41420
Support Level 3: 40990
This communication is for informational purposes only and should not be viewed as any form of recommendation as to a particular course of action or as investment advice. It is not intended as an offer or solicitation for the purchase or sale of any financial instrument or as an official confirmation of any transaction. Opinions, estimates and assumptions expressed herein are made as of the date of this communication and are subject to change without notice. This communication has been prepared based upon information, including market prices, data and other information, believed to be reliable; however, Trade Nation does not warrant its completeness or accuracy. All market prices and market data contained in or attached to this communication are indicative and subject to change without notice.

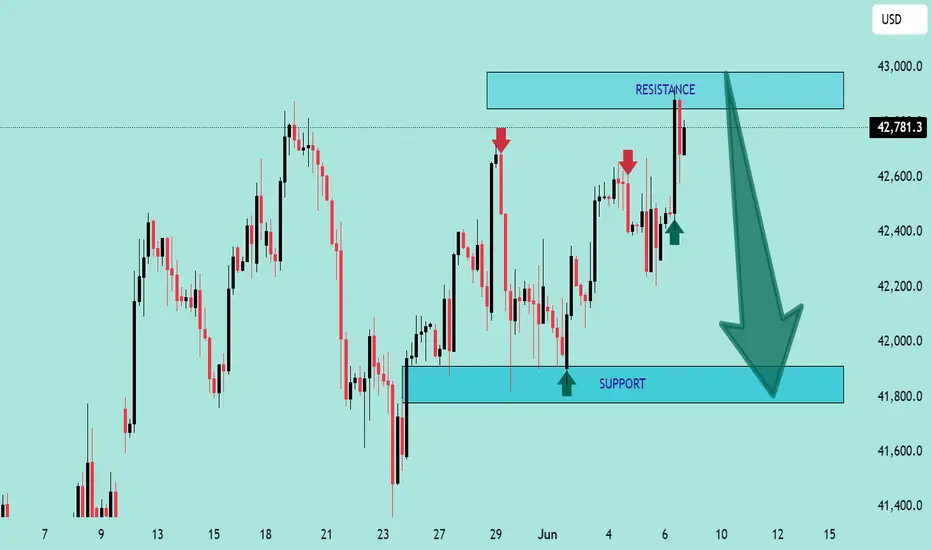
US30 Technical Analysis – 8th June 2025c US30 Technical Analysis – 8th June 2025
🔍 Chart Overview:
The chart shows a classic range-bound structure with clearly defined support and resistance zones.
📍 Key Zones:
🔼 Resistance Zone: ~$42,900 – $43,000
Marked by multiple rejections (🔴 red arrows).
Price has failed to close above this area convincingly.
Sellers are actively defending this level.
⚠️ Bearish pressure likely to increase if price stays below this level.
🔽 Support Zone: ~$41,750 – $41,850
Marked by strong bullish reactions (🟢 green arrows).
Buyers have stepped in consistently in this demand zone.
A breakdown below this level could trigger further downside momentum.
📈 Current Price Action:
The price is hovering around $42,781.3, just below the resistance zone.
The latest candlestick shows rejection from the top, forming a bearish wick, indicating potential reversal pressure.
The large downward arrow (⬇️) on the chart suggests a bearish bias is expected by the analyst.
📉 Outlook & Strategy:
🔻 Bearish Scenario (High Probability):
If price fails to break and sustain above $43,000, expect a move back down towards the support zone at ~$41,800.
A breakdown below support could lead to deeper downside, targeting $41,500 or lower.
🛑 Invalidation:
A clean breakout and daily close above $43,000 would invalidate the bearish setup and suggest potential continuation higher.
🎯 Trading Tips:
🔹 Short Bias: Look for short entries near resistance with tight stops above $43,000.
🔹 Target: $42,200 → $41,800
🔹 Risk Management: Always maintain a good risk-to-reward ratio and use proper stop-loss.
📌 Conclusion:
⚠️ The chart favors a bearish reversal from resistance unless bulls can push decisively above $43,000. Traders should watch for rejection patterns or breakdown confirmations to align with the bearish move
US30: The Market Is Looking Down! Short!
My dear friends,
Today we will analyse US30 together☺️
The market is at an inflection zone and price has now reached an area around 42,877.4 where previous reversals or breakouts have occurred.And a price reaction that we are seeing on multiple timeframes here could signal the next move down so we can enter on confirmation, and target the next key level of 42,798.2..Stop-loss is recommended beyond the inflection zone.
❤️Sending you lots of Love and Hugs❤️
