Dow Jones Industrial Average Index forum
If the bulls attempt to cross the trendline by going up and to the right of it, the market bias would flip from bearish to bullish for the most profitable moves to be to the upside.
But if the bulls don't attempt a break of the trendline, then back down towards the Gap to potentially close at 41,330 with a candle close on that price or lower.
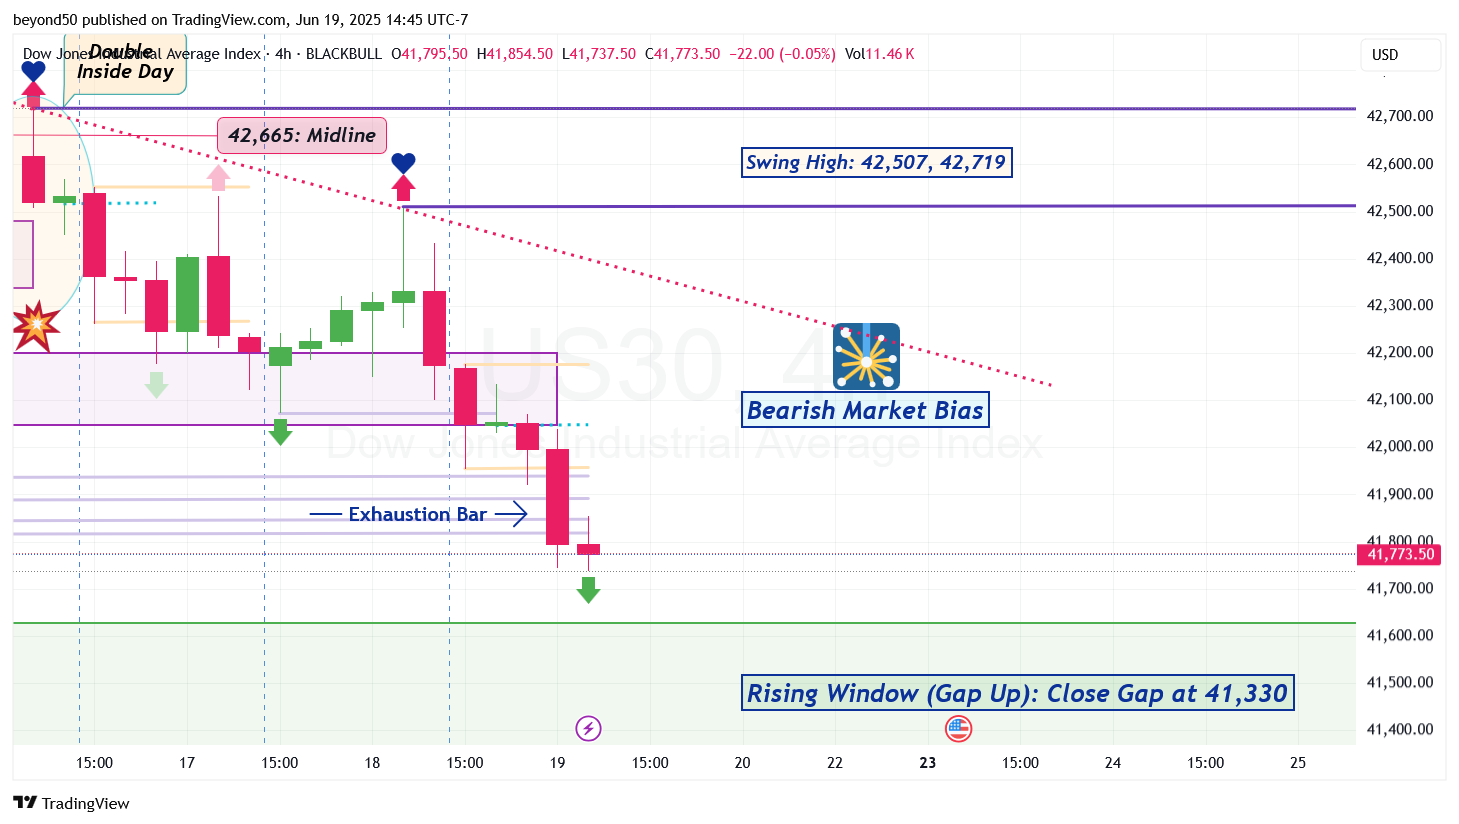
Looking at the Daily, it is in Bearish (directional) Market Bias. A Doji showed up within the bearish descent. The pattern is telling us that the drop can continue until a bottom reversal pattern shows up.
With a continuation of the bearish trend, that Gap may finally get closed with a candle close at 41,506 to continue downward and breach the Swing Low of 41,145. We'll see if it happens.
*Side Note:
If the bears drop down further in the trading days to come, it would be the 5th attempt at closing the Rising Window (Gap Up) that showed up on May 9th.
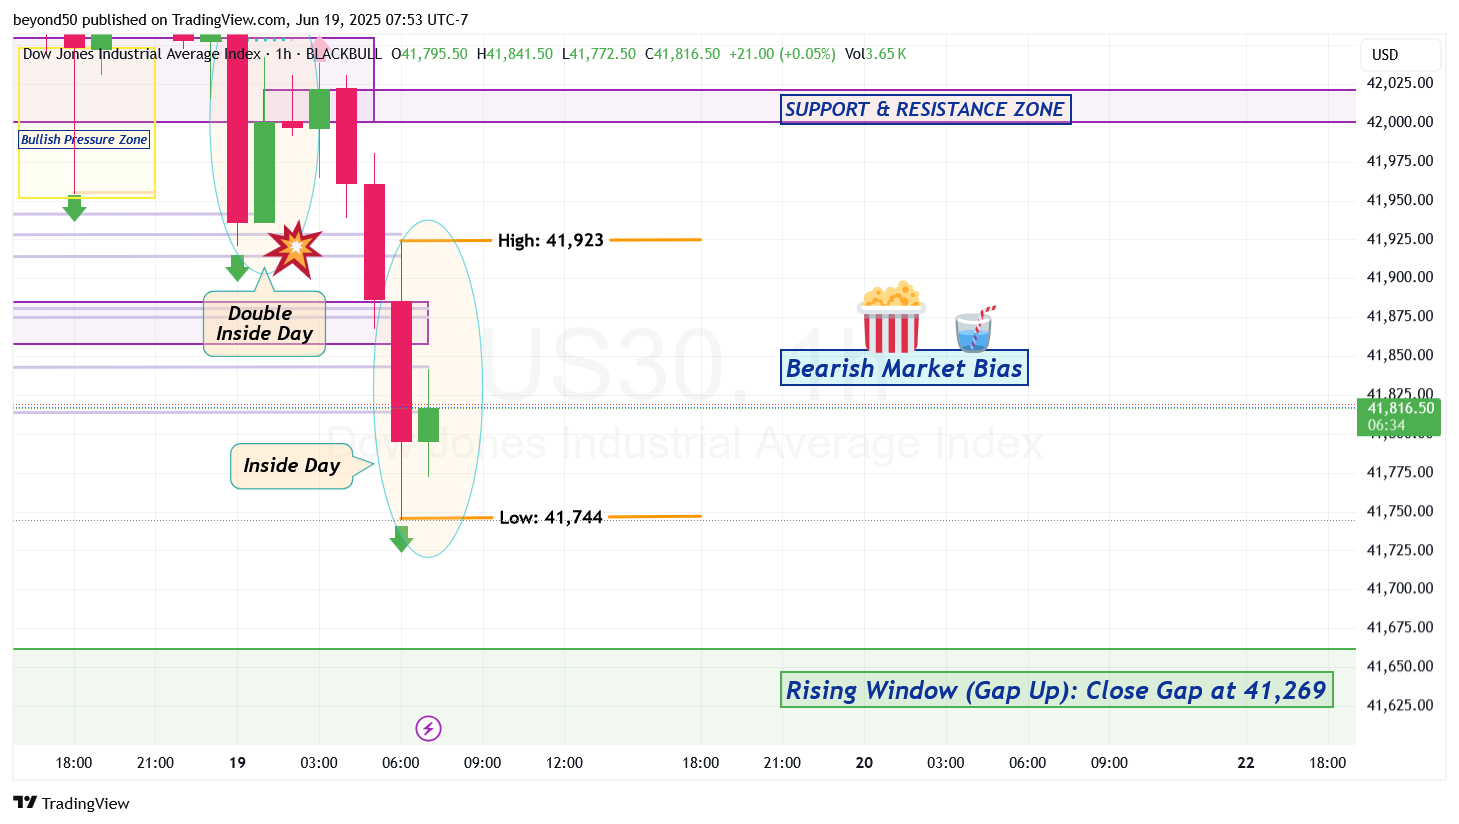
Also, a Double Inside Day appeared, so a very BIG move is coming this trading week or next that can look epic on the lower timeframes.
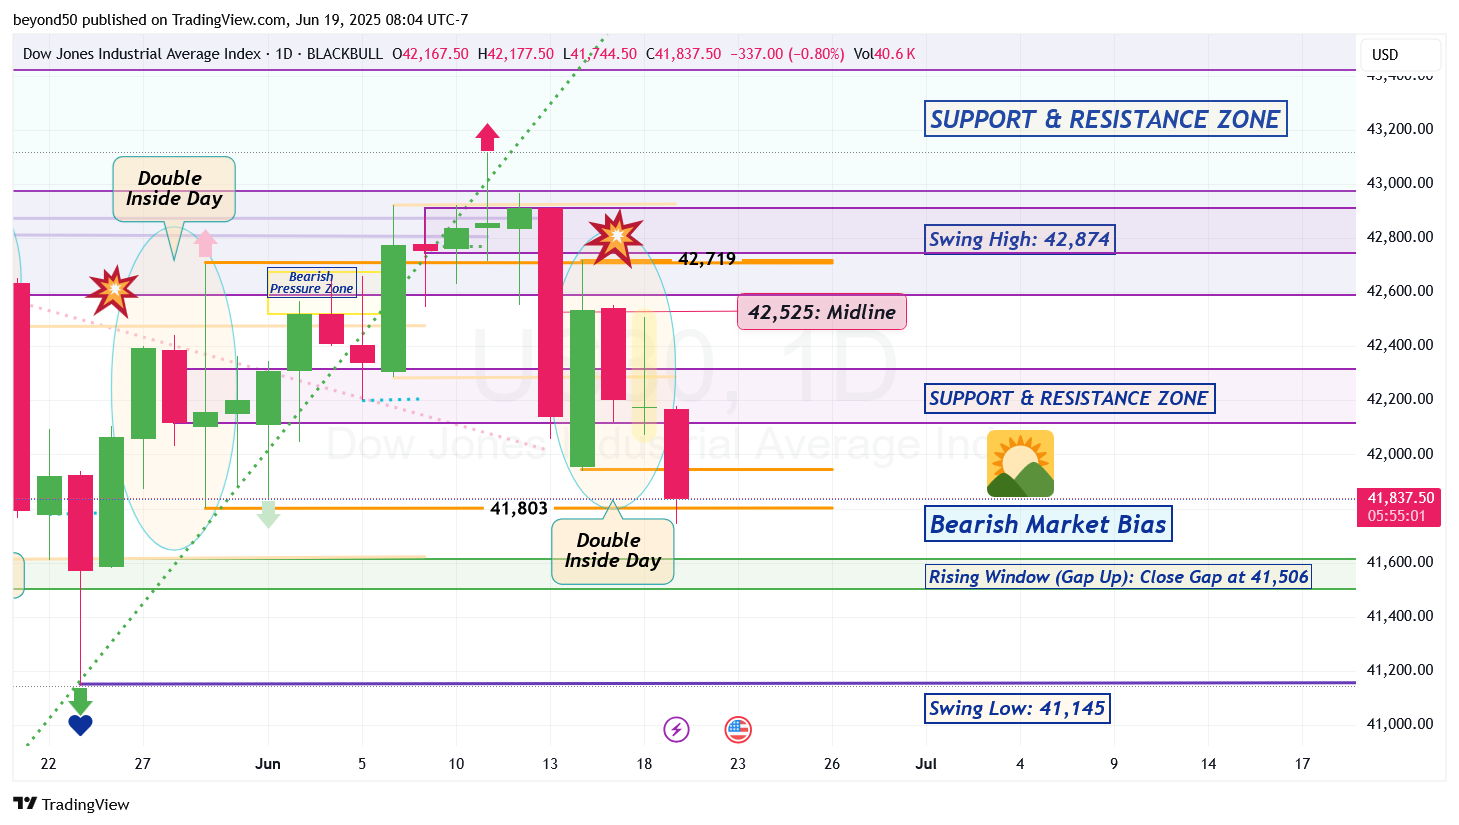
A Double Inside Day formed, which means that the market is in a pause with no clear direction. No surprise after the long and stunning drop. Price action will consolidate until a breakout from the pattern - either from the Inside Day's high of 41,923 or low of 41,744.
Also, a retrace is due from price action being in Oversold territory. It could be a shallow or proper retrace to 42,022 from Mean Reversion. Watch to see if the bulls can cross through the S&R Zone (that starts at 42,000) above them to rise above it. If not, then the bears will take the market down again.