Short.With BTC.D at 65% and above (my target 72%), we reach the buy area below 0.06 easily.
Then we're gonna fly. Not willing to long only spot.
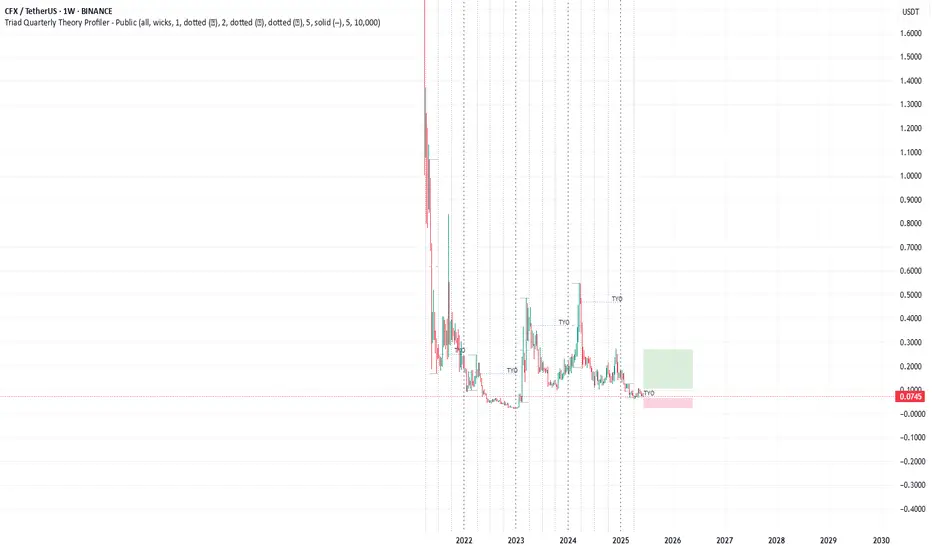
SPOT CFX LONG 12.06.2025Pinning after exhaustion of sales.
💰I enter at the market price.
I'll let you know when I record it manually.
‼️Risk per trade: 1% of the allocated funds for spot trading.
Thank you!

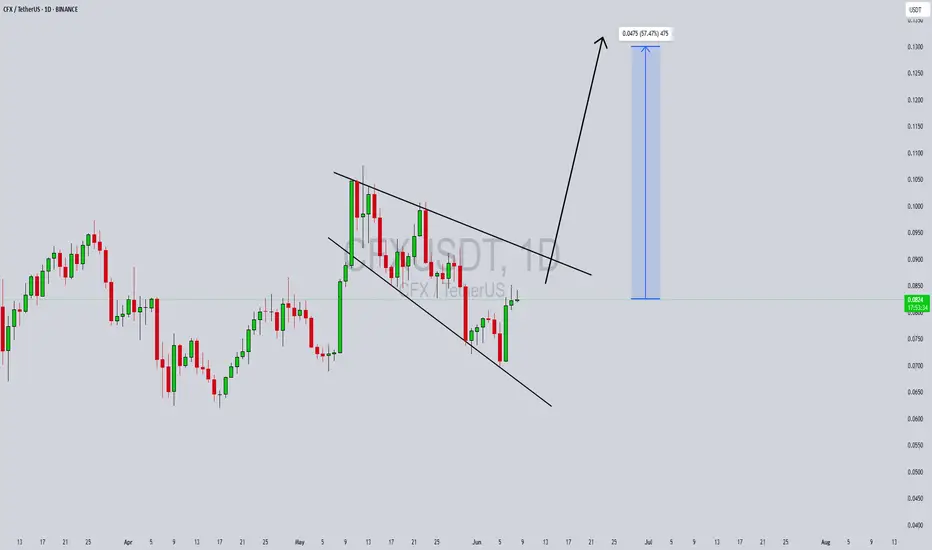
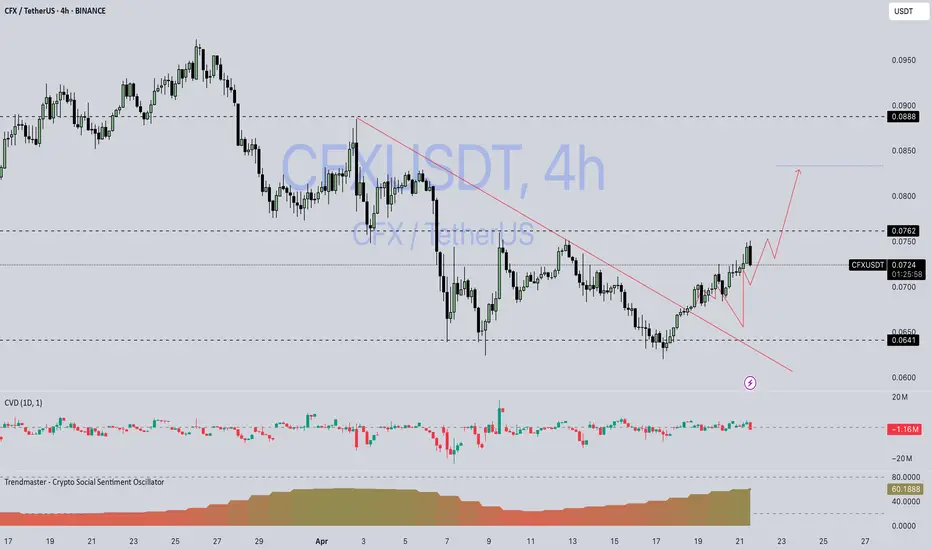
CFXUSDT Forming Falling WedgeCFXUSDT is showing signs of a strong bullish continuation as it emerges from a falling wedge pattern — a setup often considered a reliable reversal signal in technical analysis. As depicted in the chart, the price has been compressing within the wedge, gradually forming higher lows and now attemptin
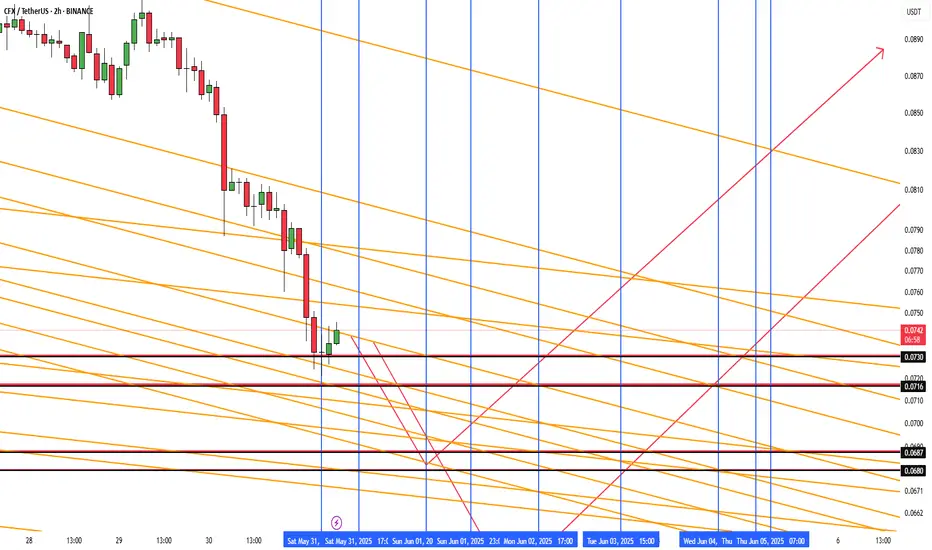
CFX/UsdtCFX/USDT — Gann Time & Price Confluence Zones
This is a 2-hour chart of CFX/USDT using W.D. Gann’s time and price forecasting methods. The analysis identifies key reversal zones based on both Gann angles and time cycles calculated from the Square of Nine.
🔷 Key Concepts:
Vertical Blue Lines = Gann
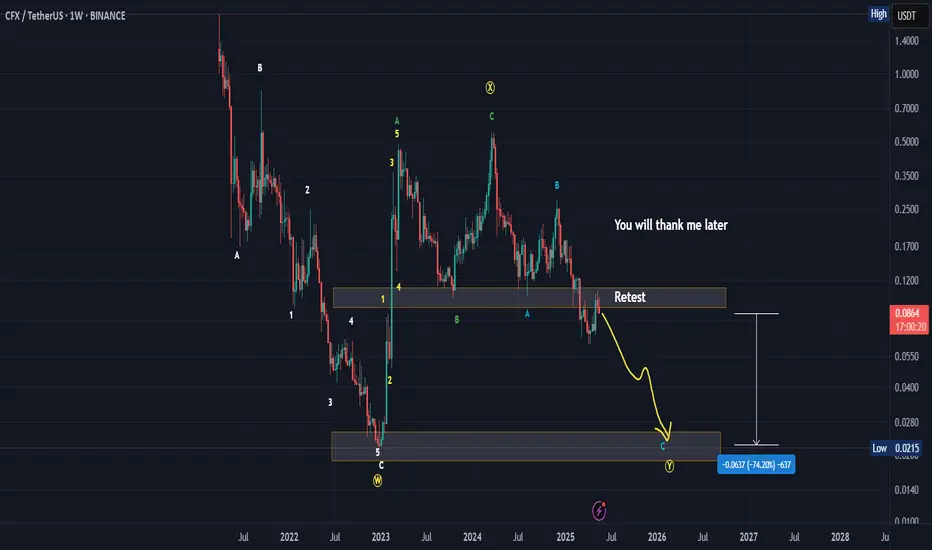
Next stepFrom the historical chart data, we find that there were three historical waves that fell, three historical waves that rose, and three historical waves that remained, compounded, in order for the shape to be wxy.
*In principle, I am not a supporter of any direction, but I am only giving my point of v
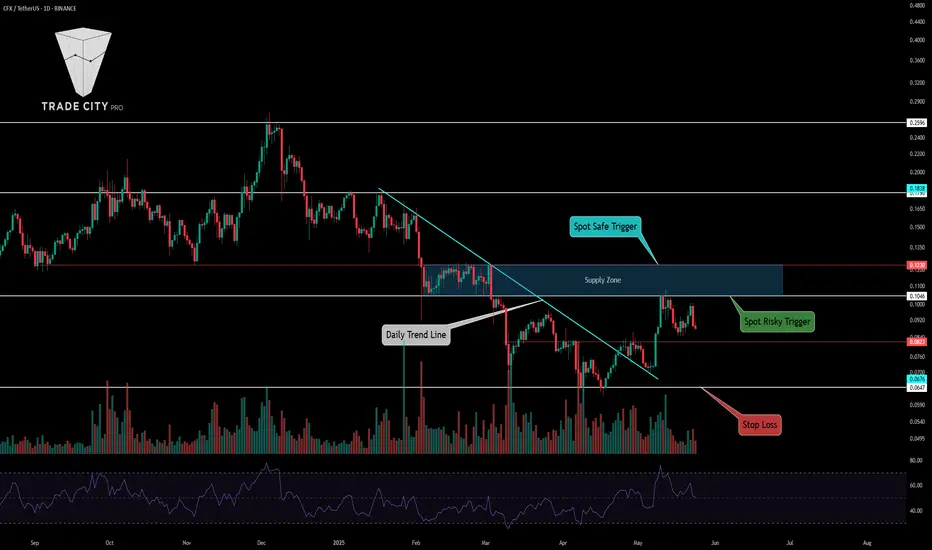
TradeCityPro | CFXUSDT A Wild Week of Volatility Ahead?👋 Welcome to TradeCityPro Channel!
Let’s dive in and analyze another altcoin in the market, CFX, which is likely to experience a highly volatile week ahead, offering great trading opportunities.
🌐 Overview Bitcoin
Before starting the analysis, I want to remind you again that we moved the Bitco
CFXUSDT | Sellers Still in ControlI’ve seen this pattern before. CFXUSDT is still under pressure from strong sellers , and nothing has shifted yet to flip the bias.
The red box remains a key resistance. Until that level is clearly broken and turns into support with a proper retest, there’s no reason to look bullish .
If you're

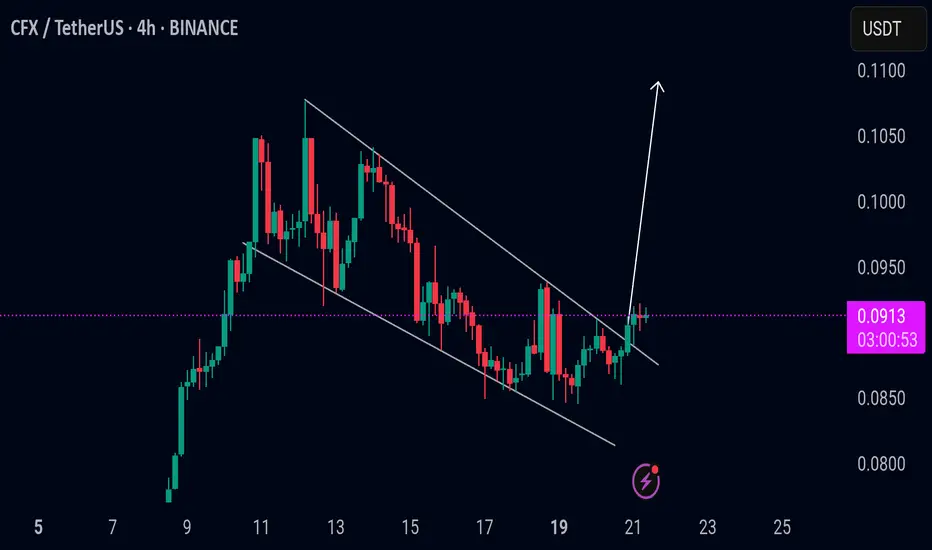
CFX/USDT BREAKOUT ALERT
CFX/USDT BREAKOUT ALERT
CFX/USDT has already broken out of the bull flag pattern and is showing bullish momentum. Since a bull flag is typically a continuation pattern, this breakout suggests the potential for further upside.
However, if the price drops back into the flag structure, it could turn
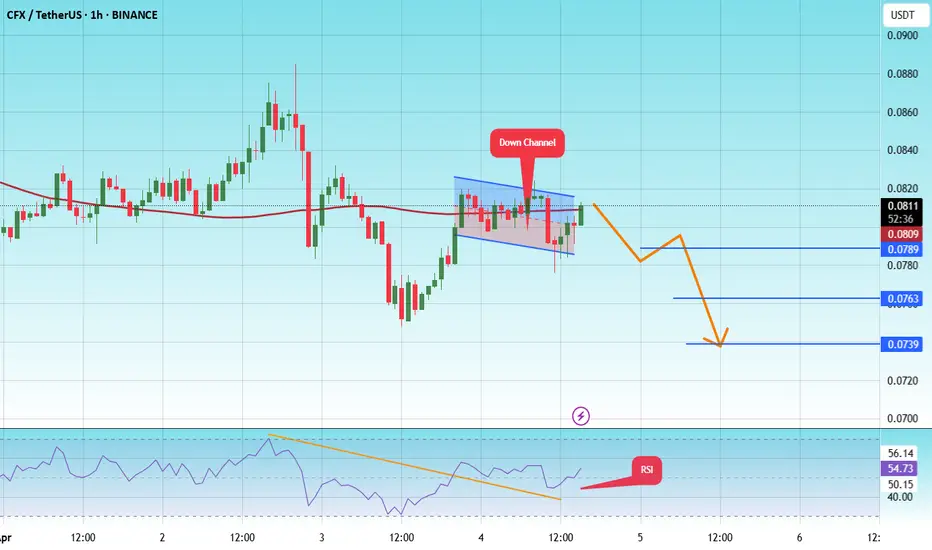
#CFX/USDT#CFX
The price is moving within a descending channel on the 1-hour frame and is expected to continue lower.
We have a trend to stabilize above the 100 moving average once again.
We have a downtrend on the RSI indicator that supports the decline with a break below.
We have a support area at the u
CFX/USDTBINANCE:CFXUSDT
Almost +10% up ✅
TP2 hit on the ✅
More on the way 📈
Enjoy the gains—just don’t get too greedy 😉🚀
Disclaimer : Not Financial Advice
See all ideas
Summarizing what the indicators are suggesting.
Oscillators
Neutral
SellBuy
Strong sellStrong buy
Strong sellSellNeutralBuyStrong buy
Oscillators
Neutral
SellBuy
Strong sellStrong buy
Strong sellSellNeutralBuyStrong buy
Summary
Neutral
SellBuy
Strong sellStrong buy
Strong sellSellNeutralBuyStrong buy
Summary
Neutral
SellBuy
Strong sellStrong buy
Strong sellSellNeutralBuyStrong buy
Summary
Neutral
SellBuy
Strong sellStrong buy
Strong sellSellNeutralBuyStrong buy
Moving Averages
Neutral
SellBuy
Strong sellStrong buy
Strong sellSellNeutralBuyStrong buy
Moving Averages
Neutral
SellBuy
Strong sellStrong buy
Strong sellSellNeutralBuyStrong buy
Displays a symbol's price movements over previous years to identify recurring trends.