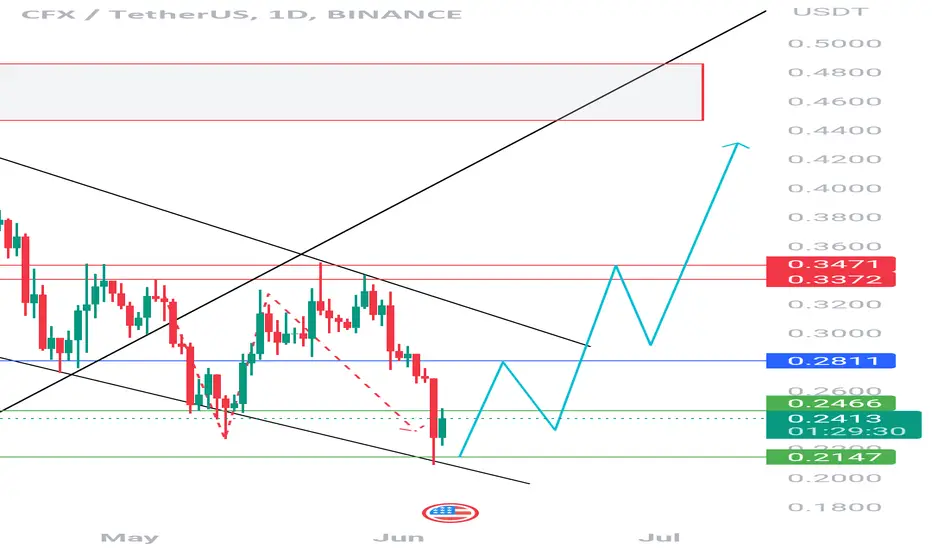
🚀 Explosive Crypto Alert! CFXUSDT Set to Skyrocket! 💎 Breakout Alert: Paradisers, CFXUSDT is teetering on the brink of a significant trendline breakout, indicating a potential momentum shift. Keep your eyes peeled for any drastic price action as a breakout could be just around the corner.
💎 Steady Price Action: If CFXUSDT manages to shatter the trendline and maintain its upward trajectory, it would validate the robustness of the potential bullish move. Keep a close watch on the price action for confirmation.
💎 Rising Volumes: Trading volumes for CFXUSDT are climbing, signaling heightened interest and engagement from market participants. Increased volumes often accompany bullish movements, offering additional support for an upward trend.
💎 Accumulation Phase: Before a potential breakout, CFXUSDT has been in an accumulation phase, where buyers have been soaking up selling pressure. This phase suggests a sentiment shift in the market, favoring the bulls.
💎 The Bottom Line: CFXUSDT is flashing promising signs of a bullish breakout. With a looming trendline breakout, steady price action, surging volumes, and the accumulation phase, the stage is set for a potential upward move. Stay alert and be ready to capitalize on the opportunity for significant gains!
Remember, Paradisers, conducting thorough research and exercising caution is crucial when making investment decisions. Happy trading!
CFXUSDT.P trade ideas

cfx getting ready for another massive bullish rally Seems Like Getting ready for Another Massive bullish Rally
Forming Bullish Pennant In Daily Timeframe Incase Of breakout Expecting Another 180 - 200% Bullish Wave

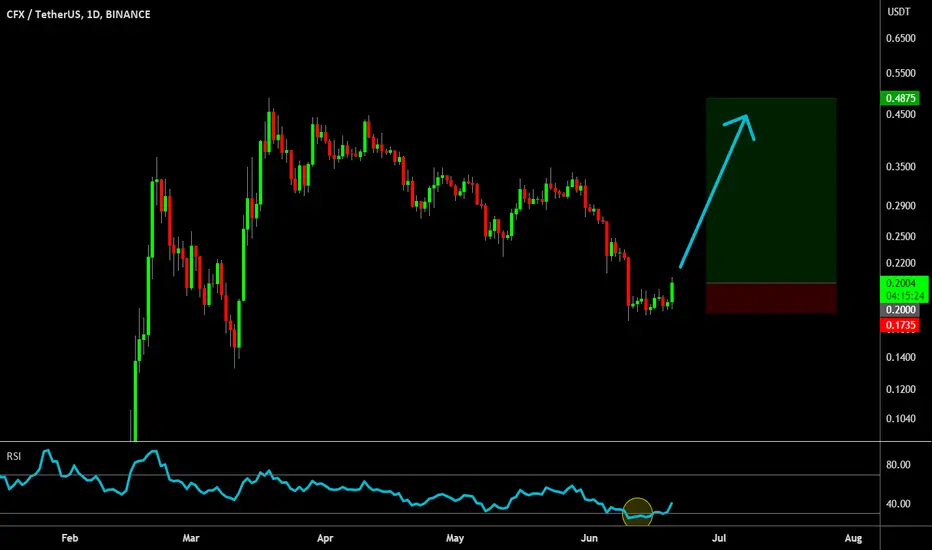
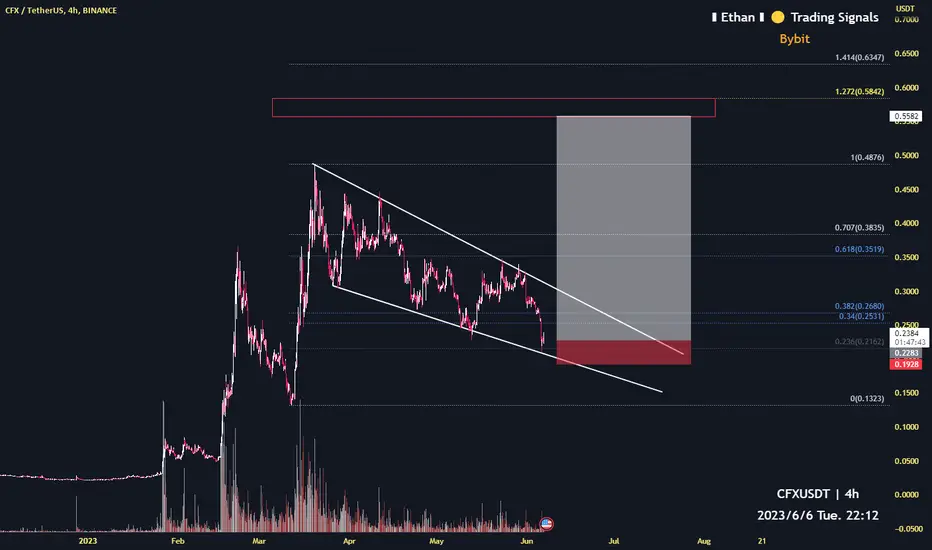
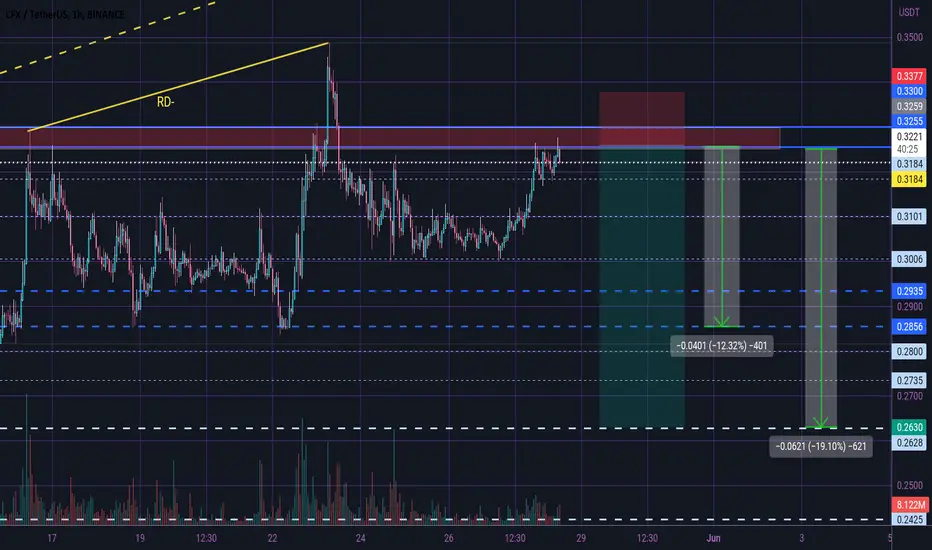
🔥 CFX Oversold Bounce Trade: Following BTC Up!CFX has been one of the bigger winners of 2023. However, this token has been largely trading bearish ever since it topped late March.
As of recently, CFX has hit daily oversold on the RSI for the first time in many months, likely causing some kind of reversal.
Now that BTC is breaking out, I'm anticipating that CFX will see more gains in the near future. Target is the 2023 high, stop under this daily candle. A less risky trade would be a stop under the June 9th lows and/or a (partial) target of 0.3
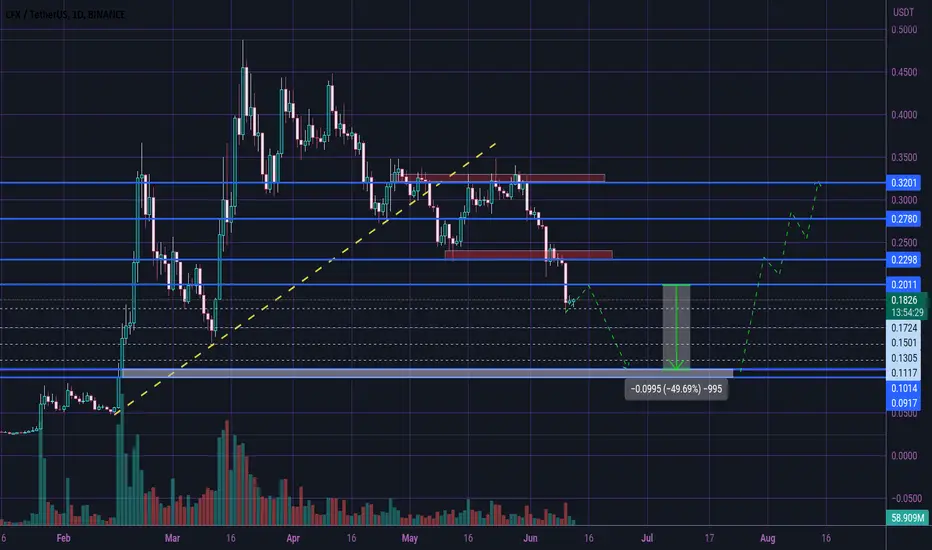
CFXUSDT.P Chart 6Looking for new rangebound of CFXUSDT.P
If clean break below recent month, we can look for short play around the levels shown.
Clean break below 0.2104 can entry short setup.
Acceptance of 0.2254 recent month low, show deviation.

wait for better and win morehello guys
i think its not a good breakout and its may fall a little bit more
but the little order block looks good area to open a long position.
but be aware from fundamental news before open your orders
The information provided on this Page does not constitute investment advice, financial advice, trading advice, or any other sort of advice and you should not treat any of the website's content as such. this page does not recommend that any cryptocurrency should be bought, sold, or held by you. Do conduct your own due diligence and consult your financial advisor before making any investment decisio

CFX possible Daily Movement 😎♻️😎♻️Hi dear traders
Considering the downward momentum of the price, we expect the price to decrease to the psychological zone of 0.1.
Let's see what happens
All targets specified
This is not financial advice ( DYOR )
Good luck
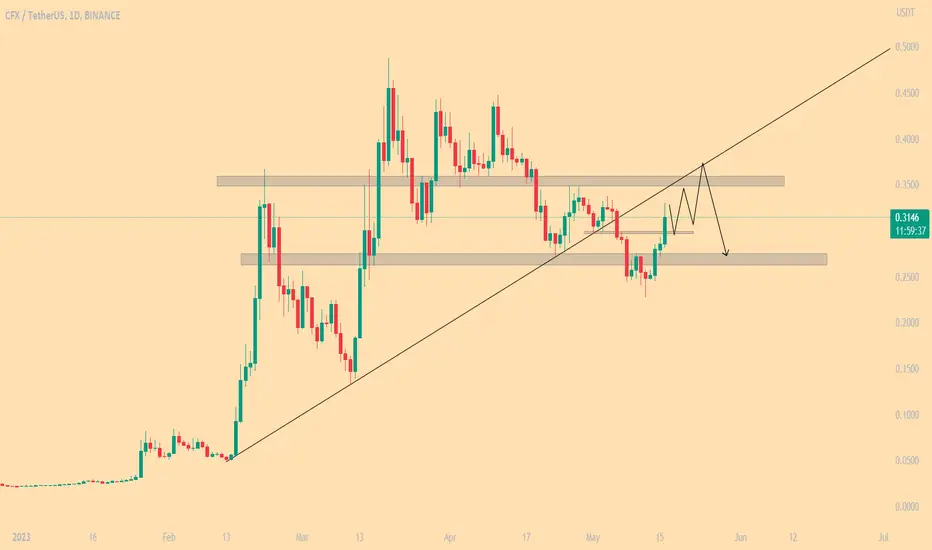
CFX breakout of daily support zoneCFX had a nice pump and breakout of a long accumulation phase. The signal tested the daily support zone, during a pullback and wasn't able to pass this test. CFX broke through the support area.
Depending on the market situation there could be a re-test of the breakout from there it is important how the signal interact, with the new resistance zone..

CfxThe critical green level was supported, to correct towards the red line, and back towards the green line
Cfx Update Cfxusdt
Retested the daily support I am expecting a bullish move from this support
Persnol opinion not financial advice , Do your own research
CFX aim at 0.566~0.594h time frame
-
CFX creating a great wedge.
Here is a nice entry with low potential loss.
Target: 0.566~0.59
SL: breaking below wedge
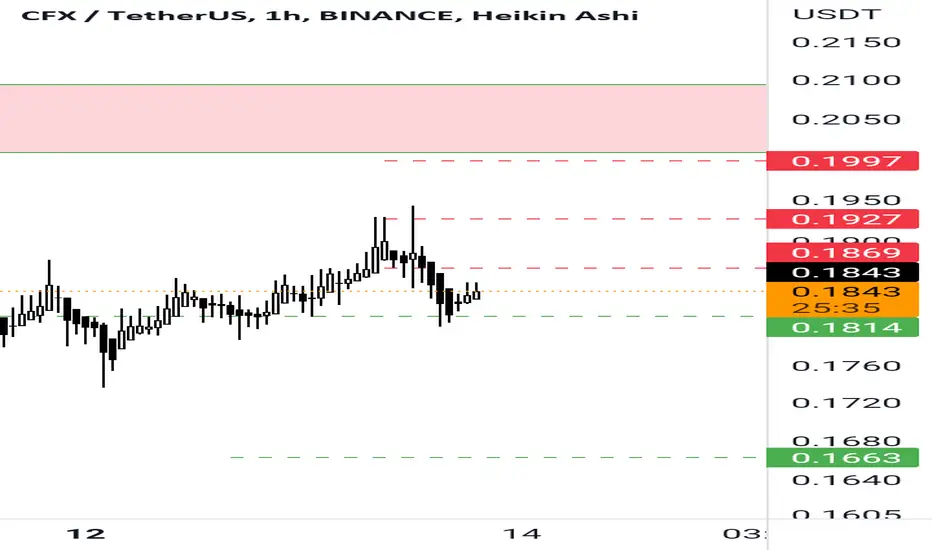
This is what I have for CFX on the 1 Hour.This is very RISKY. However CFX had its liquidity sweeped out alongside with bitcoin. There is an equal highs at 0.2928 with an imbalance right above it which is a deadly combo for price magnets. At some point price will be attracted to this area and this is a very good area to fully exit this trade. My stop loss is very tight here.

🔥 CFX First Daily Oversold In 2023 Bounce IdeaCFX has seen incredible gains in the start of the year. However, we've been largely been trading rangebound since the March top.
As of today, CFX's daily RSI is on the edge of being oversold. This is the first time since half December that the RSI has hit daily oversold levels. This is significant because it has taken 6 months for it to happen, hence I'm anticipating bulls to step in.
Keep in mind that we're currently in a news-related event, so volatility is to be expected. The signal will activate once the daily RSI has closed below 30.

Everything is about price action. CFX has experienced a movement in the last few weeks and It seems that it tends to behave like that right now. If so, it is expected to touch the 0.25 area in the first step and then grow up to 0.35 area.

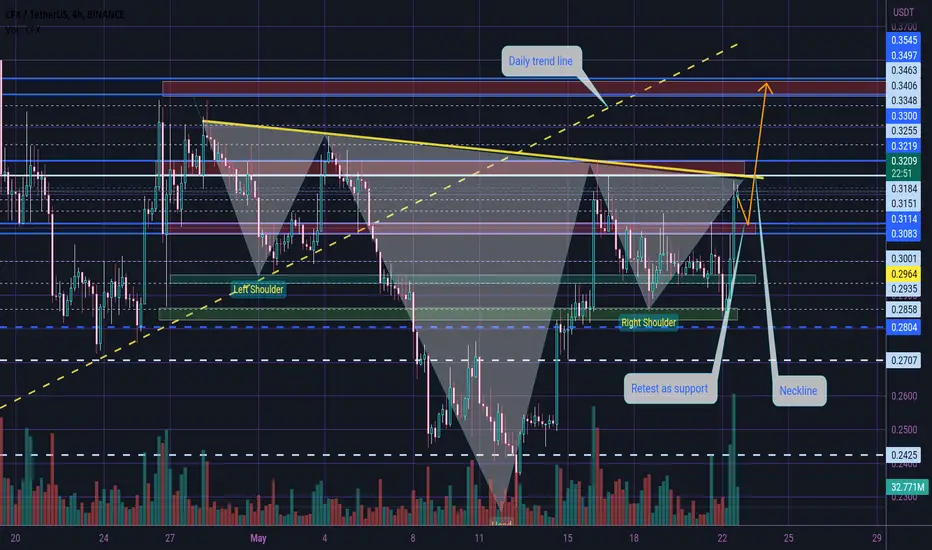
CFX FORMING H&S PATTERN 😎☄😎☄😎☄Hi dear traders
As you saw in the previous analysis, we took full profit.
Price has now broken the 0.31 resistance area and formed a bullish H&S pattern.
If the neck line is broken, the price can rise to the specified area and test the daily uptrend line as resistance.
Possible retest 0.31 area as support , if lost this area then price go down to near 0.3 support area.
All targets specified
Let's see what happens
This is not financial advice ( DYOR )
Good luck
CFX Buy Limit 🤓✅🤓✅🤓Hi dear traders
As you saw in the previous analysis, we got full profit.
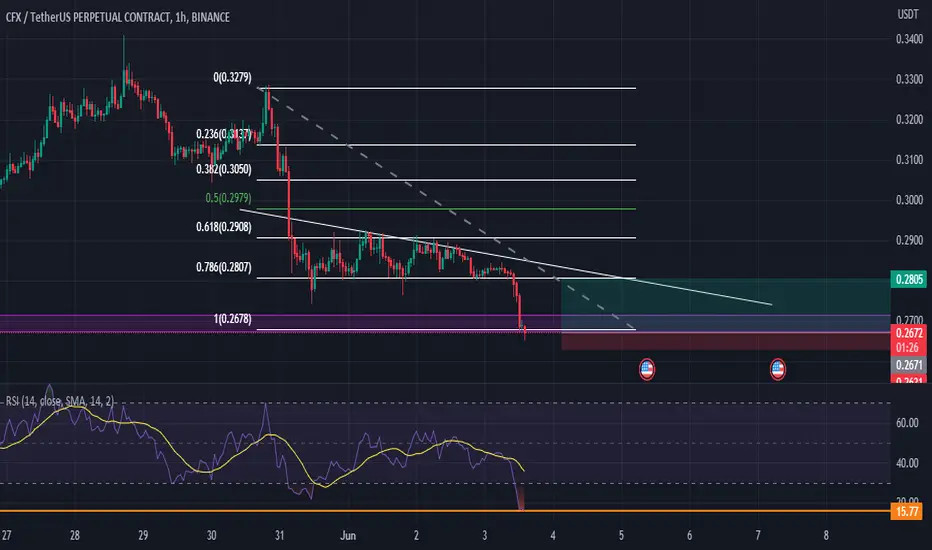
The price is moving in the descending channel and the RSI is oversold, if the area of 0.2627 and 0.2573 holds, we can open a long position and take profit in the short term.
Let's see what happens
All targets specified
This is not financial advice ( DYOR )
Good luck

CFXUSDT might start upward movementHi Trading lovers
Hope everything goes great.
As we can see, CFX is hitting Daily O.B. and hence it's a strong liquidity area it's likely to starts an upward move. So we wait to see a confirmation candle above the O.B. upper line. There are two inefficiency area which the price probably would hit. Everything are clear on picture.
Tell me what's your idea?
Good luck and make money ;)
Disclaimer:
This is just an idea and not to be consider as an financial advise. Always DYOR coz money doesn't grow on trees.

CFX/USDT Waiting for a good entry! Hey traders 👋
CFX/USDT is net one that caught our attention here. We are looking for some fall here which will lead the price to a potential "Double Bottom" pattern. The road here is long bit for now all we gotta do is wait for that "buy zone."
If you like ideas provided by our team you can show us your support by liking and commenting.
Yours Sincerely,
Swallow Team
Disclamer:
We are not financial advisors. The content that we share on this website are for educational purposes and are our own personal opinions.

CFXUSDTJust like the previous chart I mentioned for cfx, it lost its support and went out of the trend line. Now we are witnessing rebalancing and returning to the trend line. I think we will see a downward trend in the long term.
⚠️ "Daily crypto market analyses I provide are personal opinions & not financial advice. Trading carries risks, so do your own research & seek advisor's help."
Analysis of CFXThis is not investment advice. Investing requires caution and implementing stop-loss strategies.

CFXUSDT LONGAs you can see, the RSI fits the fibonacci perfectly at a very good level.
I will try without taking too much risk.
Good luck to everyone
CFX Sell Limit 🤓✅🤓✅🤓✅Hi dear traders
As I said in 4H time frame, price retest daily trend line.
Now we can open short position and take profit 📈 in short term with suitable R/R.
All targets specified
Let's see what happens
This is not financial advice ( DYOR )
Good luck
Overview of Cryptocurrency Volatility - 1h, March, 2023.Analysis of the volatility index in March. Time interval - 1 hour.
Currency - USDT or equivalent to BUSD .
The selection is carried out according to the lists of cryptocurrencies that are represented on the spot and futures markets, with a total of more than a hundred coins.
Top 15 Coins (1 hour):
1. CFX /usdt.p - 1211.77% (High&Low: 2641.12%)
2. STX /usdt.p - 1052.51% (High&Low: 2191.65%)
3. ACH /usdt.p - 1018.25% (High&Low: 2094.36%)
4. MAGIC /usdt.p - 1017.93% (High&Low: 2076.21%)
5. AGIX /usdt.p - 984.41% (High&Low: 2078.51%)
6. MASK /usdt.p - 948.87% (High&Low: 2023.86%)
7. RNDR /usdt.p - 898.77% (High&Low: 1892.08%)
8. SSV /usdt.p - 897.25% (High&Low: 1969.96%)
9. IMX /usdt.p - 896.33% (High&Low: 1892.39%)
10. TRU /usdt.p (Start: 07.03.2023 12:00 Etc/UTC) - 895.61% (High&Low: 1860.32%)
11. COCOS /usdt.p - 888.94% (High&Low: 1785.18%)
12. SNX /usdt.p - 874.79% (High&Low: 1758.15%)
13. LINA /usdt.p - 871.60% (High&Low: 1871.66%)
14. REN /usdt.p - 857.17% (High&Low: 1821.97%)
15. HIGH /usdt.p - 852.51% (High&Low: 1774.44%)
The coins showed the worst result: BNB /usdt.p - 301.11% (High&Low: 607.70%), JOE /usdt.p (Start: 29.03.2023 12:00 Etc/UTC) - 79.41% (High&Low: 199.67%)
Full list of analyzed coins: tradingview.sweetlogin.com
Analysis information for all coins: docs.google.com
Thanks for your attention!

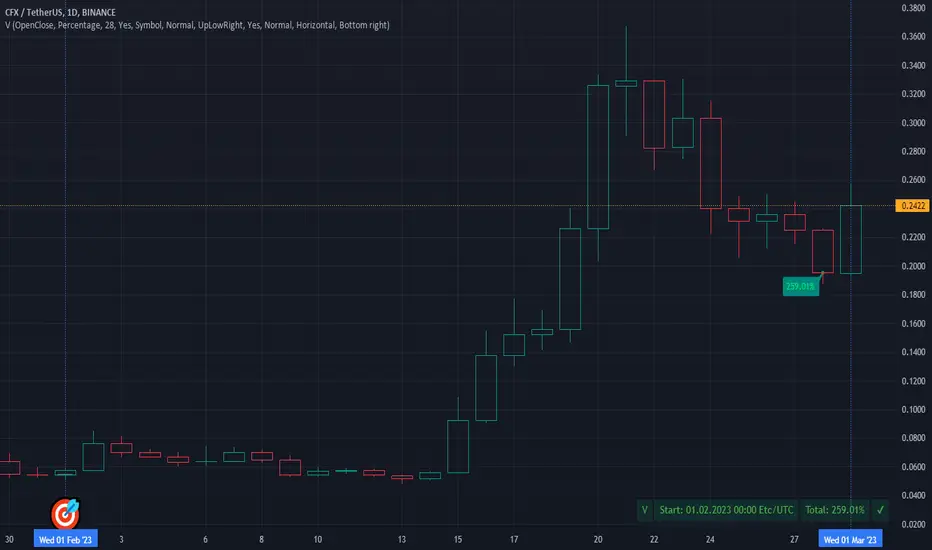
Overview of Cryptocurrency Volatility - 1M, February, 2023.Analysis of the volatility index in February. Time interval - 1 month.
Currency - USDT or equivalent to BUSD .
The selection is carried out according to the lists of cryptocurrencies that are represented on the spot and futures markets, with a total of more than a hundred coins.
Top 15 Coins (February):
1. CFX /usdt - 259.01% (High&Low: 585.29%)
2. STX /usdt - 221.27% (High&Low: 258.33%)
3. COCOS /usdt - 207.41% (High&Low: 350.22%)
4. DODO /usdt - 93.87% (High&Low: 172.27%)
5. GRT /usdt - 71.85% (High&Low: 167.68%)
6. STG /usdt - 67.69% (High&Low: 129.14%)
7. FET /usdt - 59.93% (High&Low: 127.56%)
8. BLZ /usdt - 52.70% (High&Low: 89.89%)
9. ANKR /usdt - 51.91% (High&Low: 124.24%)
10. NEO /usdt - 46.63% (High&Low: 97.31%)
11. XEM /usdt - 44.32% (High&Low: 113.24%)
12. DUSK /usdt - 42.14% (High&Low: 105.95%)
13. IMX /usdt - 40.75% (High&Low: 79.76%)
14. MTL /usdt - 39.34% (High&Low: 157.03%)
15. PHB /usdt - 39.18% (High&Low: 84.39%)
The coin showed the worst result: BTC /usdt - 0.07% (High&Low: 16.86%).
Full list of analyzed coins: tradingview.sweetlogin.com
Analysis information for all coins: docs.google.com
Thanks for your attention!