👀The Big picture $cfx analysis general outlook👀.Monthly Chart!If you ever wonder where we are in terms of potential, take a good look at this monthly chart and understand where you are before you freak out BTC's 1% baby drops. 👀Let Me Show You!👀 RSI is at 17 and volume reached historical high(Even Feb candle only 5 days in 25 days to go)! One needs to be completely aware of the whole picture before focusing on 15 min to 4hour candles. I personally believe we going to see one large monthly candle based on the data provided. Extremely unreasonable low rsi and record high volume is pretty much self explanatory! It took a lot less volume to move this 4x at once. Imagine If we all decide to go to same direction! Win- Win right!
CFXUSDT.P trade ideas

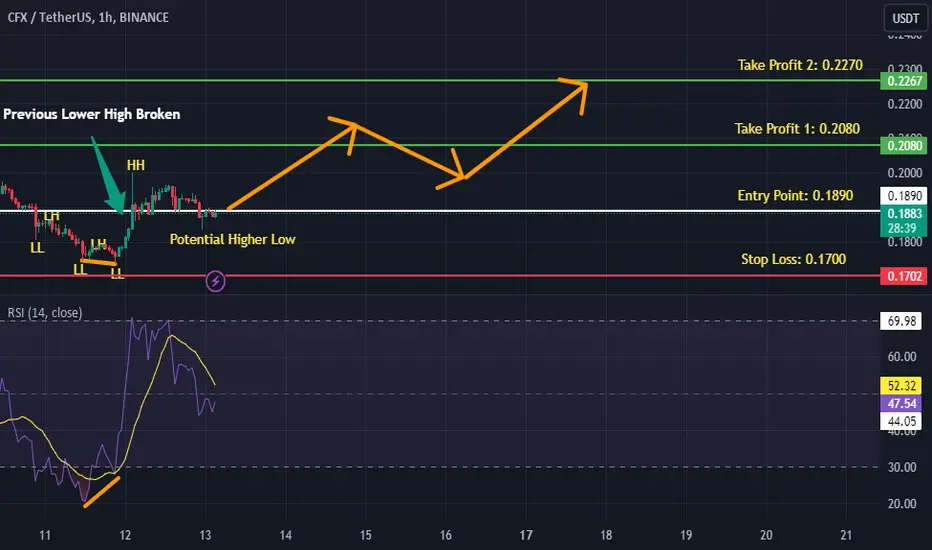
CFXUSDT is BullishPrice was in a strong downtrend, however it found support and bullish divergence also appeared after which a strong upward move was made by the bulls. Price seems to have defined a higher low and is now again looking good to move up and smash previous higher high. Targets are mentioned on the chart.
What's Going On With CFXHello everyone
As shown CFX is warming up for a new bull run with a (Leading Diagonal wave).
I see 0.188$ is the bottom.
Wave (3) target: (0.7-1) $
Wave (5) target: (3-7) $
Best luck

CFX Long Trade SetupCurrent Situation:
Price Level: CFX has broken the 50-day Moving Average (MA) and the daily downtrend, showing potential for a bullish move.
China Narrative: Based on recent positive news related to China, there might be a pump affecting Chinese tokens, including CFX.
Trade Strategy:
Entry Point: Enter a long position at the current price or within the range of $0.223 to $0.227.
Take Profit Targets:
First Target: $0.242
Second Target: $0.258
Stop Loss: Set a stop loss at a candle close below $0.22 to manage risk.
Summary:
CFX has shown signs of turning bullish after breaking key technical levels and could benefit from the recent positive China-related news. The trade strategy involves entering at the current price or slightly below, with profit targets set at $0.242 and $0.258. The stop loss is set to trigger on a candle close below $0.22 to minimize potential losses.

CFX looks bullishThe price compression is seen on the support.
We have a bullish iCH on the chart.
The trigger line is broken.
By maintaining the demands, it can move towards the targets.
The targets are clear on the chart.
Closing a daily candle below the invalidation level will violate the analysis.
For risk management, please don't forget stop loss and capital management
When we reach the first target, save some profit and then change the stop to entry
Comment if you have any questions
Thank You

CFX, a SLEEPING TIGER about to be AWAKEN -- soon!CFX registered significant net buying this past few days. Volume surging with the recent good news about DWF Labs acquiring more CFX tokens believing in the coin's fundamental growth.
On Daily data, Histogram has recorded another higher lows conveying that buyers are cementing the current range as the new base for the incoming price valuation. Pricewise, new higher lows was created as well. On WEEKLY, a shifting priceline is also noticeable depicting initial stage of a trend reversal.
Bubble up volume (bottom indicator) has reappeared many times the last 3 weeks -- suggesting active ACCUMULATION and net positioning.
Expect some significant bounce from the present price level.
Spotted at 0.2000
TAYOR
Safeguard capital always.

#CFX/USDT#CFX
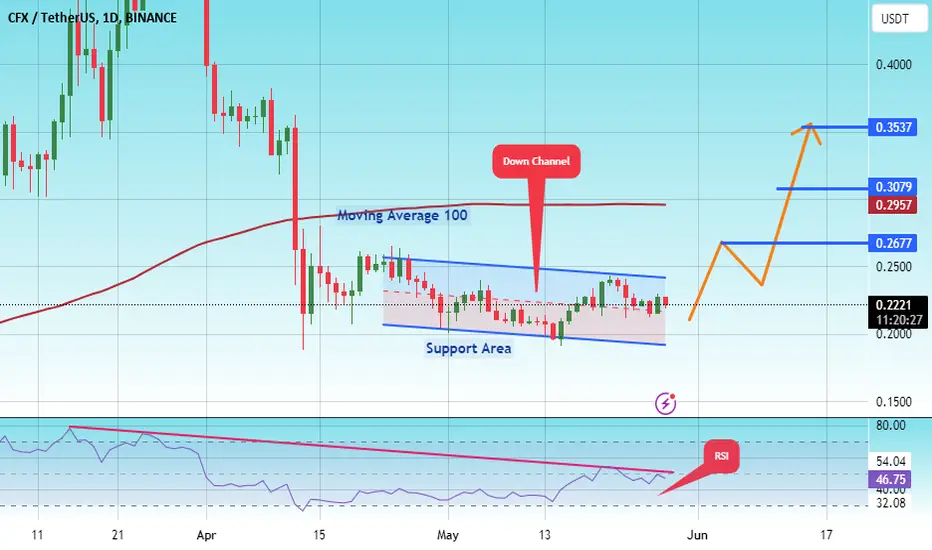
The price is moving within a bearish channel on a 1-day frame and is strongly committed to it.
We have a support area at 0.1935 and we bounced from it at the lower border of the channel
We have a tendency to stabilize above the Moving Average 100
We have a downtrend on the RSI indicator that supports the rise
Entry price is 0.2100
The first target is 0.2677
The second target is 0.3079
The third goal is 0.3537
Conflux (CFX) to $2.20On the above 3-day chart price action has corrected 80% since March of this year. (Remember 90% of traders lose money, this is now reflected in price action). A number of reasons now exist to be long, including:
1) Price action and RSI resistance breakouts.
2) Price action finds support on the Golden Ratio. How you should think of this, there’s more buyers now than sellers.
4) Notice the support on the 21-week EMA? (Blue circles). Look now where price action has confirmed support.
5) The bull flag. From the flagpole to the breakout a 1500% measured move is forecast. This is $2.20.
6) GRM support is confirmed.
Is it possible price action continues to correct? Sure.
Is it probable? No.
Ww
Type: trade
Risk: <=6%
Timeframe to act: Now
Return: 1500%

#CFXUSDTThis coin still look very bearish, will follow the monthly and daily bias which shows bears for now, till i get a good confirmation about the bulls before i go long
I remain bearish for now
#forex #forextrading #forexsignals #crypto #forexlifestyle #money #lifestyle #trade #stock #cash #iphone #daytrading #currencytrading #tradingonline #swingtrading #profit #forextips

Conflux Smart Trade- All in Graphic
- i really doubt it will back to bottom but " who knows ?".
- Now : Nothing to buy yet.
- i do not play a breakout with CFX. Dangerous.
---------------------------------------------------------------
Trading Part
---------------------------------------------------------------
Buy : 0.1$ ish ( 10% invest )
Buy : 0.055$ ish ( 20% invest )
Buy : 0.02$ ish ( 70% invest ) ( Bottom )
---------------------------------------------------------------
TP1 : 0.6$
TP2 : 1.6$ (ATH)
---------------------------------------------------------------
- Don't be greedy with my numbers.
- Set your own SL if you are a scalper.
- Set your own Take Profit.
- Be Logic & Make Money.
Happy Tr4Ding !

cfxusdtfor long Time to be $$$
entry points
1" 0.2 (15%)
2" 0.1441 (45%)
3" 0.11 (30%)
4" 0.10 (10%)
and sleep on it and go away till
8 (70%)
10 (10%)
11 (10%)
16 (10%)
CFX Bullish Signal! Time to Retest and Boom!Hey Traders! 🌐📈
🚩 CFX Flag Pattern Alert:
CFX has just signaled a flag pattern and successfully executed a breakout! 🚀
🔄 Retest Phase:
It's currently in the retest phase, revisiting the breakout level.
This retest is a crucial step before potential further upside.
💥 Boom Anticipation:
📉 Retesting is healthy; anticipate a strong move upward after this phase.
📊 Technical Analysis:
Use technical indicators to confirm the retest support level.
Look for bullish confirmation signals before considering entry.
💡 Trading Strategy:
Consider entry post-retest confirmation.
Set stop-loss and take-profit levels to manage risk.
🚨 Risk Advisory:
Trading involves risks; trade responsibly and set risk management.
Do your due diligence; this is not financial advice.
🌟 Exciting Times Ahead!
Trade smart and good luck! 🚀💰

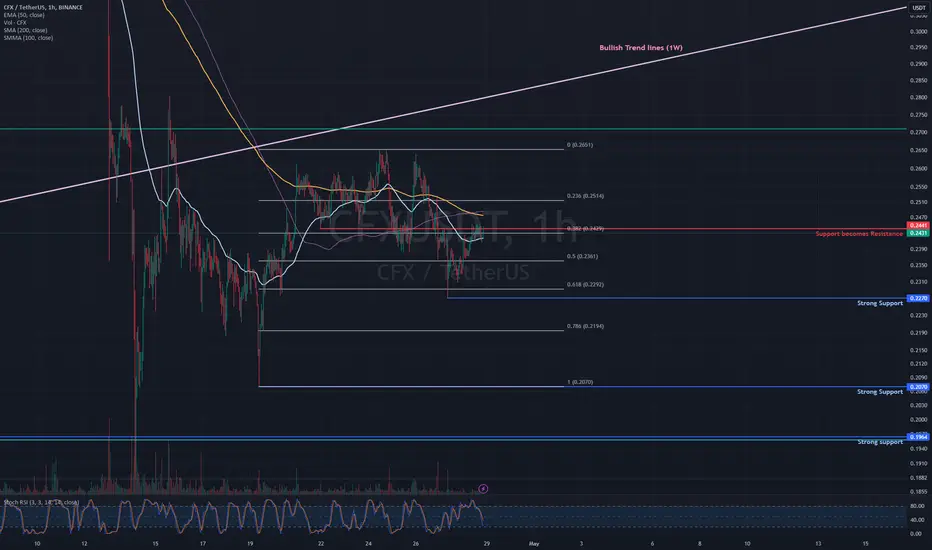
CFXUSDT Spot IdeaConflux (CFX) is a public layer-1 blockchain that is more scalable, decentralized, and secure than existing protocols and is designed to power decentralized applications (dApps), e-commerce, and Web 3.0 infrastructure.
Conflux makes it easier to transfer valuable assets by making the process quick, effective, free of network congestion, and with low transaction costs. The platform is based on the Tree-Graph consensus mechanism, and it combines Proof-of-Work (PoW) and Proof-of-Stake (PoS) algorithms to achieve consensus. The protocol uses Turing-complete smart contracts written in Solidity, just like those on Ethereum, and is compatible with the EVM (Ethereum Virtual Machine).
Conflux is currently trading at the resistance area. If the price manages to cross $0.2441 and touches the 100 SMMA at $0.2475, then Conflux will resume its bullish short-term trend.
However, if Conflux fails to break out of the resistance area, the price may re-test the support level at $0.2270.
Please note that this is analysis only and not financial advice. The market determines price movements and cannot be predicted with precision. Traders and investors should adjust their risk levels accordingly.
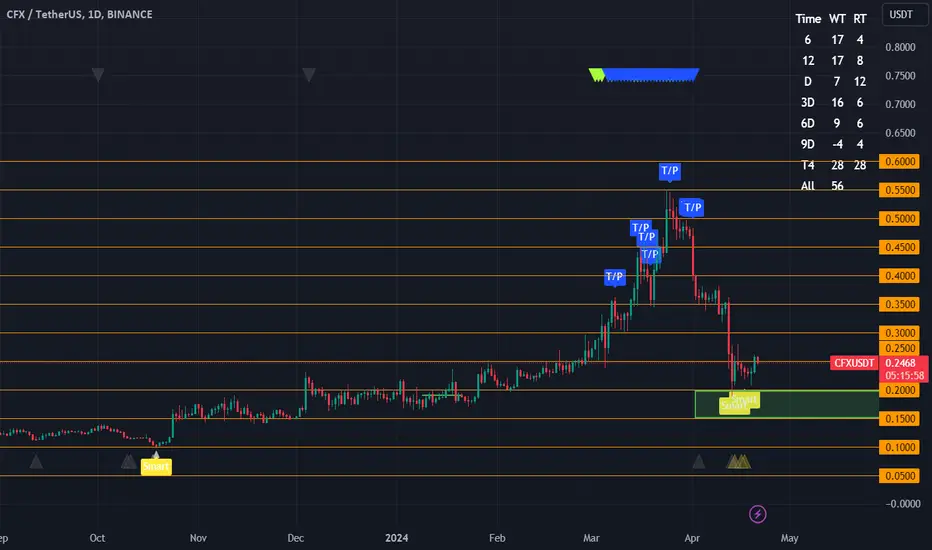
Conflux Network (CFX)Conflux Network is a state-endorsed public blockchain in China, aiming to enhance interoperability and scalability through its Tree-Graph consensus algorithm. This technology allows Conflux to process transactions with increased speed and efficiency, promoting itself as a choice platform for developers and enterprises looking to build decentralized applications.
As of now, the price of Conflux (CFX) is $0.25 with a 24-hour trading volume of $75 million. The price of CFX has risen by 30% in the last 24 hours, showcasing strong market interest and bullish momentum.
Given the current positive trajectory and the unique position of Conflux in the blockchain ecosystem, the next potential price targets for CFX might be $0.35, $0.45, and $0.6.
This trade setup assumes continued market interest and investor confidence in the Conflux Network's strategic initiatives and technological foundation.
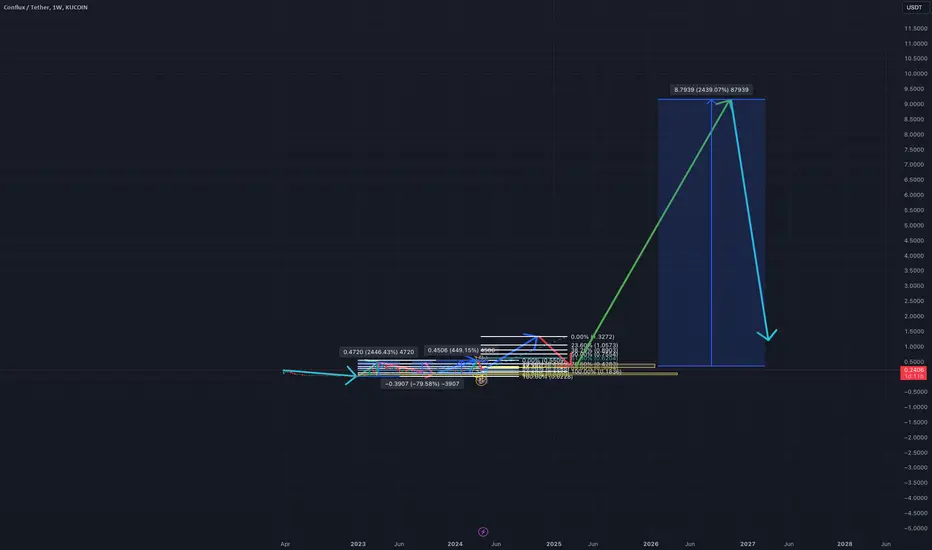
CFX The full road map of it .
theory of history repeats it self .
1$, to 9$.
it might happen in weeks, months or years maybe decades that i cant tell .
CFXUSDT.1DIn this technical analysis of the CFX/USDT daily chart, we're seeing a pronounced downtrend. The price has fallen below the first resistance level (R1) at $0.2862 and is approaching the first support level (S1) at $0.1735. If this support fails to hold, it might result in the price testing the second support level (S2) at $0.1452.
The RSI is just above the oversold threshold at 31.07, indicating that the selling pressure has been strong and may potentially ease if the market perceives the asset as undervalued. The MACD is below zero and showing a bearish histogram, which aligns with the downward movement.
For a trend reversal, we would need to see a close above R1, with the RSI moving out of the oversold region and the MACD histogram trending towards the baseline. However, the current chart suggests that sellers are in control, and traders should be cautious. It's important to look out for any bullish patterns or signs of a momentum shift, but also be prepared for the possibility of a continued downtrend, especially if S1 is breached. Keep an eye on broader market sentiment and news that could impact the price action.

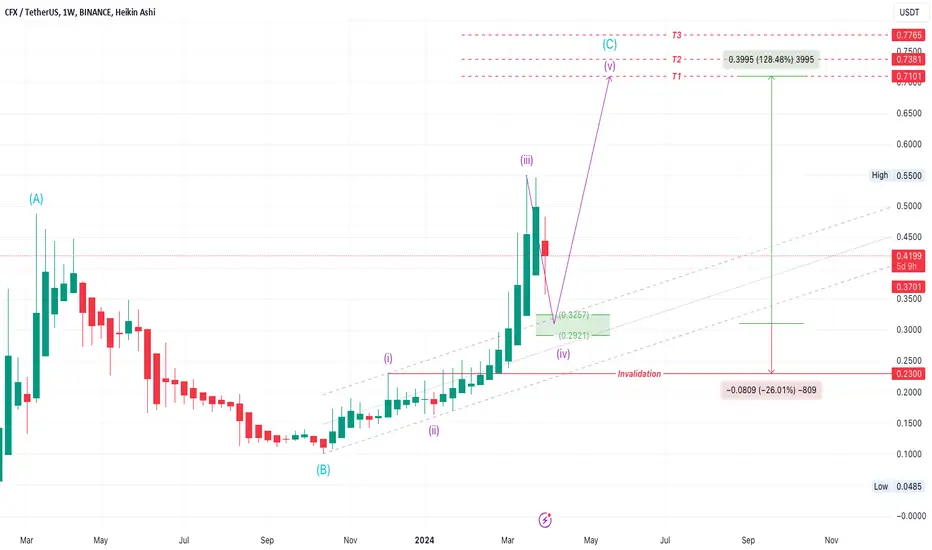
CFXUSDT long Spot TradeCFXUSDT Elliott Wave Technical Analysis
Mode: impulse
Position: Wave (4)
Direction: Wave (4) is still in play
Details: Wave (4) is still in play which I expected to be end around 0.32-0.29 which will be my entry point.
Next Direction: Wave (5)
Target : the area between 0.7-0.77 with 130-150% profit
Wave Cancel invalid level: Daily closing below 0.23 with 26% loss.
Disclaimer:
This analysis is intended for educational and informational purposes only and should not be construed as financial advice. Always conduct your own due diligence and consult with a professional financial advisor before making investment decisions.
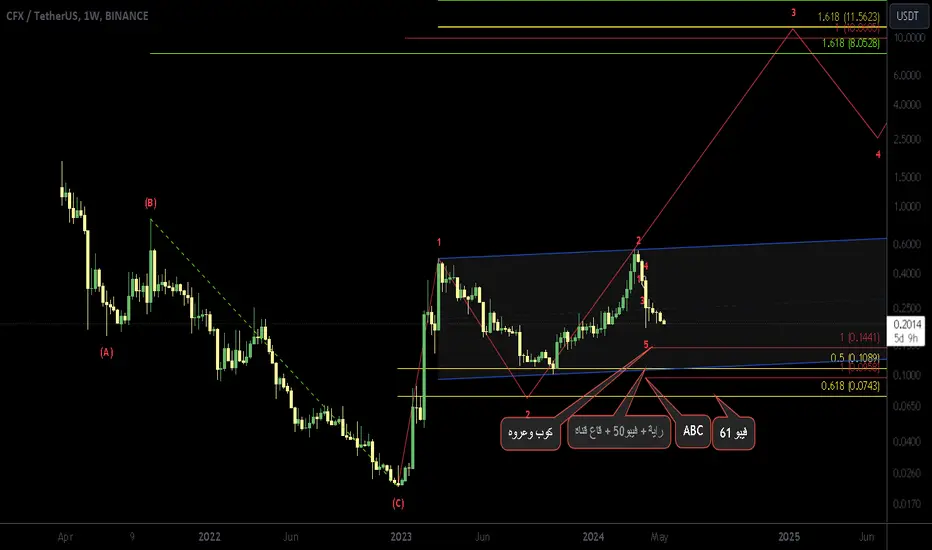
CFXUSDT long Spot Trade / after the last correctionafter the last correction CFX break the Base Channel and entered wave 2 territory, and as I see BTC and ETH not complete there correction wave yet, and the same case with most of the other Crypto, so that mean that the price will go deeper, which make our 5 impulse Wave Idea invalid.
CFXUSDT Elliott Wave Technical Analysis
Mode: Corrective
Position: Wave (c) from Blue (B)
Direction: Wave (c) is still in play
Details: Wave (c) is still in play which I expected to be end around 0.16-0.14 which will be my entry point.
Next Direction: Blue Wave (C)
Targets : 0.498, 0,585, 0.63 with 200-270% profit
Wave Cancel invalid level: Daily closing below 0.1 with 40% loss.
Disclaimer:
This analysis is intended for educational and informational purposes only and should not be construed as financial advice. Always conduct your own due diligence and consult with a professional financial advisor before making investment decisions.

Long Trade Position CFXUSDTTest your analytical skills in the tradingview simulator with virtual money to become a professional. In spot trading, I will specify the entry points, loss limit and profit limit for you! The conditions for entering the trade and our strategy are as follows, when you notice that the market trend is increasing and at least two green candles close above the entry point in fifteen minutes, you can enter the trade from the beginning of the third green candle. Be patient and don't rush to enter! After the price reaches the first target, move your stop loss below the first profit limit so that if the price reverses, your trade will be closed with profit. Repeat the above strategy to continue the price targets shown on the chart. If the price reaches or falls below our loss limit before the above condition, entering this transaction is invalid because it must be re-analyzed and the new entry, loss and profit limits must be determined. Note that the market trend is formed with clever tricks by the market maker, so even the most powerful analyzes may be invalidated. The only thing we can do is to surf the waves and stick to our strategy so that while taking care of our capital, Let's make a profit. These exercises will make you experience profit and loss with virtual money in the real market and improve your analysis and personal strategy. Know your fear and greed and gradually control them so that your business becomes profitable and you suffer less loss.

CFX/Usdt analysisHelloo again guys. It's cfx chart now we are toward strong resistance around .3450$ level i believe if price will break it then you can enter for long positiion
First tp around .3650 $ and second is around .38$ level
Guys it's just analysis donot trade only based on this post. Please do your analysis for your trades

CFX/USDT I BUY SETUP✔︎📈 BINANCE:CFXUSDT SIGNAL
✔︎ENTRY : 0.3386 to 0.3270
🏓TARGETS :
✔︎ T1 : 0.3660
✔︎ T2 : 0.3992
✔︎ T3 : 0.4402
✘STOP : 0.3130
🚦Stop Trigger:
• If you make capital management: Stop is activated when one candle opening and closing
below the stop level of the same time frame of the signal.
• If you don't make capital management: Stop is direct without waiting for the candle to close.
💡Risk management :
• Enter the trade with 10% to 20% of your capital to reduce risk and save cash to enter other opportunities.
• Sell (25% to 50%) on (T1) and don't move your stop-loss.
• Sell 50% on (T2) and move your stop loss to the entry point.
• You are safe now, and the next 25% is up to you.
💡Reason for this trade:
This trade gives my trading system a sign of strength:
• My trading system is based on liquidity and reversal zones.
• When the liquidity is swept from one side under certain conditions, we will wait for the price on the other side.
The liquidity will attract the price like a magnet.
• the first side that has been swept:
1- previous weekly low
2- failure swing point
• Opposite side targets:
1- equal high
2- inducment
3- liqudity void
💡Entry setup
1- reclaim previous weekly low
⚠️WARNING:
• I'm not a financial advisor.
• Do your own research (DYOR).

CFX/USDT: Be Aware Of A Such Scenario Hello everyone
This is scenario is very likely to happen.
The appropriate zone to buy is between (0.18 - 0.22), around 0.618 Fipo.
Best luck

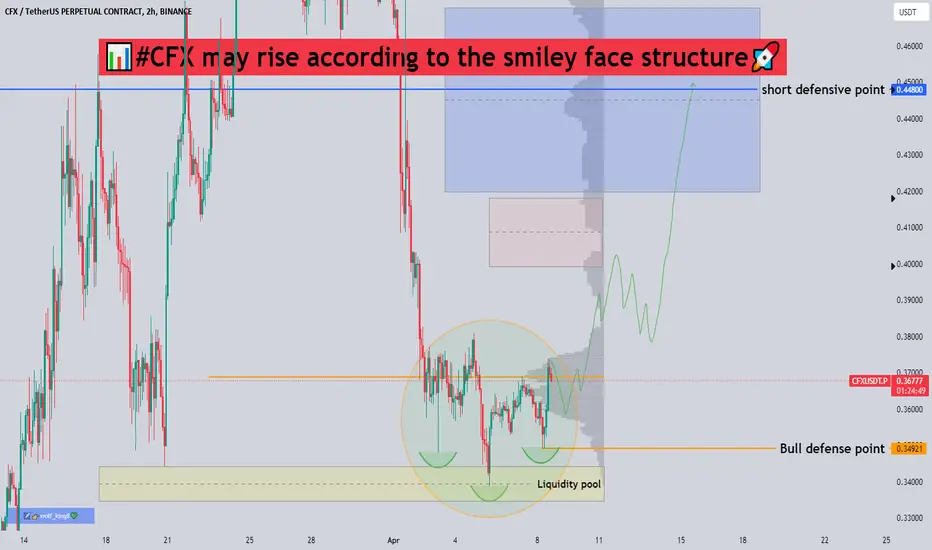
📊#CFX may rise according to the smiley face structure🚀🧠We corrected after breaking out of the all-time highs, had a high probability of a bounce after sweeping the liquidity pools, and successfully constructed a smiley face bullish structure near the buy zone that we may follow to pump.🚀
Let's see👀
🤜If you like my analysis, please like 💖and share it💬
💕 Follow me so you don't miss out on any signals and analyze 💯