Tranchess Bull Flag... Do You Agree?This one here is also a bull flag, a wide one and you know where prices are headed next.
Let me ask you a question and be honest; do you have any doubts about what I am saying? You can answer in your own mind of course but just think about it.
I say the market is bullish but consolidating.
I say t

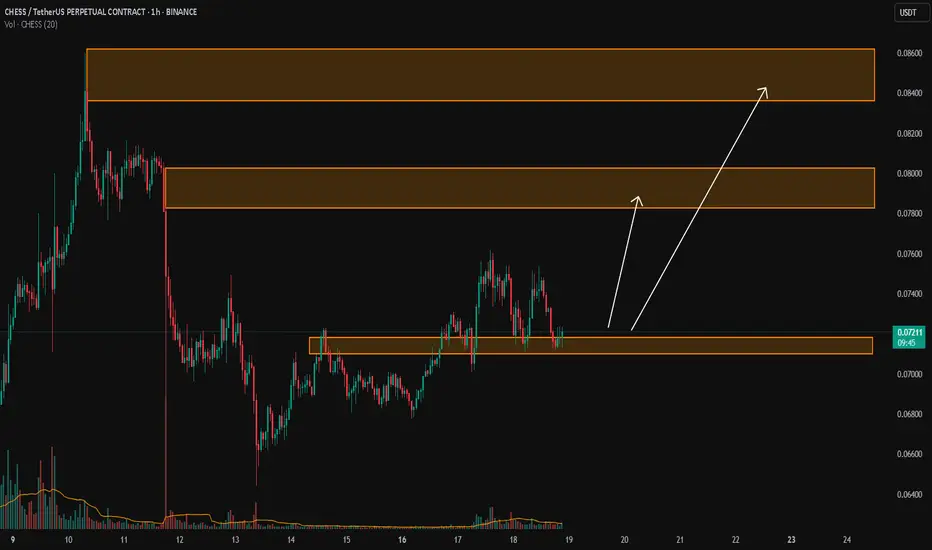
CHESS/USDTKey Level Zone: 0.07100 - 0.07180
LMT v2.0 detected.
The setup looks promising—price previously trended upward with rising volume and momentum, then retested this zone cleanly. This presents an excellent reward-to-risk opportunity if momentum continues to align.
Introducing LMT (Levels & Momentum
CHESS/USDT (1D) – Daily Trendline Breakout in PlayTradingView Idea: CHESS/USDT (1D) – Daily Trendline Breakout in Play
Pattern: Falling Trendline Breakout 📉➡️📈
Timeframe: 1-Day ⏱️
Pair: CHESS/USDT 💱
Published: June 11, 2025 📅
**Technical Overview:**
CHESS/USDT has been moving under a long-standing falling trendline, with price consistently makin
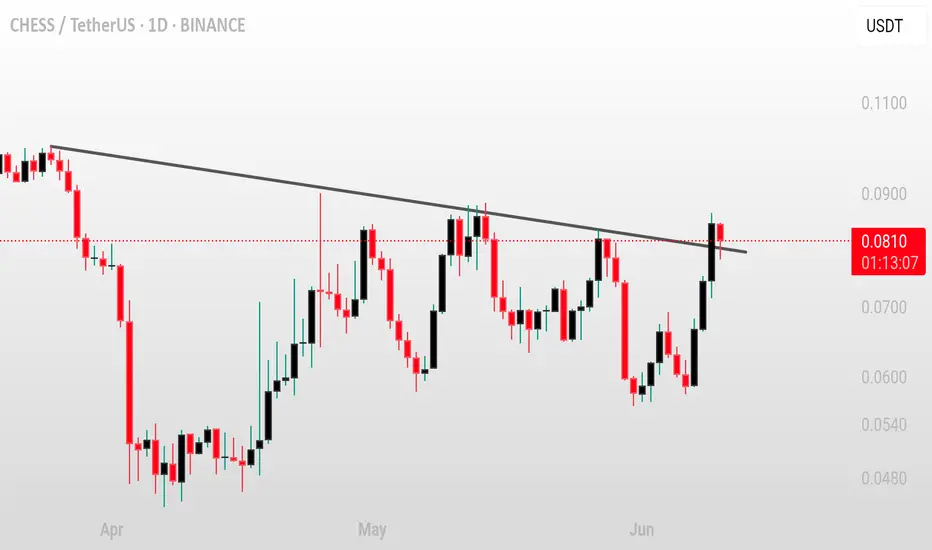
CHESS – Breakout Alert on the Daily Chart$CHESS is breaking above the descending trendline on the daily timeframe 🚀. A retest and hold here could set the stage for a bullish reversal move 👀. Watching closely for confirmation!
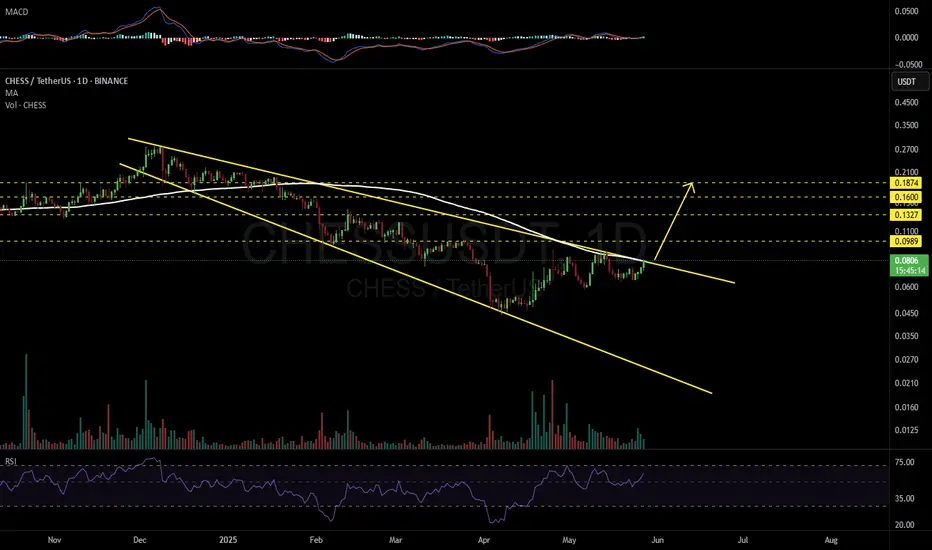
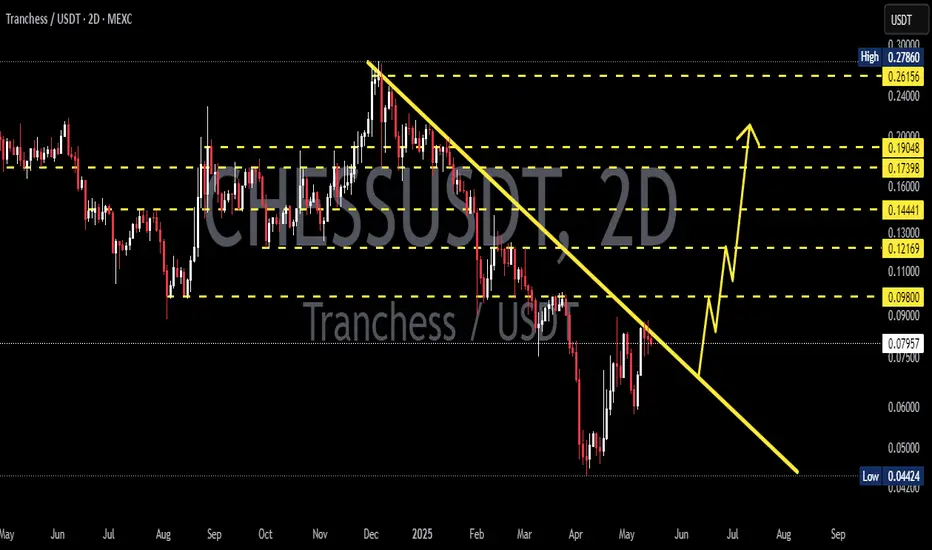
CHESSUSDT 1D#CHESS is attempting to break out above the Descending Broadening Wedge resistance and the daily MA100. 📈
If the breakout confirms, we could see a strong move toward the following targets:
🎯 $0.0989
🎯 $0.1327
🎯 $0.1600
🎯 $0.1874
⚠️ Always use a tight stop-loss — manage your risk wisely.
CHESS.USDT NEW INCREASE ROUNDEAs a trader, it's important to follow the market and the unexpected trends.
CHESS/USDT shows a possibility for a new increase in the coming time frames, after the long-term breakdown.
Let's follow the data and see if this coin is able to increase as the chart shows.
interesting to follow for the
#CHESS/USDT#CHESS
The price is moving within a descending channel on the 1-hour frame and is expected to break and continue upward.
We have a trend to stabilize above the 100 moving average once again.
We have a downtrend on the RSI indicator, which supports the upward move by breaking it upward.
We have a

CHESSUSDT 2D Analysis CHESS ~ 2D Analysis
#CHESS This trade is very high risk
Buy after successfully breaking through this resistance line with a short-term target of at least 10%+.
Possible x's on chessTo date, the market has reached the buying period of the second half of the week, which I outlined earlier. Against the background of extremely negative statistics for the United States over the past week and a half, ether sales were successfully repaid yesterday at the next bifurcation point, and p

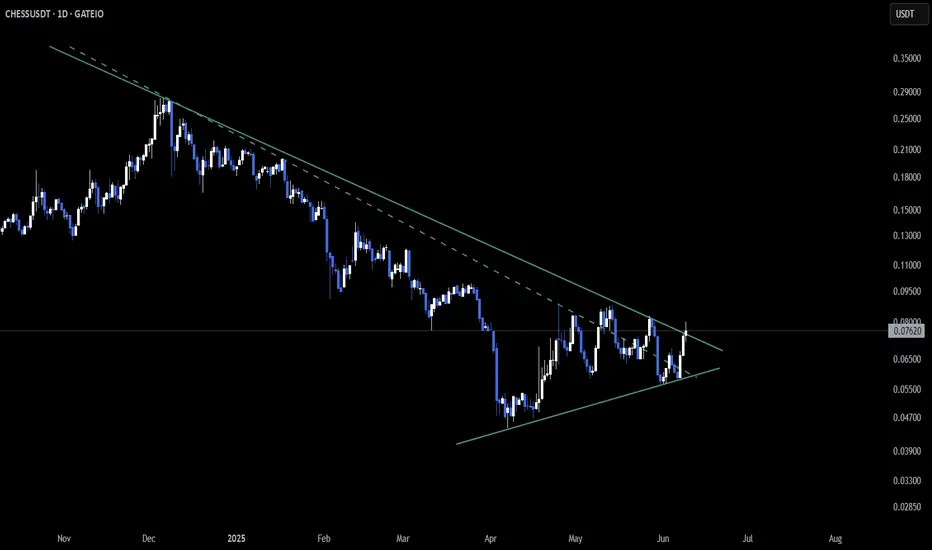
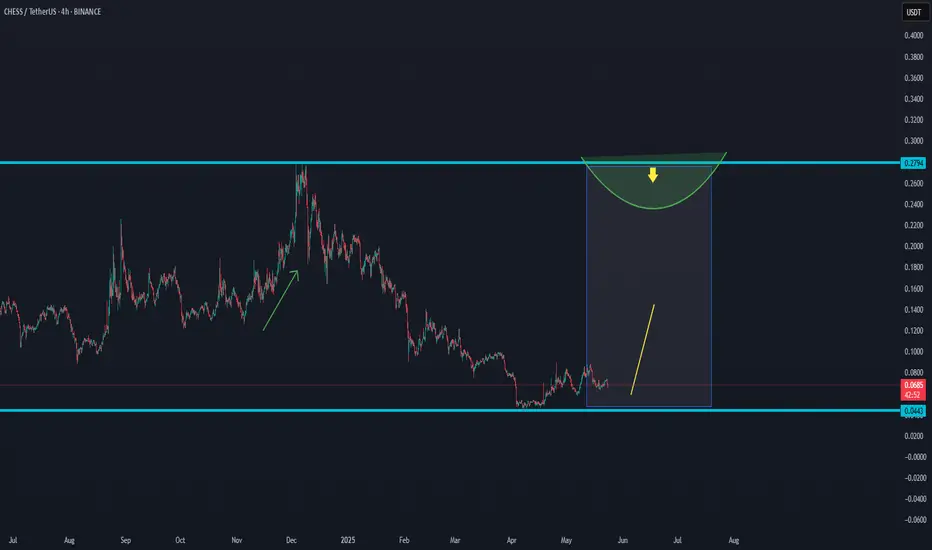
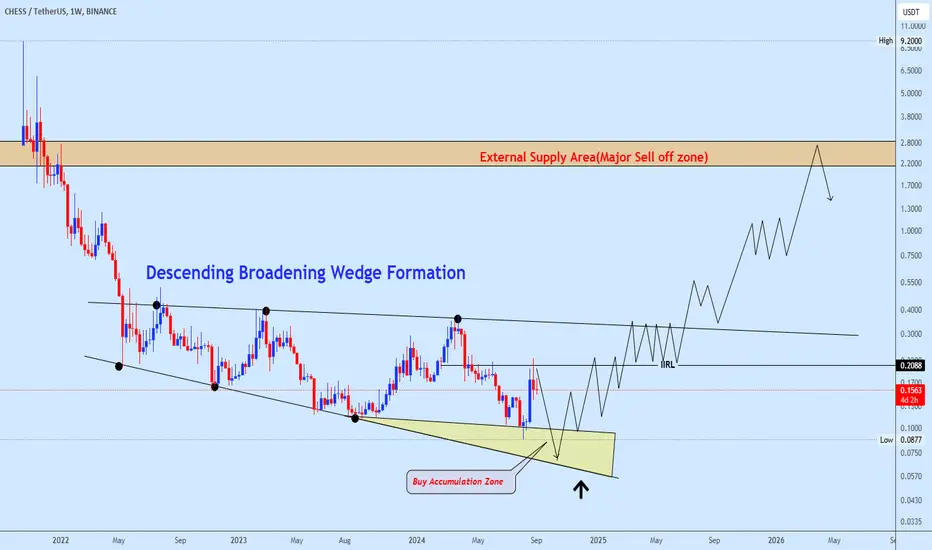
Chessusdt Trading opportunityCHESS/USDT is showing a potential ending diagonal pattern in the form of a descending broadening structure. The plan is to accumulate within the shaded zone on the chart, anticipating a reversal.
The expected price movement path is indicated, with the major external supply zone acting as a signifi
See all ideas
Summarizing what the indicators are suggesting.
Oscillators
Neutral
SellBuy
Strong sellStrong buy
Strong sellSellNeutralBuyStrong buy
Oscillators
Neutral
SellBuy
Strong sellStrong buy
Strong sellSellNeutralBuyStrong buy
Summary
Neutral
SellBuy
Strong sellStrong buy
Strong sellSellNeutralBuyStrong buy
Summary
Neutral
SellBuy
Strong sellStrong buy
Strong sellSellNeutralBuyStrong buy
Summary
Neutral
SellBuy
Strong sellStrong buy
Strong sellSellNeutralBuyStrong buy
Moving Averages
Neutral
SellBuy
Strong sellStrong buy
Strong sellSellNeutralBuyStrong buy
Moving Averages
Neutral
SellBuy
Strong sellStrong buy
Strong sellSellNeutralBuyStrong buy
Displays a symbol's price movements over previous years to identify recurring trends.